3232
Mapping Metabolite and Neurotransmitter Alterations in Mesial Temporal Lobe Epilepsy Using Optimized Multi-TE MRSI: A Preliminary Study1Department of Bioengineering, University of Illinois at Urbana-Champaign, Urbana, IL, United States, 2Beckman Institute for Advanced Science and Technology, University of Illinois at Urbana-Champaign, Urbana, IL, United States, 3Department of Electrical and Computer Engineering, University of Illinois at Urbana-Champaign, Urbana, IL, United States, 4Neuroscience Institute, Carle Foundation Hospital, Urbana, IL, United States, 5School of Molecular and Cellular Biology, University of Illinois at Urbana-Champaign, Urbana, IL, United States
Synopsis
Keywords: Epilepsy, Epilepsy, Spectroscopic imaging, mTLE, multi-TE MRSI
Motivation: Multimodal imaging integrating molecular information promises to improve seizure foci lateralization and disease progression monitoring for mesial temporal lobe epilepsy (mTLE).
Goal(s): To evaluate the feasibility of a multi-TE MRSI method optimized for simultaneously mapping metabolites and neurotransmitters in mTLE.
Approach: Volumetric multi-TE MRSI and structural MRI data were acquired and analyzed for an mTLE cohort. Regional analysis was performed to quantified molecular maps and hippocampus volumetrics.
Results: Reduced NAA/Cr ratios were observed for the ipsilateral hippocampous (epileptic side), consistent with prior findings and overall reduced hippocampus volumes. Reduced Glx/Cr ipsilaterally was observed. Interesting differences in anterior vs. posterior hippocampus were also reported.
Impact: We demonstrated the feasibility of a new MRSI technique for mapping metabolic alterations in mTLE patients. Initial results support promise for improved lateralization and better understanding biochemical mechanisms of the disease using MRSI.
Introduction
Mesial Temporal Lobe Epilepsy (mTLE) is the most common form of pharmacologically refractory epilepsy1,2, which is frequently associated with progressive mesial temporal sclerosis (MTS) in the hippocampus and eventually leads to bilateral seizure onset3,4. Although clinical MRI plays a critical role in pre-surgical evaluation for the lateralizing epileptogenic zone for dissection and post-treatment monitoring of mTLE, using anatomical features alone led to around 33% mis/false-identification of lesions5. Metabolic changes6-8 and tissue stiffness4 have demonstrated potential in improving epileptic foci localization. The recent advance in high-resolution MRSI6 also provides opportunities to study multi-regional changes in limbic networks. But molecular information provided by MRSI has mostly been limited to major metabolites such as NAA, Cr and Cho. There is an increasing interest in measuring neurotransmitter components, e.g., Glx vs. GABA to investigate excitatory/inhibitory imbalance and their connections with the progressive pathology9,10. In this study, we evaluated the feasibility of a recently developed 3D multi-TE MRSI method for simultaneously mapping metabolites and neurotransmitters in mTLE brains. While the study is ongoing, initial results from a small cohort showed promising results, e.g., reduced NAA/Cr ratios in the ipsilateral hippocampus consistent with prior findings and reduced Glx/Cr in the sclerosis side. Interesting differences in anterior vs. posterior hippocampus are also reported.Methods
Patient Recruitment and Demographics:11 patients with unilateral moderate to severe mTLE participated in this study (Table. 1). Clinical inclusion criteria were based on clear clinical diagnosis of mTLE by clinical epileptologists. mTLE severity was determined based on the clinical findings on a combination of clinical presentation, duration of seizures, EEG, T1w and T2w MRI, and/or PET. EEG findings of frontotemporal slowing and sharp waves, MRI evidence of hippocampal volume and internal architecture loss, and hypometabolism on PET.
High-resolution Multi-TE MRSI:
All patient data were collected on a Siemens Prisma 3T system with local IRB approval. The MRI/MRSI protocol included T1w-MPRAGE (1.0×1.0×1.0mm3), T2 FLAIR (0.9×0.9×5mm3), a 2-TE MRSI scan with FOV = 240×220×64 mm3, 3.8×3.4×6.4 mm3 voxel size, TR/TE = 1100/[65, 80]ms optimized for metabolite, Glx and GABA quantification12 and a B0 field map for MRSI processing (2.2×2.2×2.0 mm3). Additional sets of lower-resolution MRSI data were acquired (6.8×6.9×8.0mm3) for learning population-specific subspace for spatiospectral reconstruction. Subspace-based processing steps, i.e., nuisance water/lipid removal, augmented multi-TE subspace-based spatiospectral reconstruction11, and a multi-step metabolite quantification strategy were performed12.
Data Analysis:
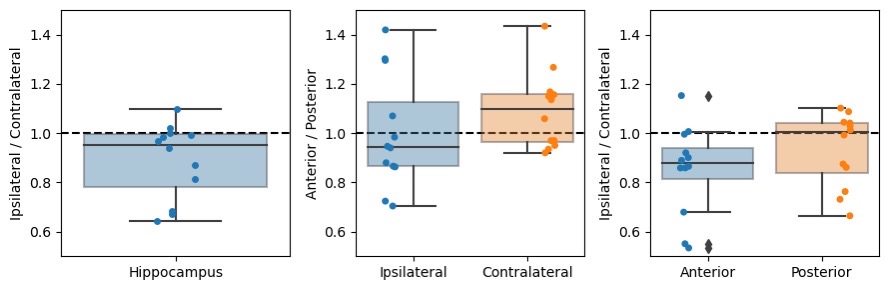
ROI masks of the hippocampus and its subdivisions (i.e., anterior and posterior) from both ipsilateral (sclerosis side) and contralateral hippocampus were generated using FreeSurfer from T1w-MPRAGE and co-registered to MRSI volume13. Gray-matter-dominant voxels (GM ratio >= 0.6) were selected from the quantified metabolite maps for regional and comparative analysis. Hippocampus volumetrics were also performed (Fig. 2). Wilcoxon matched-pairs signed rank test was conducted to compare metabolic changes in the ipsilateral and contralateral hippocampus.
Results and Discussion
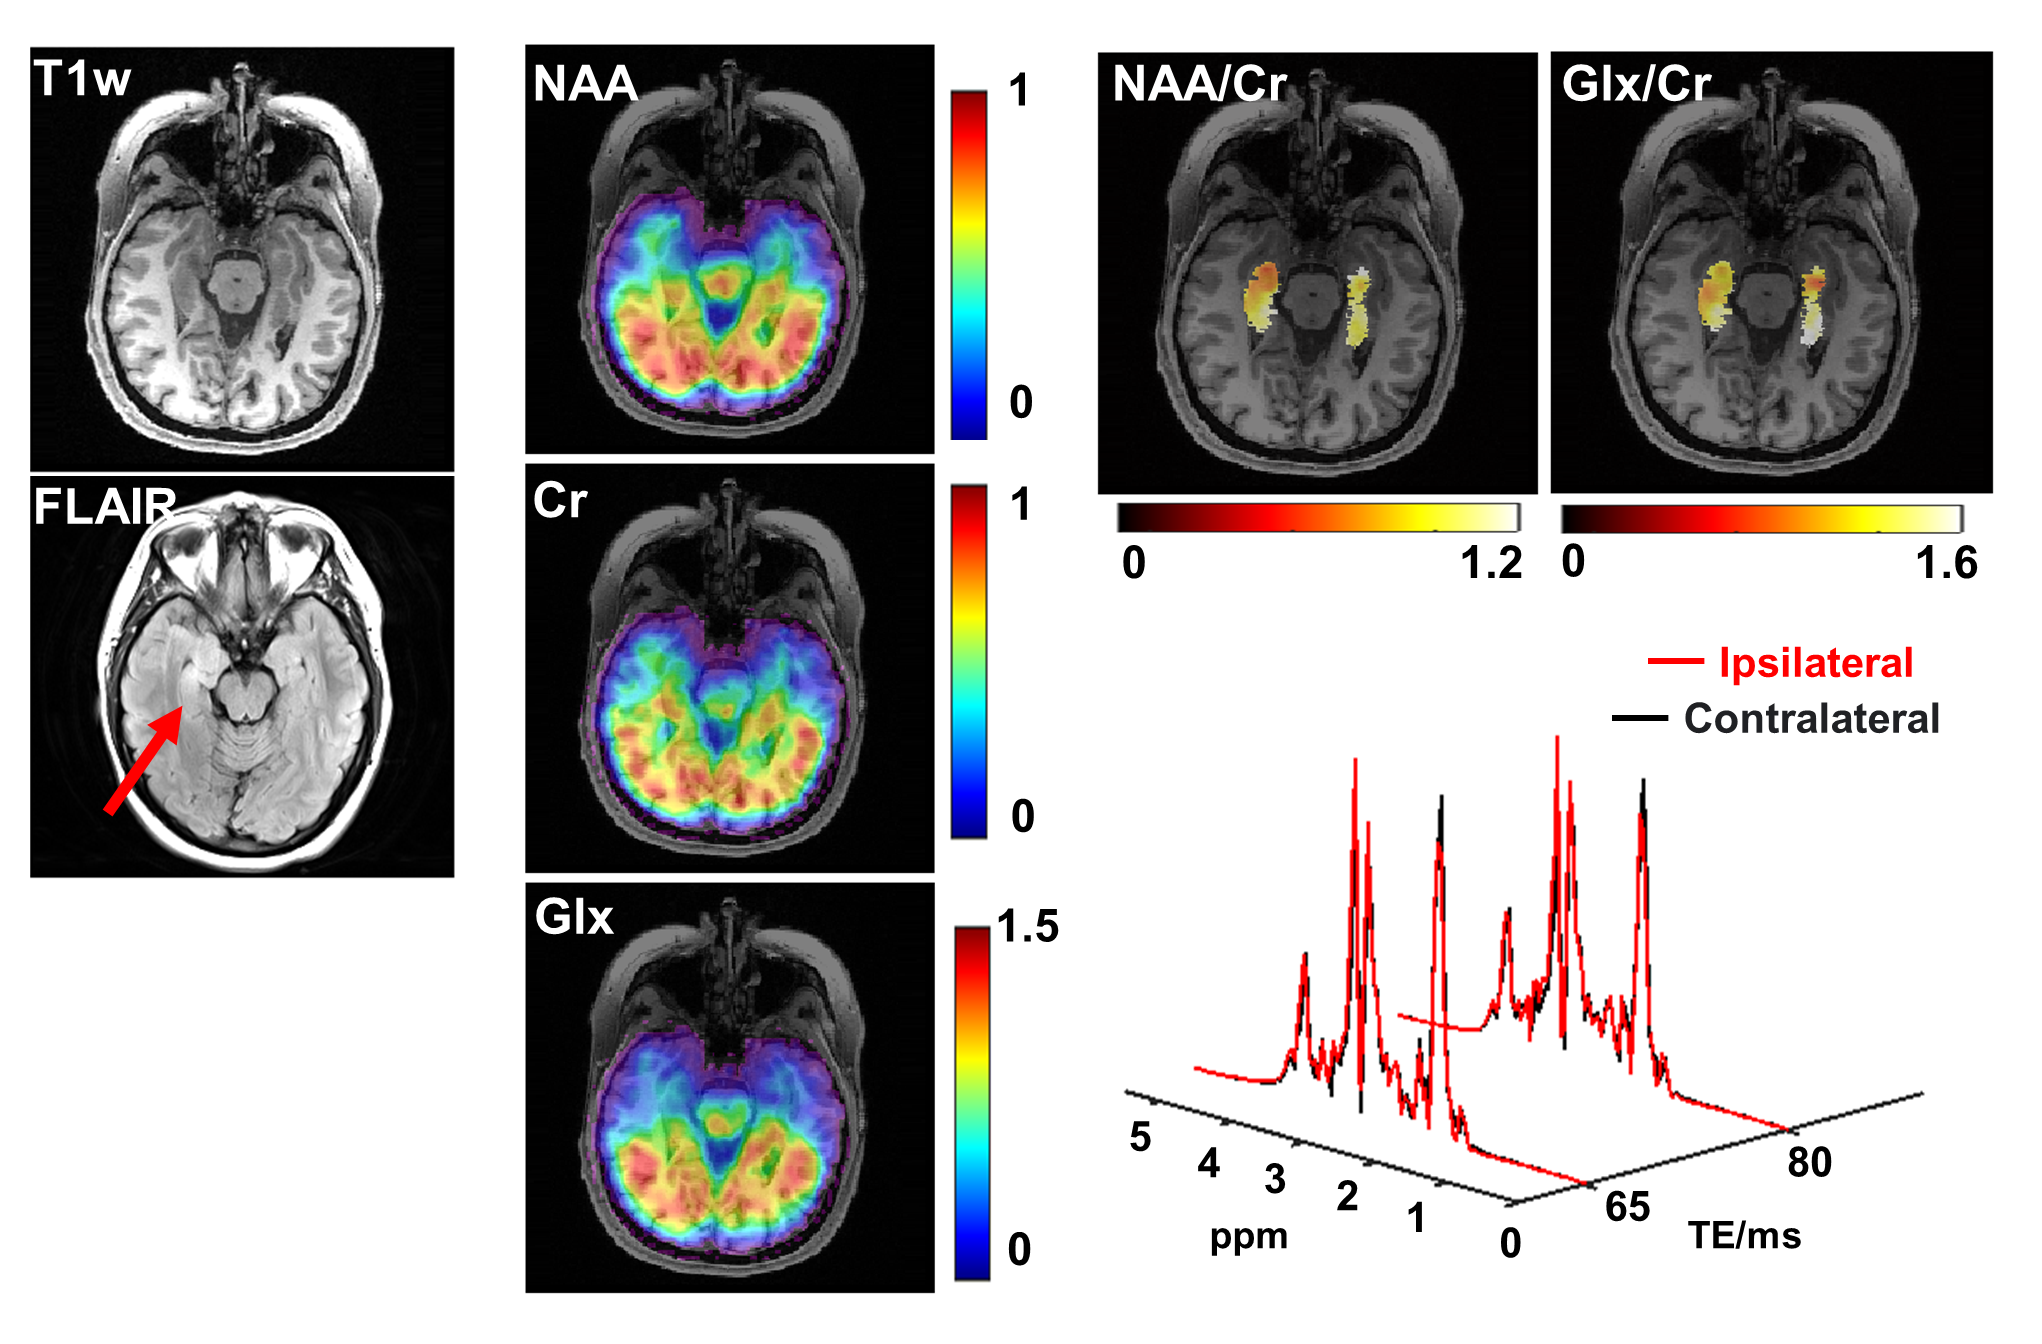
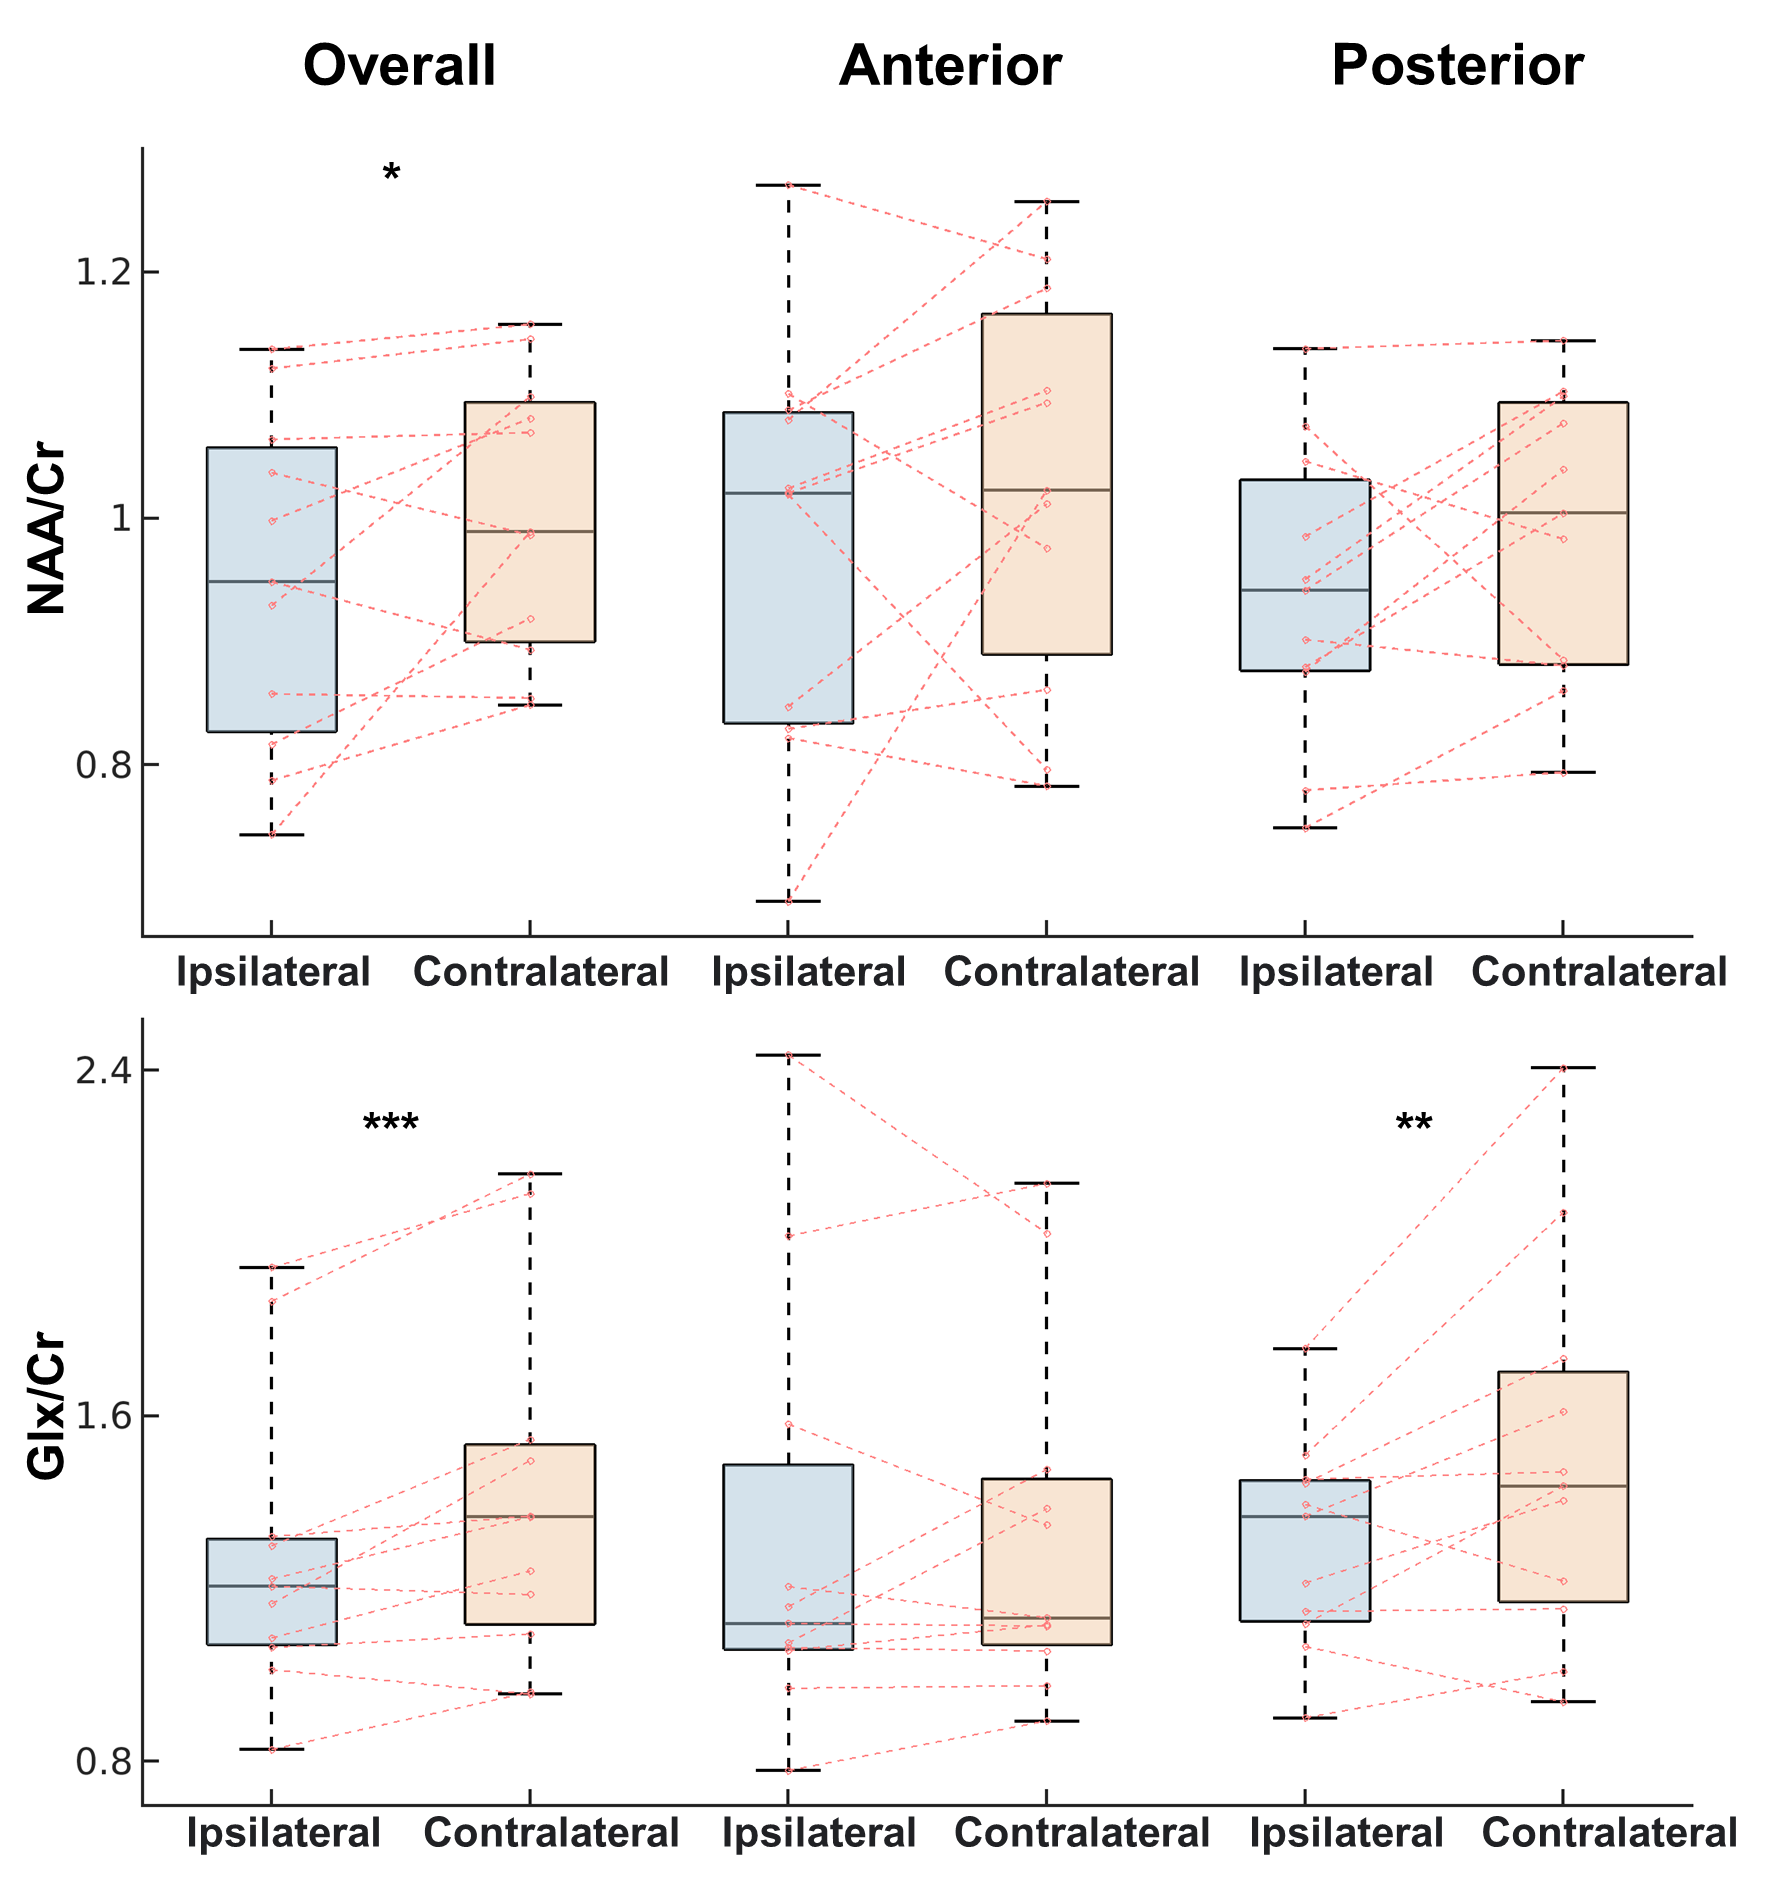
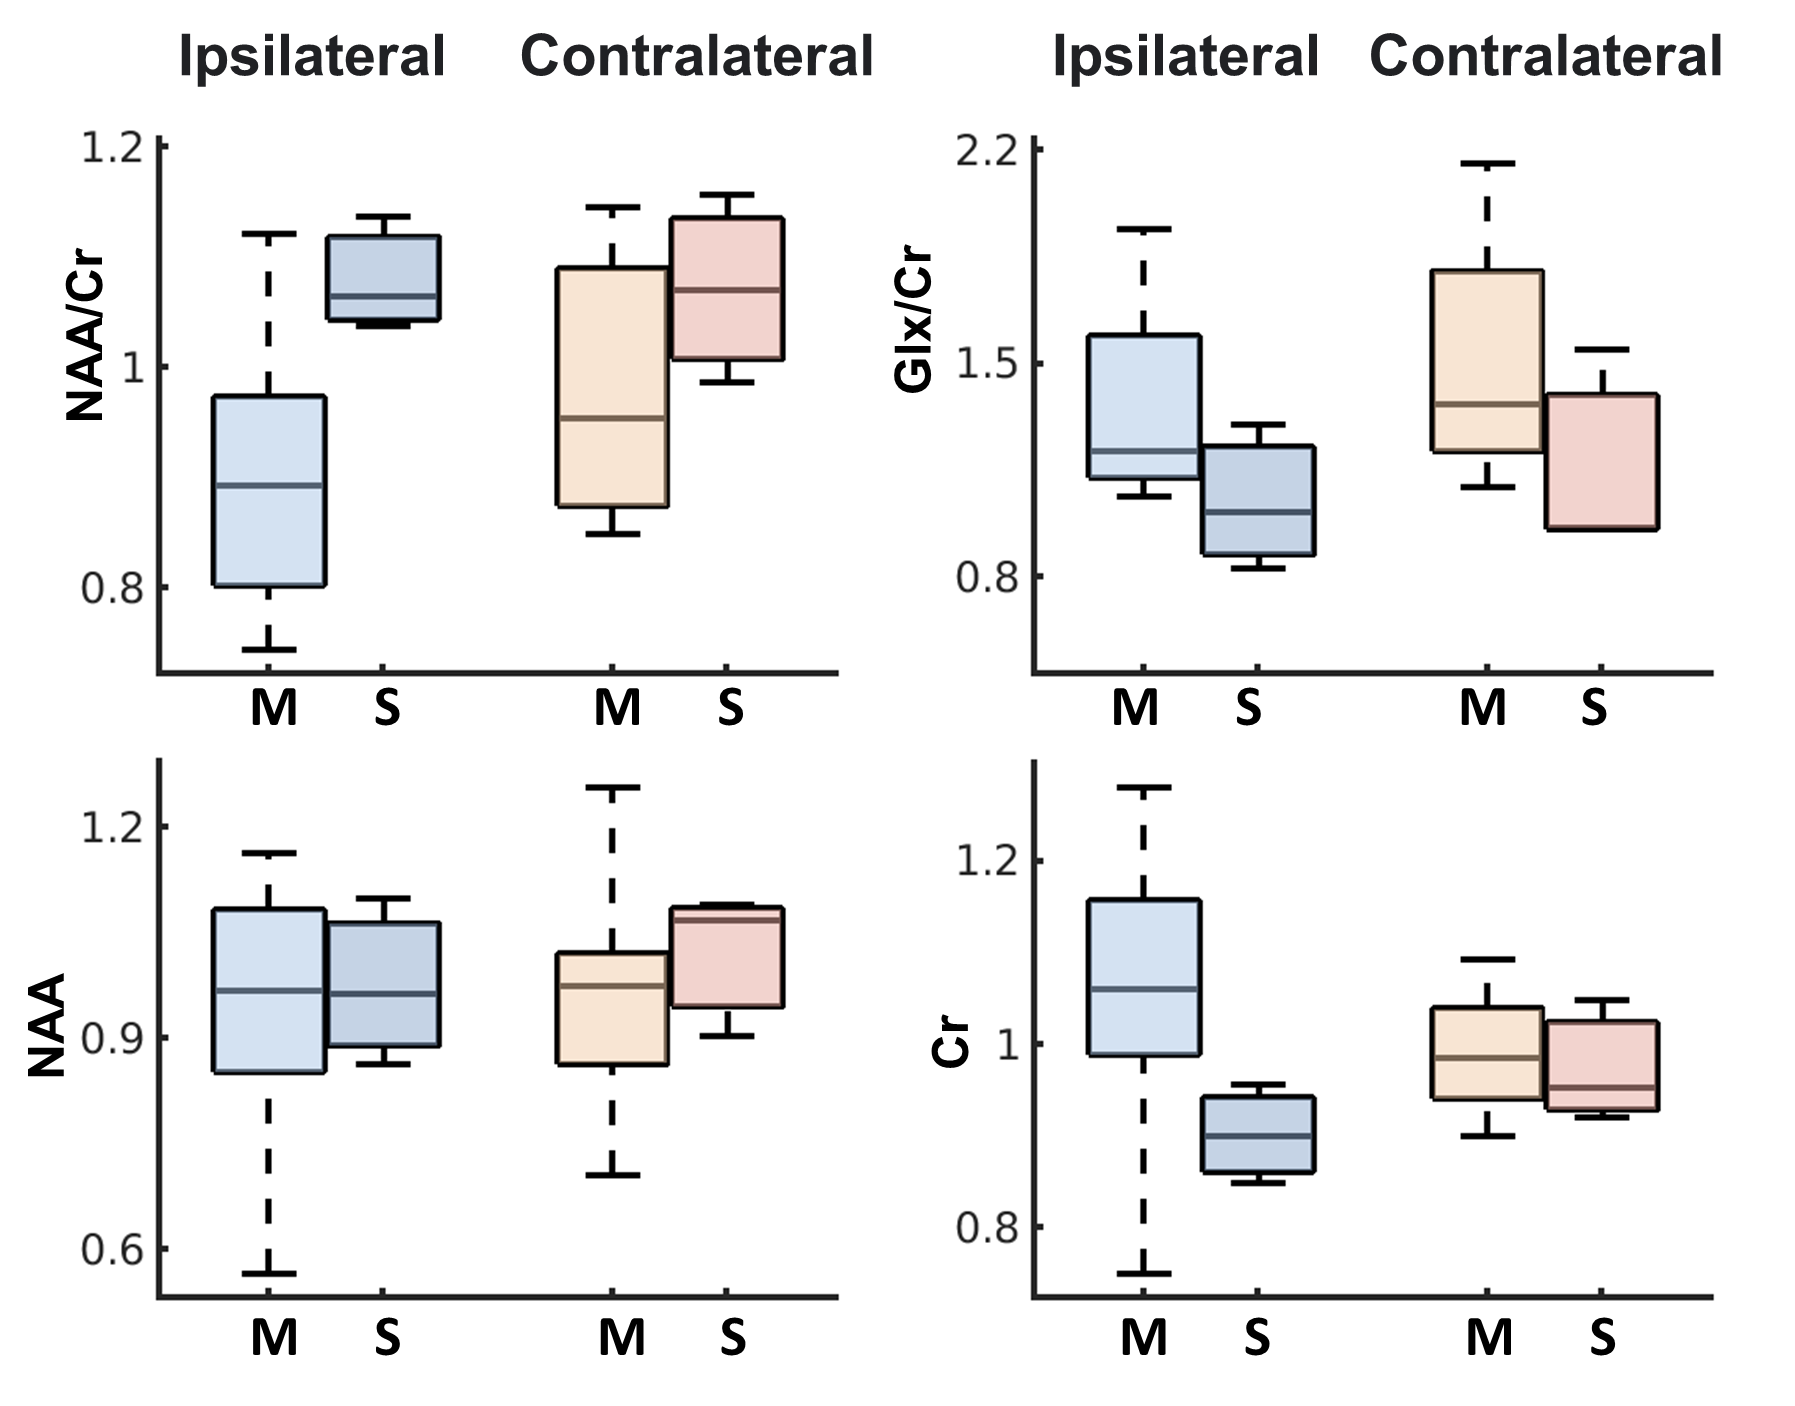
The multimodal and multiplexed molecular imaging capabilities offered by our data are illustrated for a representative patient in Fig. 3. Hippocampus sclerosis was identified by the hyperintensity in the FLAIR image. Metabolic alterations, both in individual metabolite maps and ratios, can be observed in the ipsilateral side (sclerosis/epileptic side), within a large region of interest. Metabolite levels and their ratios in the hippocampus and its anterior and posterior subdivisions were compared between the ipsilateral and contralateral sides across all patients (Fig. 4). Reduced NAA/Cr ratios at the ipsilateral side can be observed, which is consistent with previous findings6-10. Significantly reduced Glx/Cr in the ipsilateral hippocampus was also observed, which was rarely captured in previous studies, indicating neurotransmitter alterations related to epileptic regions. We also further stratify the patients based on severity levels assessed by our collaborating epileptologist (based on EEG findings, clinical MRI, and self-reported and clinical memory deficits). Differential metabolite changes were found in the more severe cases (Fig. 5). These observations need to be further validated after most patients are scanned and analyzed.Conclusion
We demonstrated the feasibility of a multi-TE MRSI method optimized for simultaneous metabolite and neurotransmitter mapping in mTLE patients. Initial results from a small cohort show consistency with prior findings as well as interesting new observations. A more comprehensive analysis will be performed as more patients are recruited and scanned in this ongoing project.Acknowledgements
This work was supported in part by NSF-CBET 1944249 and NIH-NIBIB R21EB029076.References
[1] Semah F et al. Is the underlying cause of epilepsy a major prognostic factor for recurrence? Neurology.1998; 51:1256-62.
[2] Engel Jr J. Mesial temporal lobe epilepsy: what have we learned? The Neuroscientist. 2001 ;7:340-52.
[3] Coan AC et al. Epilepsy as progressive disorders: what is the evidence that can guide our clinical decisions and how can neuroimaging help? Epilepsy & Behavior. 2013; 26:313-21.
[4] Huesmann GR et al. Hippocampal stiffness in mesial temporal lobe epilepsy measured with MR elastography: Preliminary comparison with healthy participants. NeuroImage: Clinical. 2020; 27:102313.
[5] Muhlhofer W et al. MRI‐negative temporal lobe epilepsy—What do we know? Epilepsia. 2017; 58:727-42.
[6] Huang H et al. Simultaneous high-resolution whole-brain MR spectroscopy and [18F] FDG PET for temporal lobe epilepsy. European Journal of Nuclear Medicine and Molecular Imaging. 2023; 12:1-3.
[7] Capizzano AA et al. Multisection proton MR spectroscopy for mesial temporal lobe epilepsy. American Journal of Neuroradiology. 2002; 23:1359-68.
[8] Pan JW et al. Utility of magnetic resonance spectroscopic imaging for human epilepsy. Quantitative Imaging in Medicine and Surgery. 2015; 5:313.
[9] Simister RJ et al. A short‐echo‐time proton magnetic resonance spectroscopic imaging study of temporal lobe epilepsy. Epilepsia. 2002; 43:1021-31.
[10] Simister RJ et al. Proton MR spectroscopy of metabolite concentrations in temporal lobe epilepsy and effect of temporal lobe resection. Epilepsy Research. 2009; 83:168-76.
[11] Wang Z et al. High‐resolution, 3D multi‐TE 1H-MRSI using fast spatiospectral encoding and subspace imaging. Magnetic Resonance in Medicine. 2022; 87:1103-18.
[12] Wang Z et al. Optimized subspace-based J-resolved MRSI for simultaneous metabolite and neurotransmitter mapping. In Proc. of ISMRM, 2021, p. 72.
[13] Xie L et al. Accounting for the confound of meninges in segmenting entorhinal and perirhinal cortices in T1-weighted MRI. MICCAI, 2016. pp. 564-571.
Figures