3223
Advanced relaxation-diffusion MRI improves lesion detection for sMRI-negative epilepsy1Brigham and Women's Hospital, Boston, MA, United States, 2Harvard Medical School, Boston, MA, United States
Synopsis
Keywords: Epilepsy, Epilepsy, relaxometry, diffusion MRI
Motivation: Structural MRI (sMRI) has limited sensitivity to detect lesions in about ⅓ of patients with epilepsy. There is a critical need for more sensitive imaging techniques for epilepsy imaging.
Goal(s): The goal of this pilot study is to develop novel imaging techniques to improve the sensitivity for lesion detection for patients with sMRI-negative epilepsy.
Approach: We acquired relaxation-diffusion MRI (rdMRI) using a fast sequence and examined novel parametric and nonparametric modeling techniques for lesion detection on a sMRI-negative patient.
Results: The proposed rdMRI measures revealed a lesion in a sMRI-negative patient that is not shown using standard single-TE dMRI technique.
Impact: The proposed rdMRI acqistion and modeling techniques can significantly improve lesion detections for patients with sMRI-negative epilepsy. Once validated using larger datasets, the rdMRI techniques can be applied for surgical planning for epilepsy patients without using invasive diagnosis techniques.
Introduction
Structural magnetic resonance imaging (sMRI), including T1w, T2w, and FLAIR, are standard modalities for lesion detection for patients with epilepsy[1]. However, sMRI fails to detect lesions in about ⅓ of patients[2] who have to go through invasive diagnosis for surgical planning. The goal of this abstract is to demonstrate that relaxation-diffusion MRI (rdMRI) is a promising technique to improve noninvasive lesion detection for patients with sMRI-negative epilepsy. The rdMRI technique integrates dMRI with multiple b-values and echo times (TEs) to provide novel multi-dimensional measures to enhance the sensitivity and specificity of microstructural measures. Several advanced multi-compartmental models[3,4] and nonparametric techniques based on joint relaxation diffusion distribution (RDD)[5-8] have been developed to derive advanced imaging measures. In this pilot, we will examine different rdMRI modeling techniques for lesion detection for a patient with sMRI-negative epilepsy.Data acquisition and processing
We acquired rdMRI data from a patient with sMRI-negative epilepsy and a healthy control with institutional review board approval. The patient was scanned using the standard clinical sMRI protocol, which didn’t show any signs of lesions, i.e., sMRI-negative, but the EEG data showed right temporal lobe epilepsy.We applied the time-division multiplexing and simultaneous multi-slicing (TDM-SMS) sequence developed in our work[9] implemented using the Pulseq technique[10] to acquire rdMRI on a Siemens Prisma 3T scanner with the following parameters: voxel size = 2.5x2.5x2.5mm3, matrix size =88x88x60, TR=2200ms, TDM=3, SMS=2, iPAT=3, 6 TEs and scan time ~18 minutes. The first set of TEs=70,95,120 ms were acquired using one TDM sequence with b=1000, 2000, 3000 s/mm2 along 25 non-overlapping gradient directions at each b-value and 3 b=0 volumes. The second TDM set includes TEs=82, 107, 132 ms and b= 500, 1500, 2500 s/mm2 at each TE with the same set of gradient directions and b=0 volumes. A separate b=0 volume was acquired for distortion correction.
FSL Topup and Eddy[11,12] were applied to correct for distortion and head motion. Then Freesurfer[13] was used to parcellate the brain, including the hippocampus.
Analysis
We applied two methods to analyze the rdMRI data, including the multi-TE neurite orientation dispersion and density imaging (MTE-NODDI) technique[4] and the maximum-entropy relaxation diffusion distribution[7]. For comparison, diffusion tensor imaging (DTI)[14] and standard NODDI[15] were applied to the shortest-TE dMRI. The goal of the analysis is to examine the difference between imaging measures of the left and right hippocampus.MTE-NODDI: The standard NODDI technique decomposes single-TE dMRI into signals related to intra- and extra-neurite tissue compartments. It provides the neurite density index (NDI), which was shown in[16] to provide increased sensitivity for lesion detection. By jointly modeling data with different TEs, the MTE-NODDI method further improves NODDI and can provide more accurate relaxation-corrected NDI and the T2 relaxation rate for intra- and extra-neurite compartments not provided by the standard quantitative relaxometry. In this study, we applied an in-house Matlab code to estimate MTE-NODDI parameters.
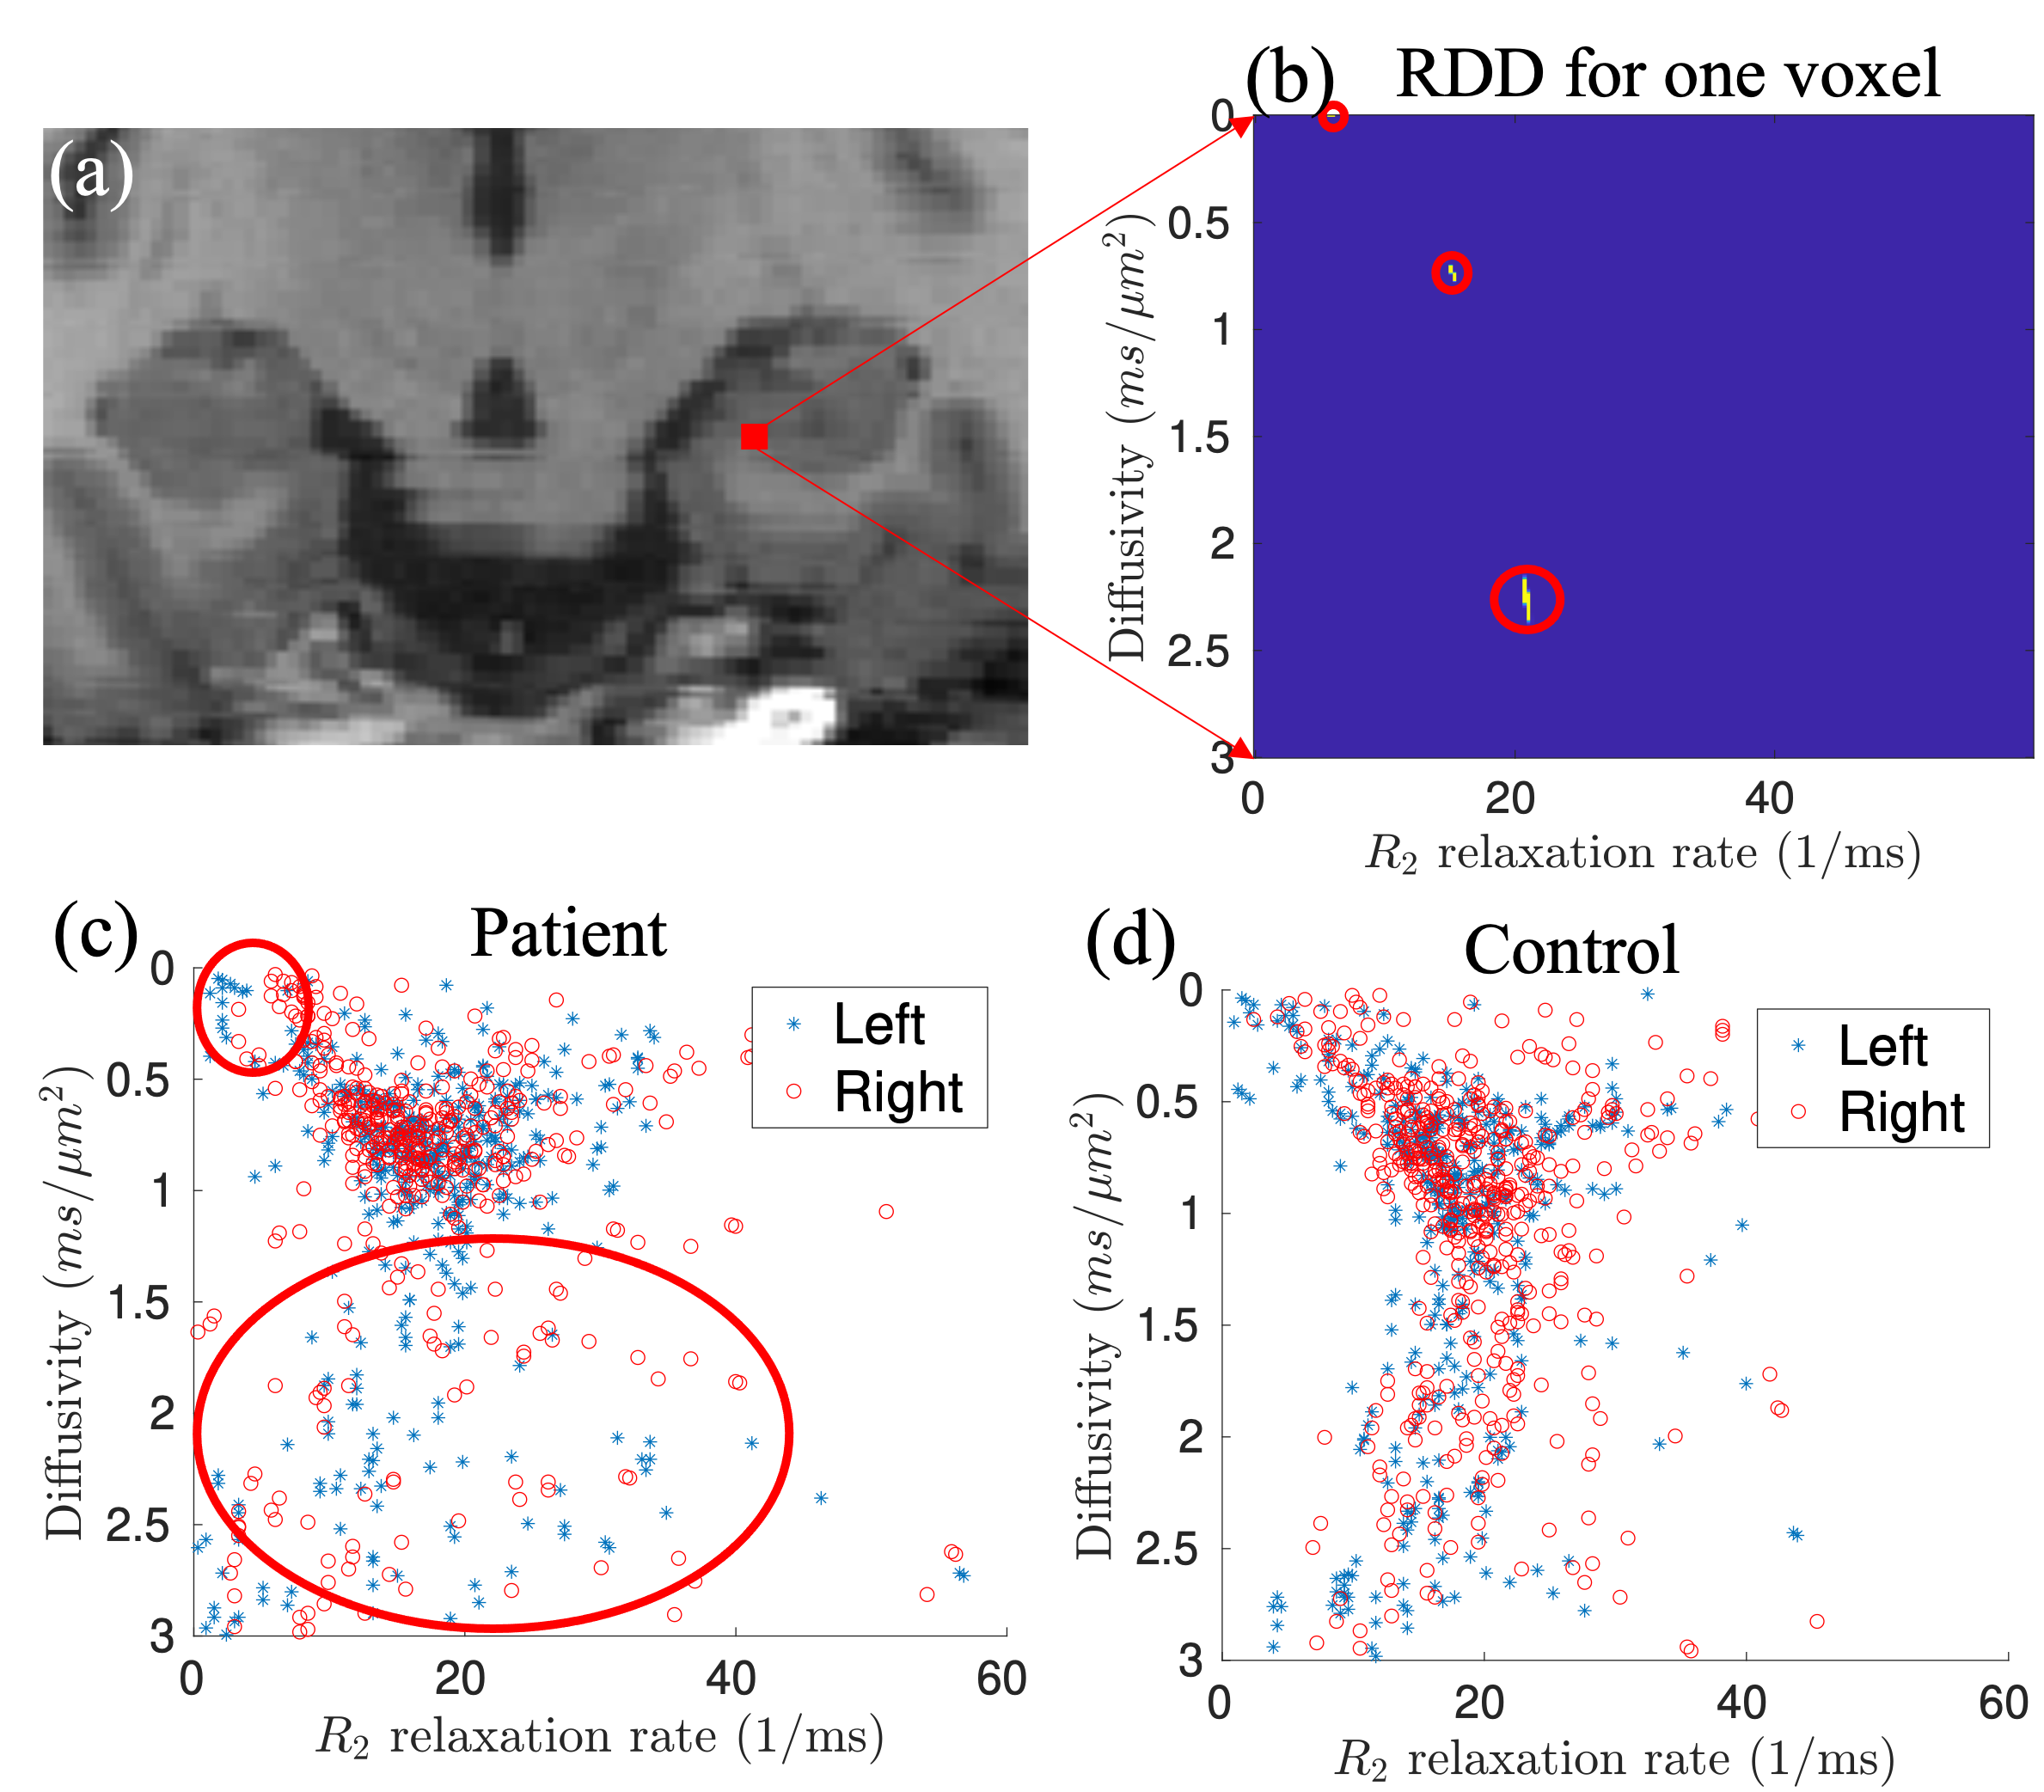
Relaxation diffusion distribution: The relaxation diffusion distribution (RDD) is a technique to transform rdMRI data into multi-dimensional distributions of the relaxation and diffusion coefficients to characterize tissue microstructure. The RDD function can identify compartment-specific T2 and diffusivity without assuming parametric multi-compartment models. In this study, we applied the algorithm developed in our recent work[7] to estimate RDD for each voxel and identified the coordinates for each peak of the distributions.
Results
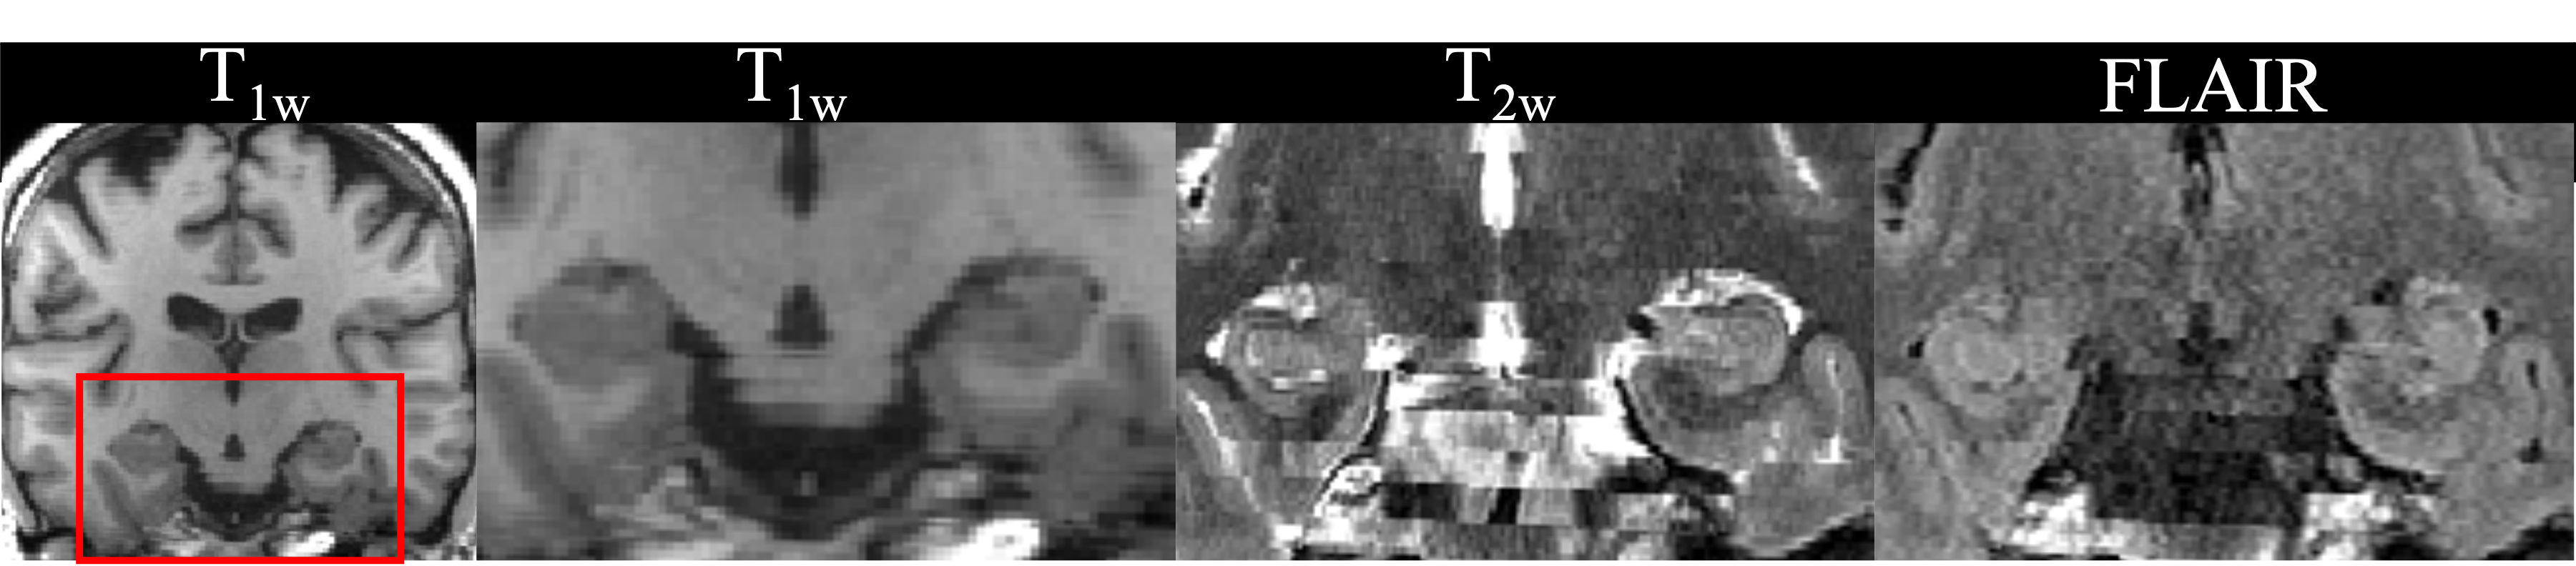
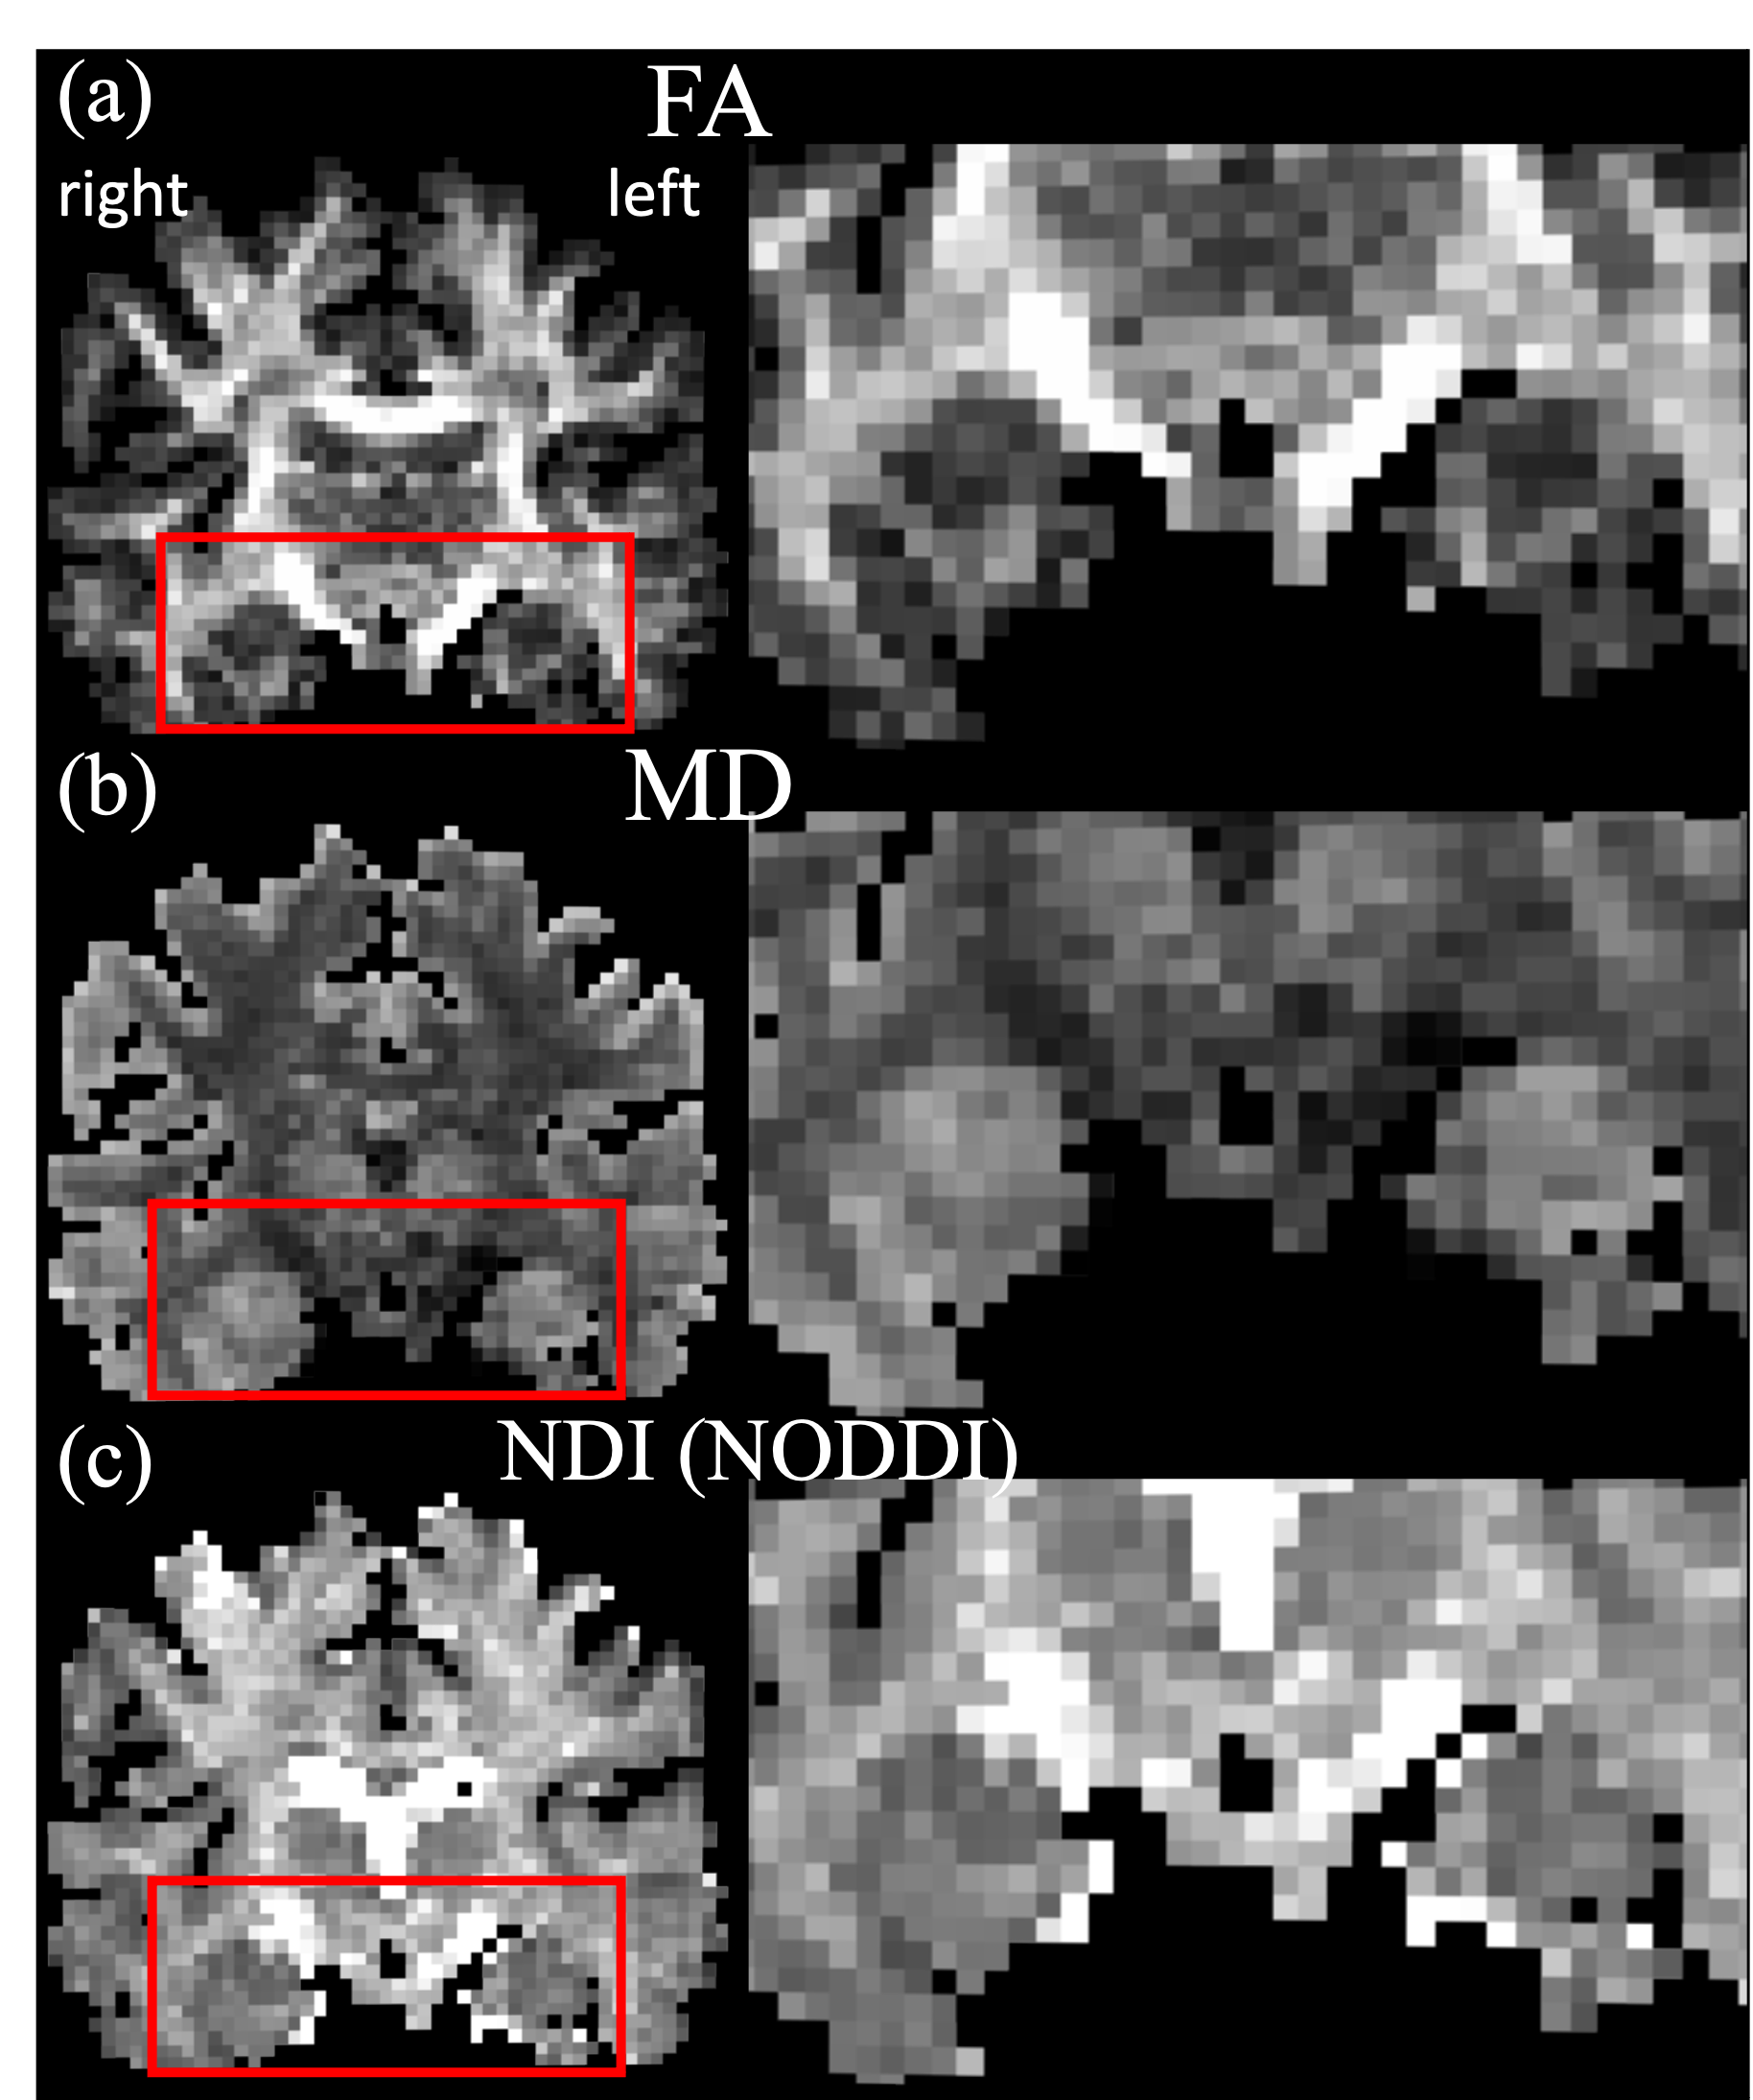
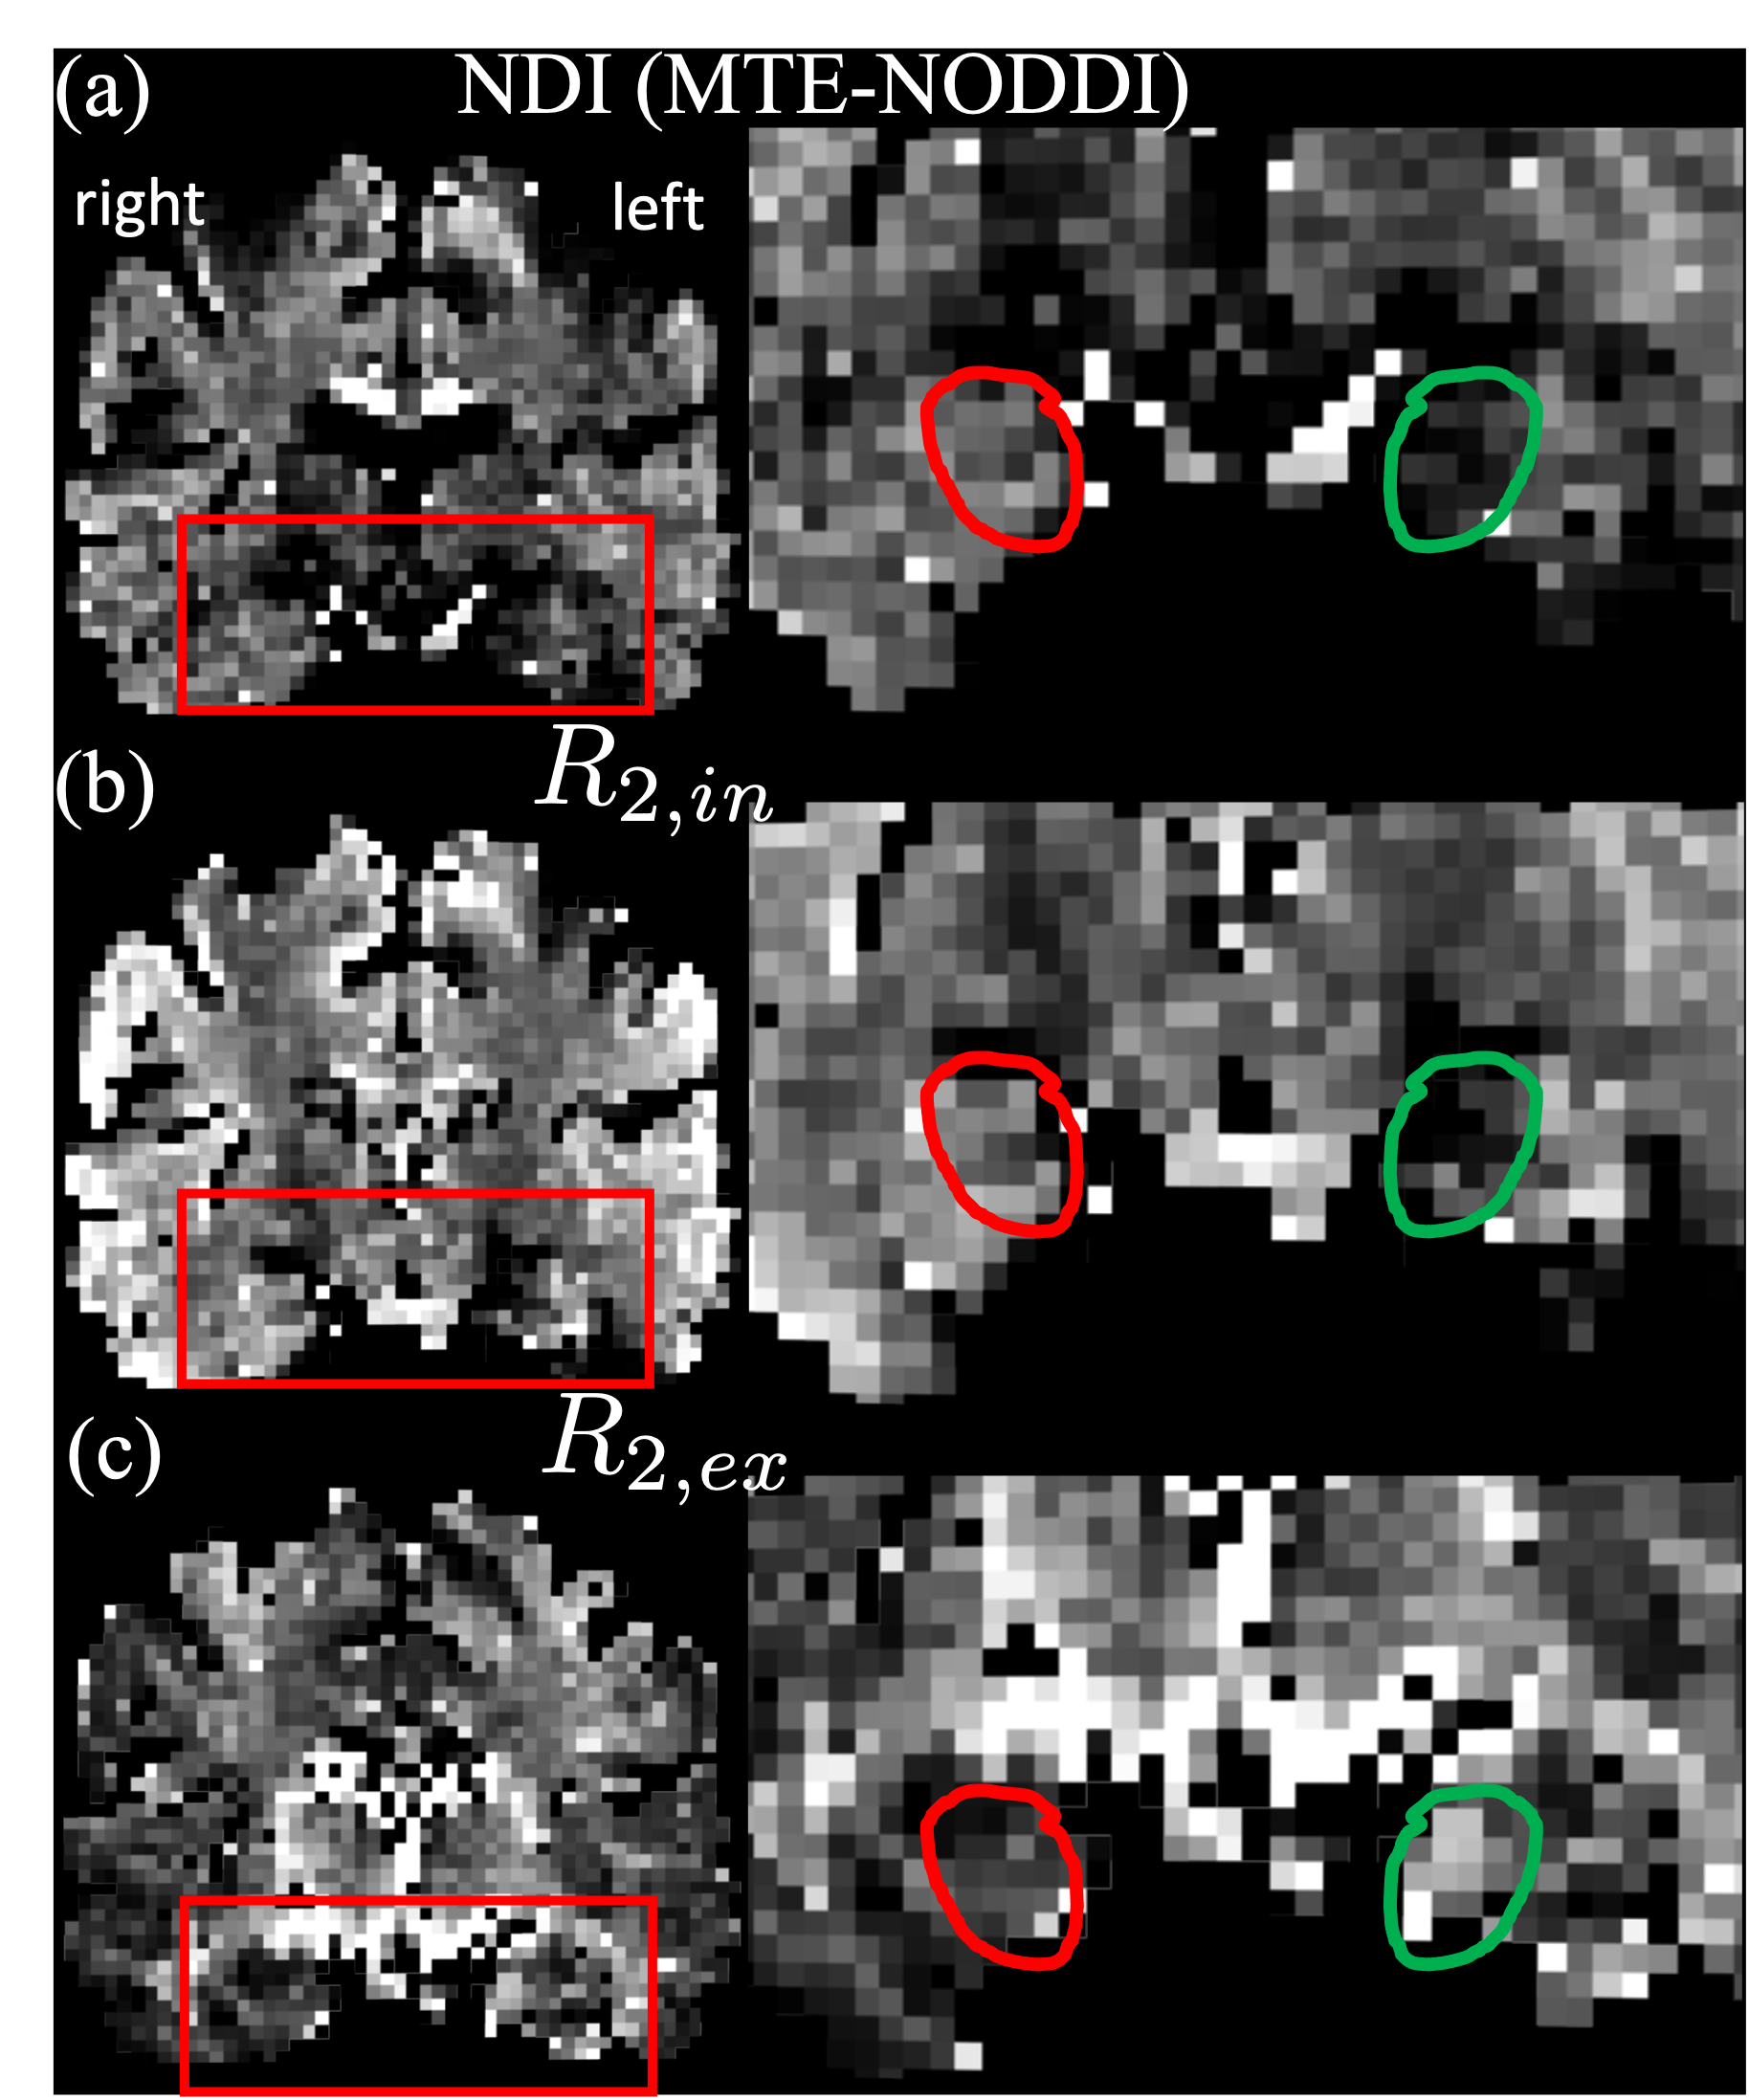
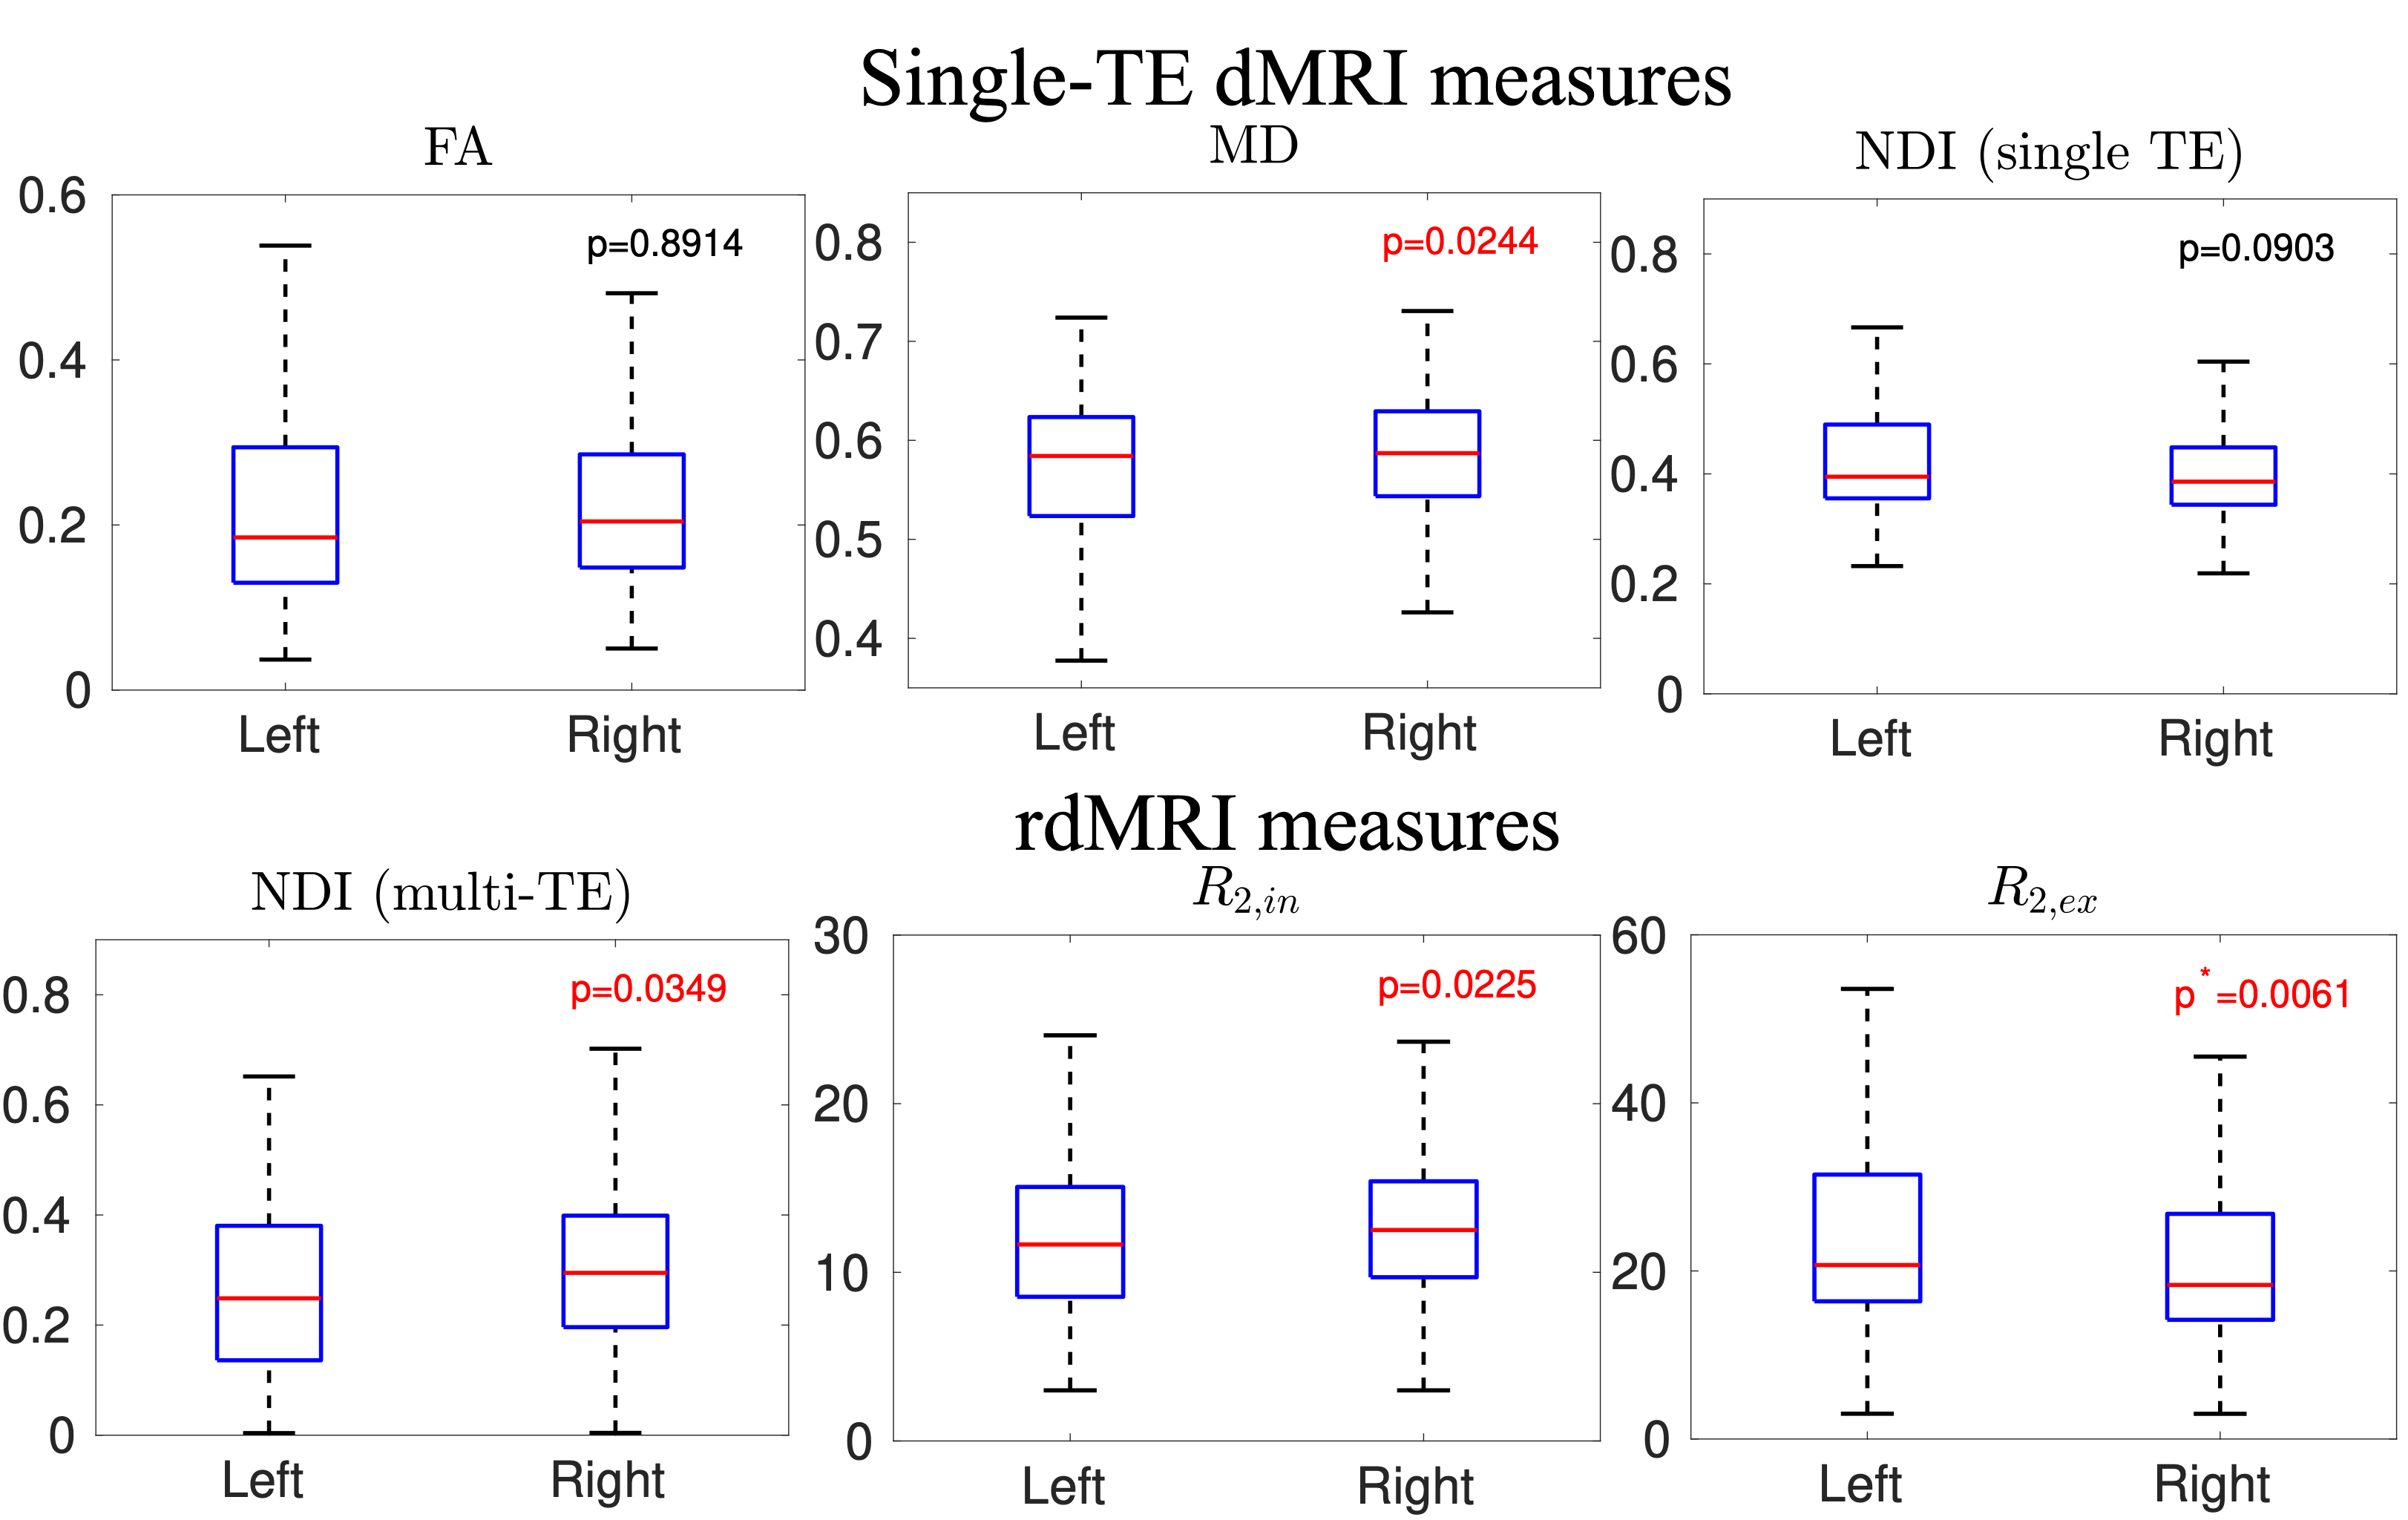
Figure 1 illustrates the sMRI data for the patient, including a coronal slice of T1w, and zoomed views of the T1w, T2w, and FLAIR of the hippocampus region. Figure 2 shows that the standard fractional anisotropy (FA), mean diffusivity (MD), and NDI using single-TE dMRI do not show visible lesions in the hippocampus. Figure 3 illustrates the MTE-NODDI-based NDI and the R2 of intra- and extra-neurite compartments. The circles in the right panel show a visible difference between the right (red) and left (green) hippocampus. Figure 4 shows the comparison results, i.e., T-test, between the imaging measures of the left and right hippocampus. The first row of Figure 5 illustrates the RDD, which shows three components in one voxel. The second row compares the scatter plots of the peak coordinates between the patient and the control. The small red circle shows increased R2 in the right hippocampus of the patient. The large red circle highlights the difference in the distributions between the patient and control. Overall, the MTE-NODDI measures showed increased sensitivity to identify differences between the two regions, and the RDD shows more details to lateralize the abnormal region.Conclusion
Results from this study show that rdMRI is a promising imaging technique to improve non-invasive lesion diagnosis for patients with sMRI-negative epilepsy.Acknowledgements
This study is supported by NIH grants K01MH117346, R01MH116173, R01MH125860, and R01EB032378.References
[1] Bernasconi A, Cendes F, Theodore WH, Gill RS, Koepp MJ, Hogan RE, et al. Recommendations for theuse of structural magnetic resonance imaging in the care of patients with epilepsy: A consensus reportfrom the International League Against Epilepsy Neuroimaging Task Force. Epilepsia. 2019;60: 1054–1068.
[2] Muhlhofer W, Tan Y, Mueller SG, Knowlton R. MRI ‐negative temporal lobe epilepsy—What do we know?Epilepsia. 2017. pp. 727–742. doi:10.1111/epi.13699
[3] Veraart J, Novikov DS, Fieremans E. TE dependent Diffusion Imaging (TEdDI) distinguishes betweencompartmental T relaxation times. Neuroimage. 2018;182: 360–369.
[4] Gong T, Tong Q, He H, Sun Y, Zhong J, Zhang H. MTE-NODDI: Multi-TE NODDI for disentangling non-T2-weighted signal fractions from compartment-specific T2 relaxation times. Neuroimage. 2020;217:116906.
[5] Kim D, Doyle EK, Wisnowski JL, Kim JH, Haldar JP. Diffusion-relaxation correlation spectroscopicimaging: A multidimensional approach for probing microstructure. Magn Reson Med. 2017;78: 2236–2249.
[6] Benjamini D, Priemer DS, Perl DP, Brody DL, Basser PJ. Mapping astrogliosis in the individual humanbrain using multidimensional MRI. Brain. 2023;146: 1212–1226.
[7] Ning L. Maximum-entropy estimation of joint relaxation-diffusion distribution using multi-TE diffusion MRI.The 26th International Conference on Medical Image Computing and Computer Assisted Intervention(MICCAI). 2023.
[8] Ning L, Gagoski B, Szczepankiewicz F, Westin C-F, Rathi Y. Joint RElaxation-Diffusion Imaging Momentsto Probe Neurite Microstructure. IEEE Trans Med Imaging. 2020;39: 668–677.
[9] Ji Y, Hoge WS, Gagoski B, Westin C-F, Rathi Y, Ning L. Accelerating joint relaxation-diffusion MRI byintegrating time division multiplexing and simultaneous multi-slice (TDM-SMS) strategies. Magn ResonMed. 2022;87: 2697–2709.
[10] Layton KJ, Kroboth S, Jia F, Littin S, Yu H, Leupold J, et al. Pulseq: A rapid and hardware-independentpulse sequence prototyping framework. Magn Reson Med. 2017;77: 1544–1552. doi:10.1002/mrm.26235
[11] Andersson J.L.R., Skare S., Ashburner J. How to correct susceptibility distortions in spin-echo echo-planar images: application to diffusion tensor imaging. NeuroImage, 20(2):870-888, 2003.
[12] Jesper L. R. Andersson and Stamatios N. Sotiropoulos. An integrated approach to correction for off-resonance effects and subject movement in diffusion MR imaging. NeuroImage, 125:1063-1078, 2016.[13] Fischl B. FreeSurfer. Neuroimage. 2012 Aug 15;62(2):774-81. doi: 10.1016/j.neuroimage.2012.01.021. Epub 2012 Jan 10. PMID: 22248573; PMCID: PMC3685476.
[14] Basser PJ, Mattiello J,LeBihan D, MR diffusion tensor spectroscopy and imaging, Biophys J 1994 Jan;66(1):259-67.
[15] Zhang H, Schneider T, Wheeler-Kingshott CA, Alexander DC. NODDI: practical in vivo neurite orientationdispersion and density imaging of the human brain. Neuroimage. 2012;61: 1000–1016.
[16] Winston GP, Micallef C, Symms MR, Alexander DC, Duncan JS, Zhang H. Advanced diffusion imagingsequences could aid assessing patients with focal cortical dysplasia and epilepsy. Epilepsy Res.2014;108: 336–339.
Figures