3221
Single-patient analysis of quantitative T1 values at 7T reveals global abnormalities in epilepsy1Advanced Clinical Imaging Technology, Siemens Healthineers International AG, Lausanne, Switzerland, 2CIBM Center for Biomedical Imaging, Geneva, Switzerland, 3Department of Radiology, Lausanne University Hospital and University of Lausanne, Lausanne, Switzerland, 4LTS5, École Polytechnique Fédérale de Lausanne (EPFL), Lausanne, Switzerland, 5Advanced Clinical Imaging Technology, Siemens Healthineers International AG, Bern, Switzerland, 6Translational Imaging Center (TIC), Swiss Institute for Translational and Entrepreneurial Medicine, Bern, Switzerland, 7Magnetic Resonance Methodology, Institute of Diagnostic and Interventional Neuroradiology, University of Bern, Bern, Switzerland, 8Department of Neurology, University Hospital Bern, Inselspital, University of Bern, Bern, Switzerland, 9EEG and Epilepsy Unit, Department of Clinical Neurosciences, Geneva University Hospitals and Faculty of Medicine, Geneva, Switzerland, 10Support Center for Advanced Neuroimaging, Institute for Diagnostic and Interventional Neuroradiology, Inselspital, University of Bern, Bern, Switzerland
Synopsis
Keywords: Epilepsy, Quantitative Imaging, ultra-high field, 7T MRI
Motivation: While widespread structural changes in epilepsy have been previously reported, the global secondary effects on the brain are yet to be fully understood.
Goal(s): To investigate the presence of global abnormalities in quantitative T1 values in drug-resistant epilepsy at a single-patient level.
Approach: Seventy-eight epilepsy patients were studied using 7T MRI, and a previously established quantitative T1 brain atlas of healthy subjects was used to calculate T1 deviations in patients.
Results: Frontal and temporal gray matter exhibited the largest T1 alterations, with significant correlations observed between T1 deviations and the patients’ disease duration. These findings suggest widespread microstructural disruptions in epilepsy patients.
Impact: The observed quantitative T1 changes reveal widespread microstructural disturbances in epilepsy patients that extend beyond the seizure onset zone. The proposed method may allow early diagnosis of previously undetectable microstructural abnormalities along brain areas involved into seizure formation and propagation.
Introduction
There has long been interest in the global secondary effects of epilepsy on the brain. In an attempt to comprehend the outcomes of epilepsy, cohort-level research has demonstrated that epilepsy is characterized by brain alterations that extend beyond the epileptic focus1,2. In large multi-centric studies coordinated by the ENIGMA-consortium3, for instance, MRI-based analyses of brain morphology4,5 and diffusion tensor imaging6 have revealed widespread structural changes in epilepsy. Such disruptions have been postulated to be the result of degenerative processes occurring over the course of the disease, including demyelination and axonal loss, leading to progressive functional decline6. However, it remains unclear whether such changes are reflecting the primary process of epileptogenesis.On this basis, our study explores whether quantitative T1 maps provide insights into global brain microstructure abnormalities on a single-patient level in epilepsy. To that end, previously established atlases of reference T1 values10 were used to compute T1 deviations in patients’ brain tissues. Additionally, the correlation of T1 changes with the patient’s disease duration was investigated in an exploratory analysis.
Methods
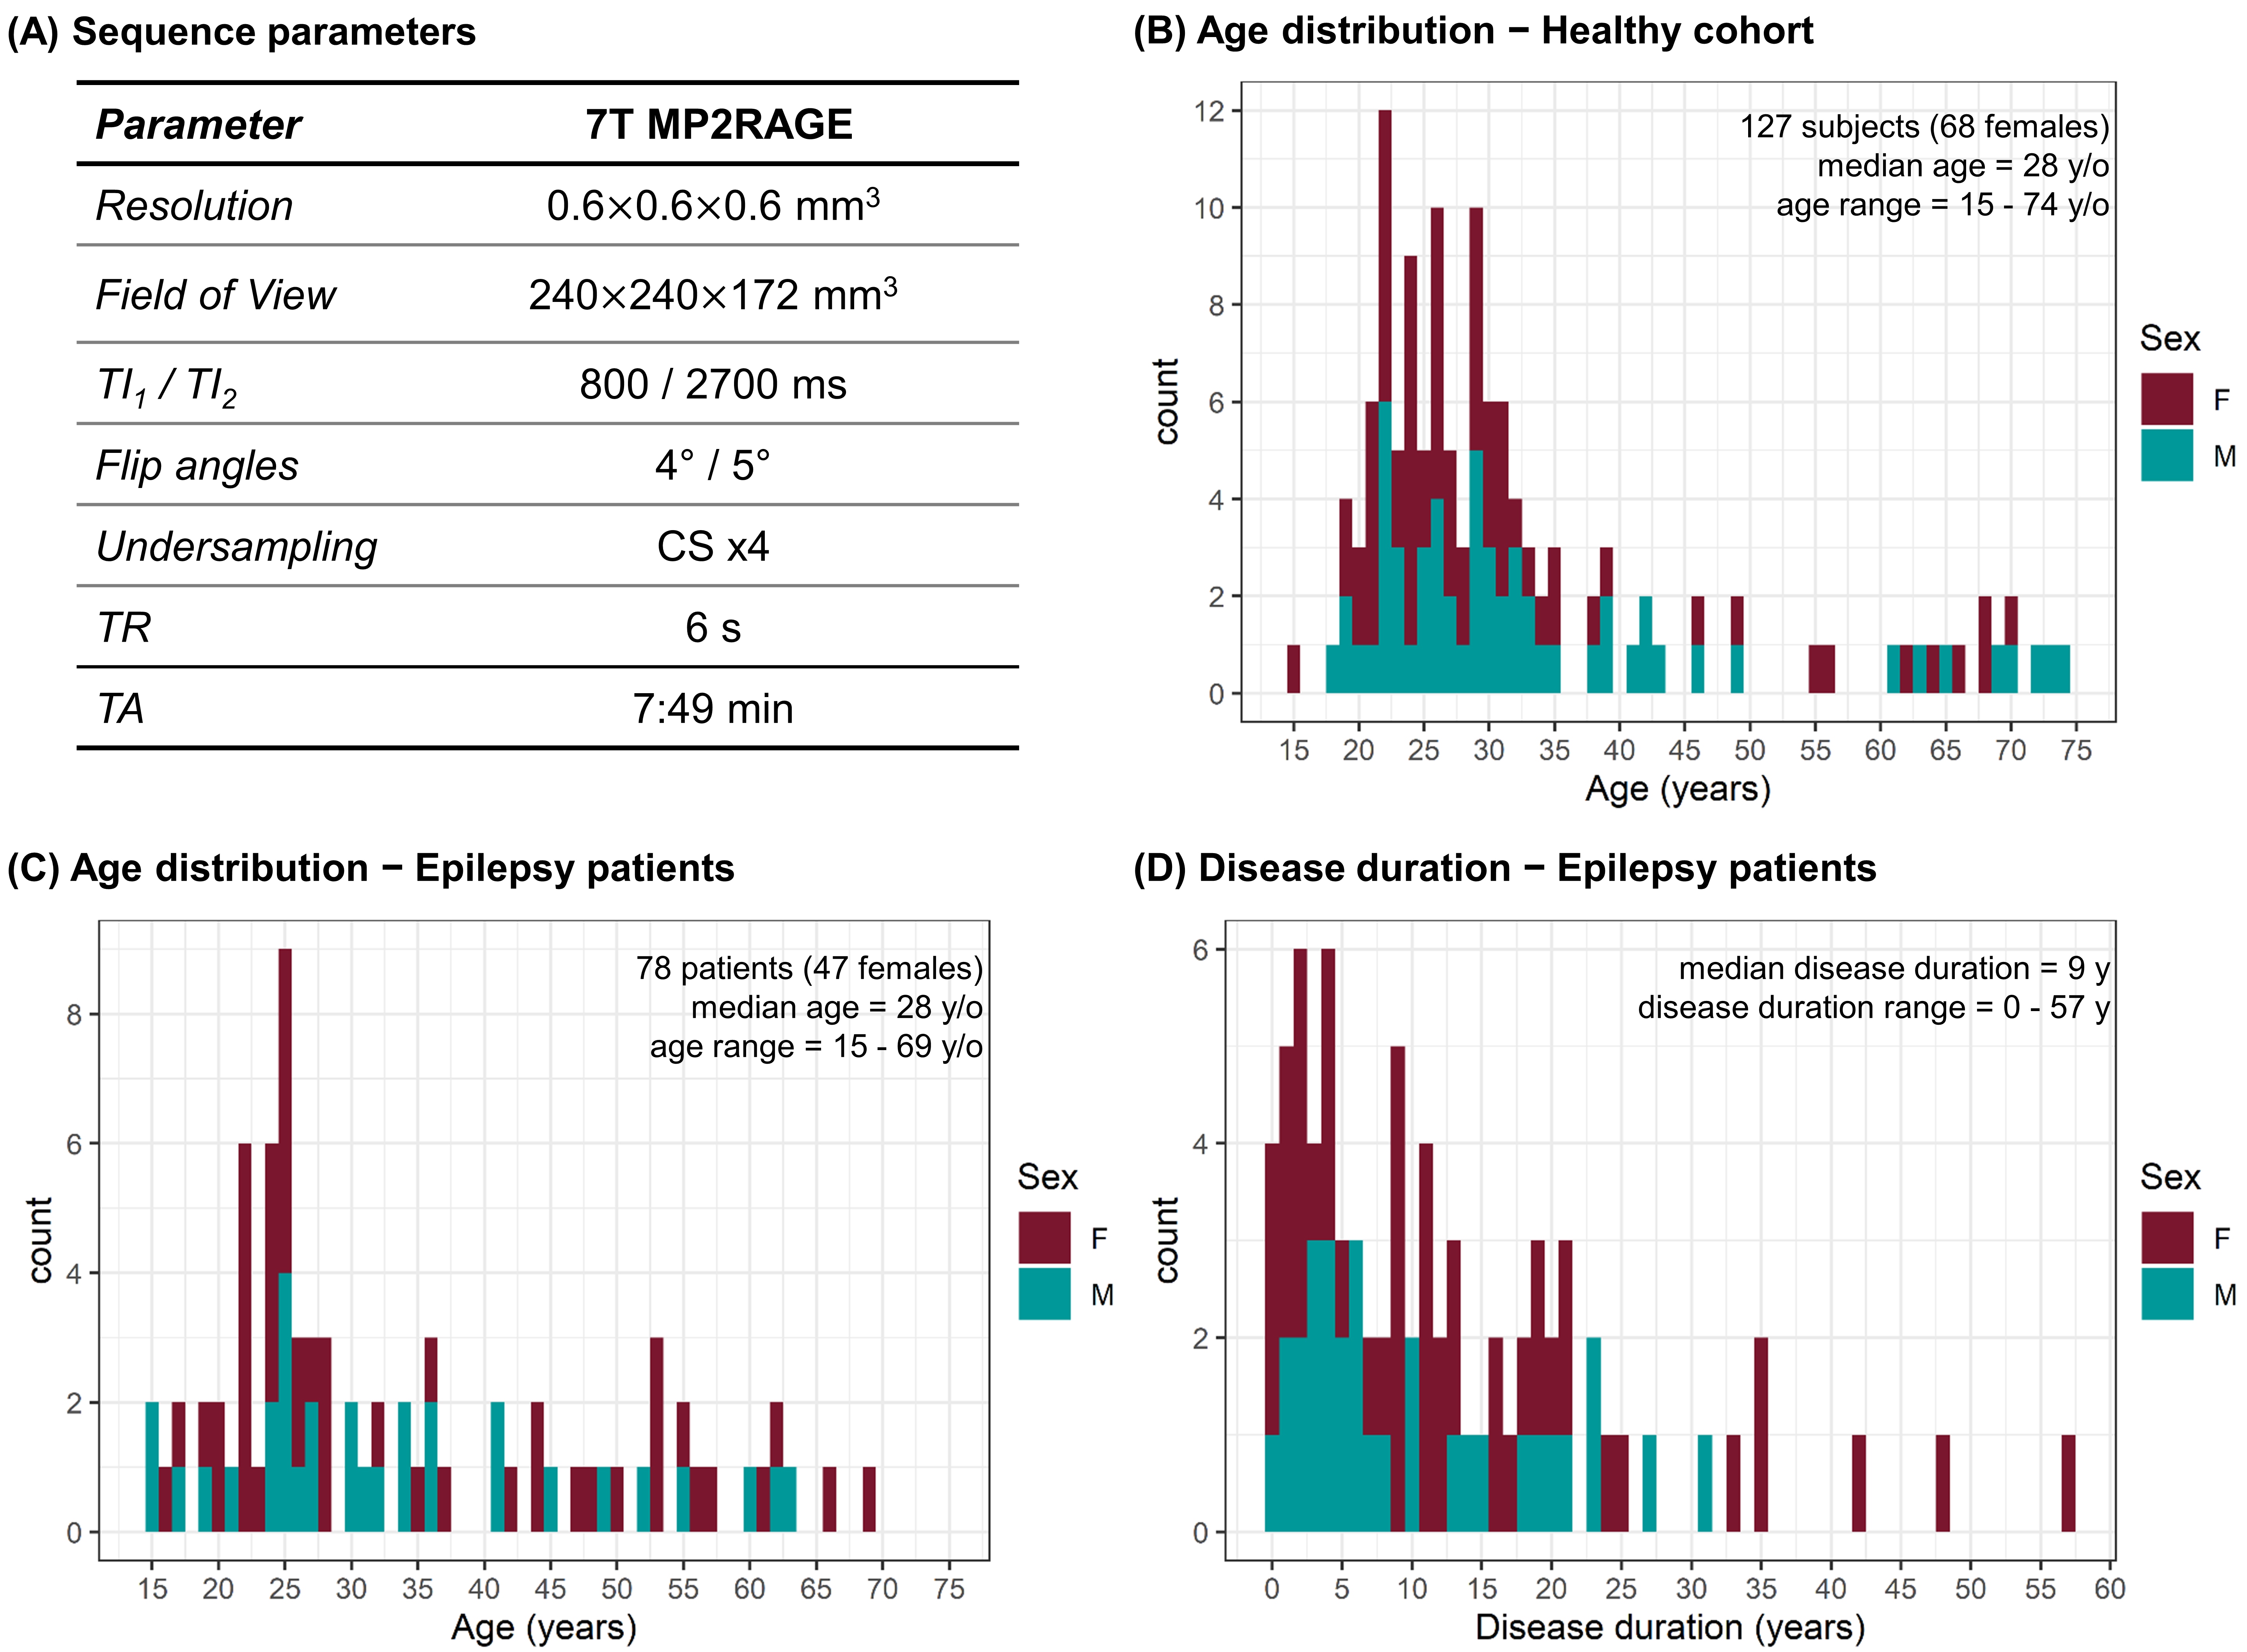
Study population and MR protocolA cohort of 78 patients (47 females, median age = 28 y/o, range = [15-69] y/o, median disease duration = 9 y, range = [0-57] y) with drug-resistant epilepsy and ambiguous findings at 3T underwent 7T MRI (MAGNETOM Terra, Siemens Healthcare, Erlangen, Germany) using a 1-channel Tx/32-channel Rx head coil (Nova Medical, Wilmington, MA). For the computation of the reference atlas, 127 healthy subjects (68 females, median age = 28 y/o, range = [15-74] y/o) were previously acquired10. T1-weighted images and T1 maps were obtained using an MP2RAGE research application sequence7,8. Sequence parameters, as well as detailed patients’ demographics, are reported in Figure 1.
Image processing
Total intracranial volume and masks of 48 brain structures were segmented in each dataset using the MorphoBox research application adapted for 7T MP2RAGE T1-weighted uniform images (“UNI”)9,10.
Following previously reported methodologies10,11, whole brain atlases of reference T1 values at 7T were established from the healthy cohort by modelling the T1 inter-subject variability accounting for sex differences and a quadratic evolution with age12:
$$E\{T_1\}=\beta_0+\beta_{sex}*sex+\beta_{age}*age+\beta_{age^2}*age^2\,\,.$$T1 deviations from the expected reference values were assessed voxel-wise in patients by means of z-scores. To assess the sensitivity of the method to detect tissue alterations, T1 z-scores were additionally calculated in the healthy cohort within a 10-fold cross-validation, iteratively establishing a T1 atlas with 90% of the healthy subjects and computing z-scores in the remaining 10% of the healthy T1 maps13.
For each segmented brain region, average T1 z-scores, standard deviation of T1 z-scores, and the percentage of voxels within the region with |z-scores|>2 were extracted. Spearman's correlation coefficients were computed between extracted T1 z-score metrics and patients’ disease duration.
Results
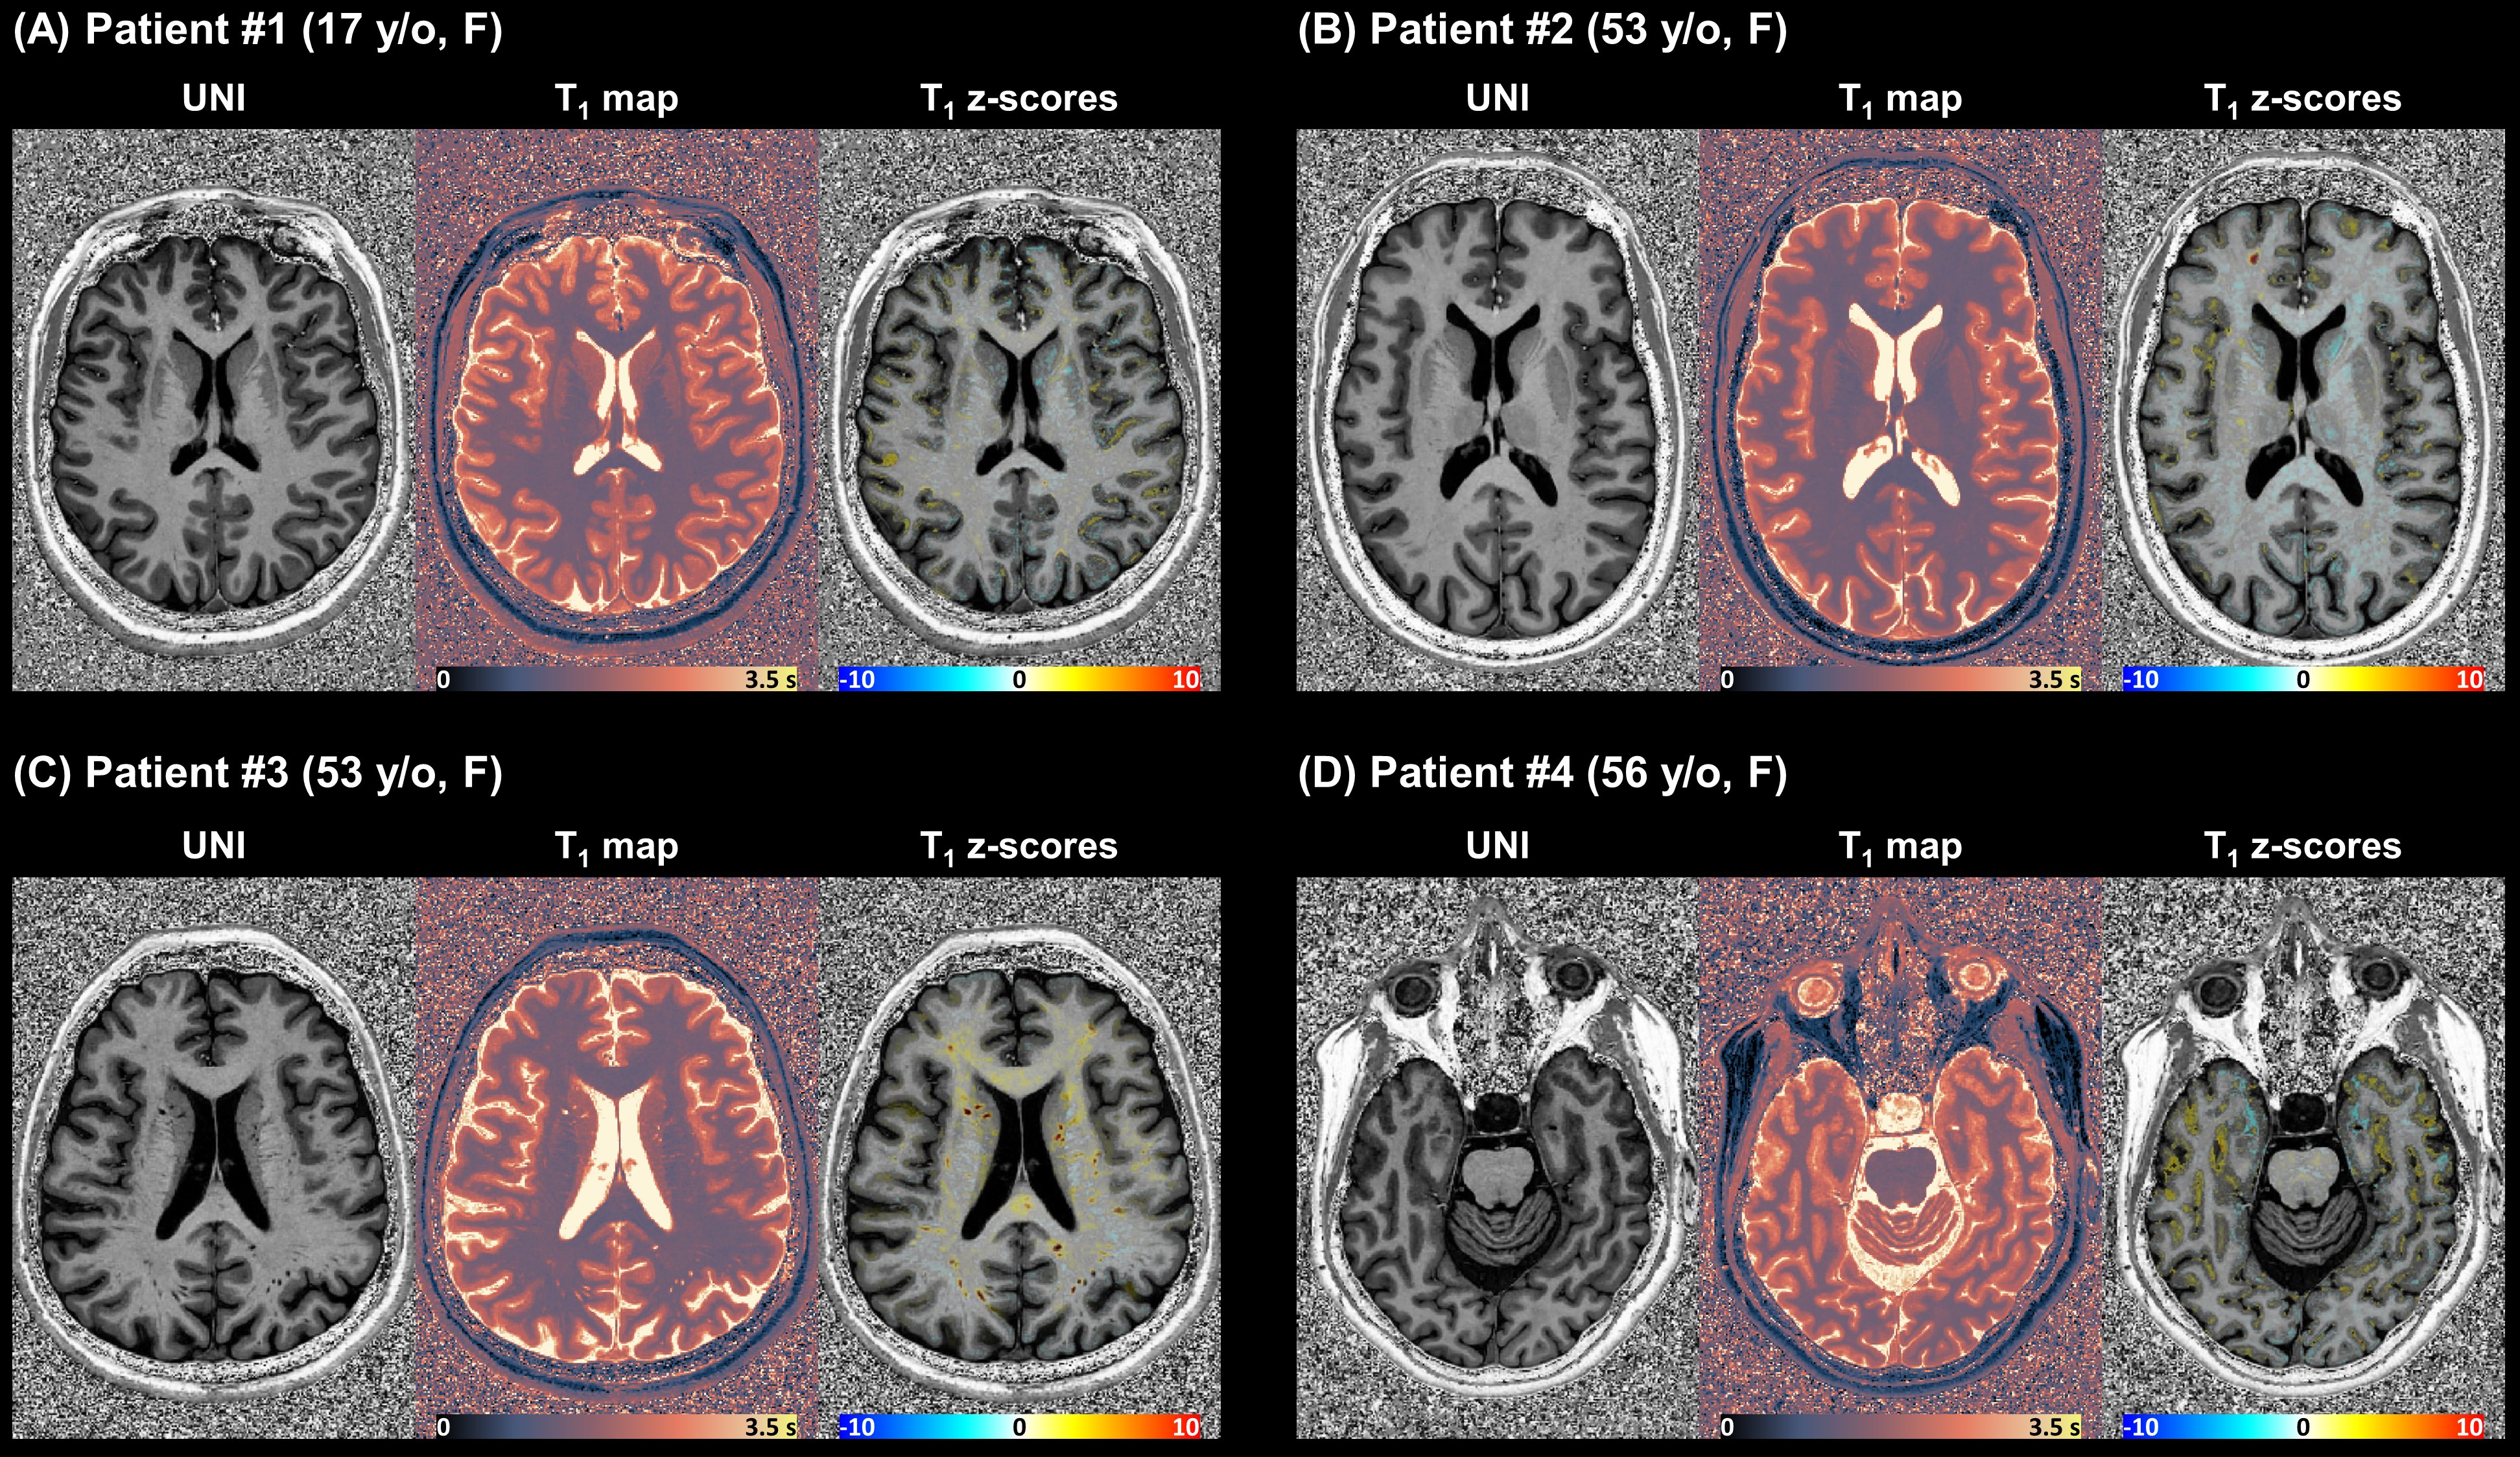

Representative anatomical images and corresponding whole brain T1 z-score maps are shown in Figure 2 for four example patients.Average T1 z-score, standard deviation of T1 z-scores and percentage of voxels with |z-scores|>2 in cortical gray matter (GM) and white matter (WM) regions are reported in waterfall plots including each individual epilepsy patient in Figure 3. From the waterfall plots, a general alteration of T1 values in the GM can be observed on a patient-level. In particular, the percentage of voxels with |z-scores|>2 was greater than the healthy cohort median for 72/78 (92%) of the enrolled patients (Figure 3E). The same trend occurred, instead, only to 10/78 patients (13%) in the WM (Figure 3F).


Among the different lobes of the cortical GM, the frontal and temporal lobe exhibit the largest T1 alterations (Figure 4). In these regions, significant correlations were observed between the extracted T1 z-score metrics and patients’ disease duration (Figure 5). The strongest correlations were found for the standard deviation of T1 z-scores in the frontal lobe (ρ = 0.44, p<0.001) and the average T1 z-score in the temporal lobe (ρ = 0.41, p<0.001).
Discussion and Conclusion
Alterations of T1 values were assessed in a cohort of epilepsy patients scanned at 7T, suggesting widespread microstructural disruptions of brain tissues beyond the seizure onset zone, particularly in GM tissues. Additionally, correlations between T1 z-score metrics and patients' disease duration were observed. The proposed method may thus allow early diagnosis of previously undetectable microstructural abnormalities along brain areas involved into seizure formation and propagation. Future work should focus on validating these results in larger patient cohorts while looking into additional relevant features of epilepsy such as type of seizures, their frequency, or response to treatment.Acknowledgements
No acknowledgement found.References
1. Bernhardt BC, Bonilha L, Gross DW. Network analysis for a network disorder: The emerging role of graph theory in the study of epilepsy. Epilepsy & Behavior. 2015;50:162-170. doi:10.1016/j.yebeh.2015.06.005
2. Vaughan DN, Rayner G, Tailby C, Jackson GD. MRI-negative temporal lobe epilepsy. Neurology. 2016;87(18):1934. doi:10.1212/WNL.0000000000003289
3. Bearden CE, Thompson PM. Emerging Global Initiatives in Neurogenetics: The Enhancing Neuroimaging Genetics through Meta-analysis (ENIGMA) Consortium. Neuron. 2017;94(2):232-236. doi:10.1016/j.neuron.2017.03.033
4. Whelan CD, Altmann A, Botía JA, et al. Structural brain abnormalities in the common epilepsies assessed in a worldwide ENIGMA study. Brain. 2018;141(2):391-408. doi:10.1093/brain/awx341
5. Larivière S, Royer J, Rodríguez-Cruces R, et al. Structural network alterations in focal and generalized epilepsy assessed in a worldwide ENIGMA study follow axes of epilepsy risk gene expression. Nat Commun. 2022;13(1). doi:10.1038/s41467-022-31730-5
6. Hatton SN, Huynh KH, Bonilha L, et al. White matter abnormalities across different epilepsy syndromes in adults: An ENIGMA-Epilepsy study. Brain. 2020;143(8):2454-2473. doi:10.1093/brain/awaa200
7. Marques JP, Kober T, Krueger G, van der Zwaag W, Van de Moortele PF, Gruetter R. MP2RAGE, a self bias-field corrected sequence for improved segmentation and T1-mapping at high field. Neuroimage. 2010;49(2):1271-1281. doi:10.1016/j.neuroimage.2009.10.002
8. Mussard E, Hilbert T, Forman C, Meuli R, Thiran J, Kober T. Accelerated MP2RAGE imaging using Cartesian phyllotaxis readout and compressed sensing reconstruction. Magn Reson Med. 2020;84(4):1881-1894. doi:10.1002/mrm.28244
9. Schmitter D, Roche A, Maréchal B, et al. An evaluation of volume-based morphometry for prediction of mild cognitive impairment and Alzheimer’s disease. Neuroimage Clin. 2015;7:7-17. doi:10.1016/j.nicl.2014.11.001
10. Piredda GF, Caneschi S, Hilbert T, et al. Submillimeter T1 atlas for subject‐specific abnormality detection at 7T. Magn Reson Med. 2023;89(4):1601-1616. doi:10.1002/mrm.29540
11. Caneschi S, Hilbert T, Bonanno G, et al. A normative cortical T1 atlas for single-subject pathology detection at 7T. In: Proceedings of the International Society of Magnetic Resonance in Medicine, Toronto, Canada. 2023. Abstract: 0274.
12. Hagiwara A, Fujimoto K, Kamagata K, et al. Age-Related Changes in Relaxation Times, Proton Density, Myelin, and Tissue Volumes in Adult Brain Analyzed by 2-Dimensional Quantitative Synthetic Magnetic Resonance Imaging. Invest Radiol. 2021;56(3):163-172. doi:10.1097/RLI.0000000000000720
13. Piredda GF, Hilbert T, Granziera C, et al. Quantitative brain relaxation atlases for personalized detection and characterization of brain pathology. Magn Reson Med. 2020;83(1):337-351. doi:10.1002/mrm.27927
Figures