3220
Mapping Cortical Fiber Orientations in Human Focal Cortical Dysplasias Using High-Resolution Diffusion MRI1Department of Radiology, Stanford University, Stanford, CA, United States, 2Athinoula A. Martinos Center for Biomedical Imaging, Massachusetts General Hospital, Charlestown, MA, United States, 3Department of Neurology and Neurological Sciences, Stanford University School of Medicine, Stanford, CA, United States, 4Departments of Neurosurgery, Stanford University School of Medicine, Stanford, CA, United States, 5Department of Electrical Engineering, Stanford University, Stanford, CA, United States
Synopsis
Keywords: Epilepsy, Diffusion Tensor Imaging
Motivation: Detecting focal cortical dysplasia (FCD) is critical for effective neurosurgical intervention but remains technically challenging. Recent MRI technical advancements may provide new opportunities for FCD detection.
Goal(s): To determine the potential of high-resolution DTI to map cortical fiber orientation changes in FCD.
Approach: High-resolution (1 mm isotropic) DTI data were acquired on six epilepsy patients with suspected FCD. A surface-based analysis workflow was built to assess the principal fiber orientations against the cortical surface. Results in FCD were compared to the contralateral homologous region.
Results: All patients show differences in cortical fiber orientations between FCD and the contralateral presumed normal cortex.
Impact: Our study documents that high-resolution diffusion MRI can detect cortical fiber orientation changes in human FCD in vivo, which can be a novel surrogate maker for FCD detection.
Purpose
Focal cortical dysplasia (FCD) is a developmental abnormality of the cortical cytoarchitecture, which is a common cause of drug-resistant epilepsy. While detection of FCD is imperative for neurosurgical intervention, it remains technically challenging and certain types of FCDs can be difficult to visualize with conventional medical imaging1,2. High-resolution (≤1mm isotropic), low-distortion diffusion MRI can detect consistent and predominantly radial cortical fiber orientations, in healthy human subjects in vivo 3, providing new opportunities to map cortical microstructure. A recent preclinical study demonstrated the ability to detect microstructural abnormalities in an animal model of FCD with advanced diffusion MRI4. In this study, we utilize high-resolution diffusion MRI to map cortical fiber orientation changes in patients with evident FCDs on conventional imaging as a first step toward improved detection.Methods
Data Acquisition.We recruited six epilepsy patients with suspected FCD visible on pre-existing clinical T2w-FLAIR scans. After providing written informed consent, patients were scanned on a GE 3.0T Premier MRI scanner, using a 48-channel head coil. Sequence included (1) 1 mm isotropic 6-echo T1w-MPRAGE; (2) 1 mm isotropic T2w-FLAIR; and (3) 1 mm isotropic DTI. The MPRAGE and FLAIR scans covered the whole brain, while the DTI scan covered a portion of the brain centered around the FCD. The DTI scans were conducted with either an optimized 2D single-shot EPI 5 (ss-EPI, for 3 patients) or a gSLIDER 6,7 sequence (for 3 patients). For ss-EPI, TE/TR=59.5 ms / 3.6 s, RPE/PF =3/0.73, 36 slices, b=1 ms/𝜇m2 in 800~900 directions with one b=0 volume each 20 diffusion volumes. For gSLIDER, TE/TR=60.0 ms / 3.6 s, RPE/PF =3/0.66, 60 slices with gSLIDER=5. Note that for gSLIDER, as a volume required 5 TRs (to achieve higher SNR per volume), the total number of b=0 (6~9) and diffusion volumes (112~180) was ~1/5 of that of ss-EPI, to keep a similar total scan time (~1 hour). No multiband (MB) acceleration was used for either DTI scan for SNR considerations. Extra b=0 data with reversed phase encoding polarity were acquired for distortion correction.
Data pre-processing.
The susceptibility and eddy-current-induced distortions in diffusion data were first corrected using FSL topup and eddy 8-10. Tensor fitting was conducted using FSL dtifit 10.
A lesion mask was manually drawn on the T2w-FLAIR images (Figure 1A), co-registered to the standard MNI space and mirrored to the contralateral side (Figure 1B). Finally, all images (DTI, FLAIR), the lesion mask, and the mirrored contralateral mask were co-registered to the native T1w-MPRAGE space.
The white matter (WM) surface and the pial surface were generated using FreeSurfer with the MPRAGE image 11. Six surfaces were reconstructed including the WM (0th), the pial (5th), and four equidistant intermediate surfaces (1st to 4th ) between the WM and pial surfaces12. Figure 1C displays representative WM and pial surfaces, one intermediate surface (the 2nd surface), and the lesion and contralateral masks.
Data analysis.
The cortical fiber radiality was quantified by the angle (θ∈[0, 90°]) between the principal diffusion eigenvector (V1) and the surface norm vector 3, in the lesion and contralateral masks (Figure 1C). A smaller θ indicates the cortical fiber orientation is more radial while a larger θ means the orientation is more tangential against the surface.
Results
High-quality directionally-encoded color (DEC) maps were reconstructed using both the optimized ss-EPI and gSLIDER scans (Figure 2). The enlarged line representations demonstrate the capability to map consistent fiber orientations in both WM and cortex.Varying lesion sizes and locations are observed over different patients (Figure 3). We observed that the mean angle (θ) difference between the lesion and contralateral masks is more pronounced on the 2nd surface, with the mean ± standard deviations (STD) of the angle (θ) of each patient plotted in Figure 4. All other patients except for patient 1 show less radial cortical fiber orientations in the lesion than the contralateral ROI, while patient 1 shows more radial orientations in the lesion than the contralateral ROI.
Figure 5 shows the angle (θ) on the inflated surfaces for all six patients, with the lesion noted by the green circle(s).
Discussion & Conclusion
Our high-resolution diffusion MRI study demonstrates that cortical fiber orientation is altered in human FCD in vivo. Histological classifications of FCDs describe certain FCD types with less, and others with more, radial microstructure 13, possibly related to the differences observed among our cohort (i.e., patient 1 vs. others). Further correlations between diffusion MRI cortical fiber mapping and stereo-EEG, histology, and clinical outcomes will provide further support for the utility of this method.Acknowledgements
We thank the funding support from GE Healthcare, NIH R01NS095985, and NIH K99AG080076.
References
1. Sisodiya SM, Fauser S, Cross JH, et al. Focal cortical dysplasia type II: biological features and clinical perspectives. The Lancet Neurology 2009;8:830-843.2. Urbach H, Kellner E, Kremers N, et al. MRI of focal cortical dysplasia. Neuroradiology 2022;64:443-452.
3. McNab JA, Polimeni JR, Wang R, et al. Surface based analysis of diffusion orientation for identifying architectonic domains in the in vivo human cortex. Neuroimage 2013;69:87-100.
4. Villasenor PJ, Cortes-Servin D, Perez-Moriel A, et al. Multi-tensor diffusion abnormalities of gray matter in an animal model of cortical dysplasia. Front Neurol 2023;141124282.
5. Yang GK, Cocjin J, McNab JA. Optimizing diffusion MRI for mapping cortical fiber patterns. In Proceedings of the 27th Annual Meeting of ISMRM, Montreal, QC, Canada, 2019. Abstract 3500.
6. Setsompop K, Fan Q, Stockmann J, et al. High-resolution in vivo diffusion imaging of the human brain with generalized slice dithered enhanced resolution: Simultaneous multislice (gSlider-SMS). Magn Reson Med 2018;79:141-151.
7. Liao C, Stockmann J, Tian Q, et al. High-fidelity, high-isotropic-resolution diffusion imaging through gSlider acquisition with B 1 + and T1 corrections and integrated DeltaB0 /Rx shim array. Magn Reson Med 2020;83:56-67.
8. Andersson JLR, Skare S, Ashburner J. How to correct susceptibility distortions in spin-echo echo-planar images: application to diffusion tensor imaging. Neuroimage 2003;20:870-888.
9. Andersson JLR, Sotiropoulos SN. An integrated approach to correction for off-resonance effects and subject movement in diffusion MR imaging. Neuroimage 2016;125:1063-1078.
10.Jenkinson M, Beckmann CF, Behrens TE, et al. Fsl. Neuroimage 2012;62:782-790.
11. Fischl B. FreeSurfer. Neuroimage 2012;62:774-781.
12. Polimeni JR, Fischl B, Greve DN, et al. Laminar analysis of 7T BOLD using an imposed spatial activation pattern in human V1. Neuroimage 2010;52:1334-1346.
13. Blumcke I, Thom M, Aronica E, et al. The clinicopathologic spectrum of focal cortical dysplasias: a consensus classification proposed by an ad hoc Task Force of the ILAE Diagnostic Methods Commission. Epilepsia 2011;52:158-174.
Figures
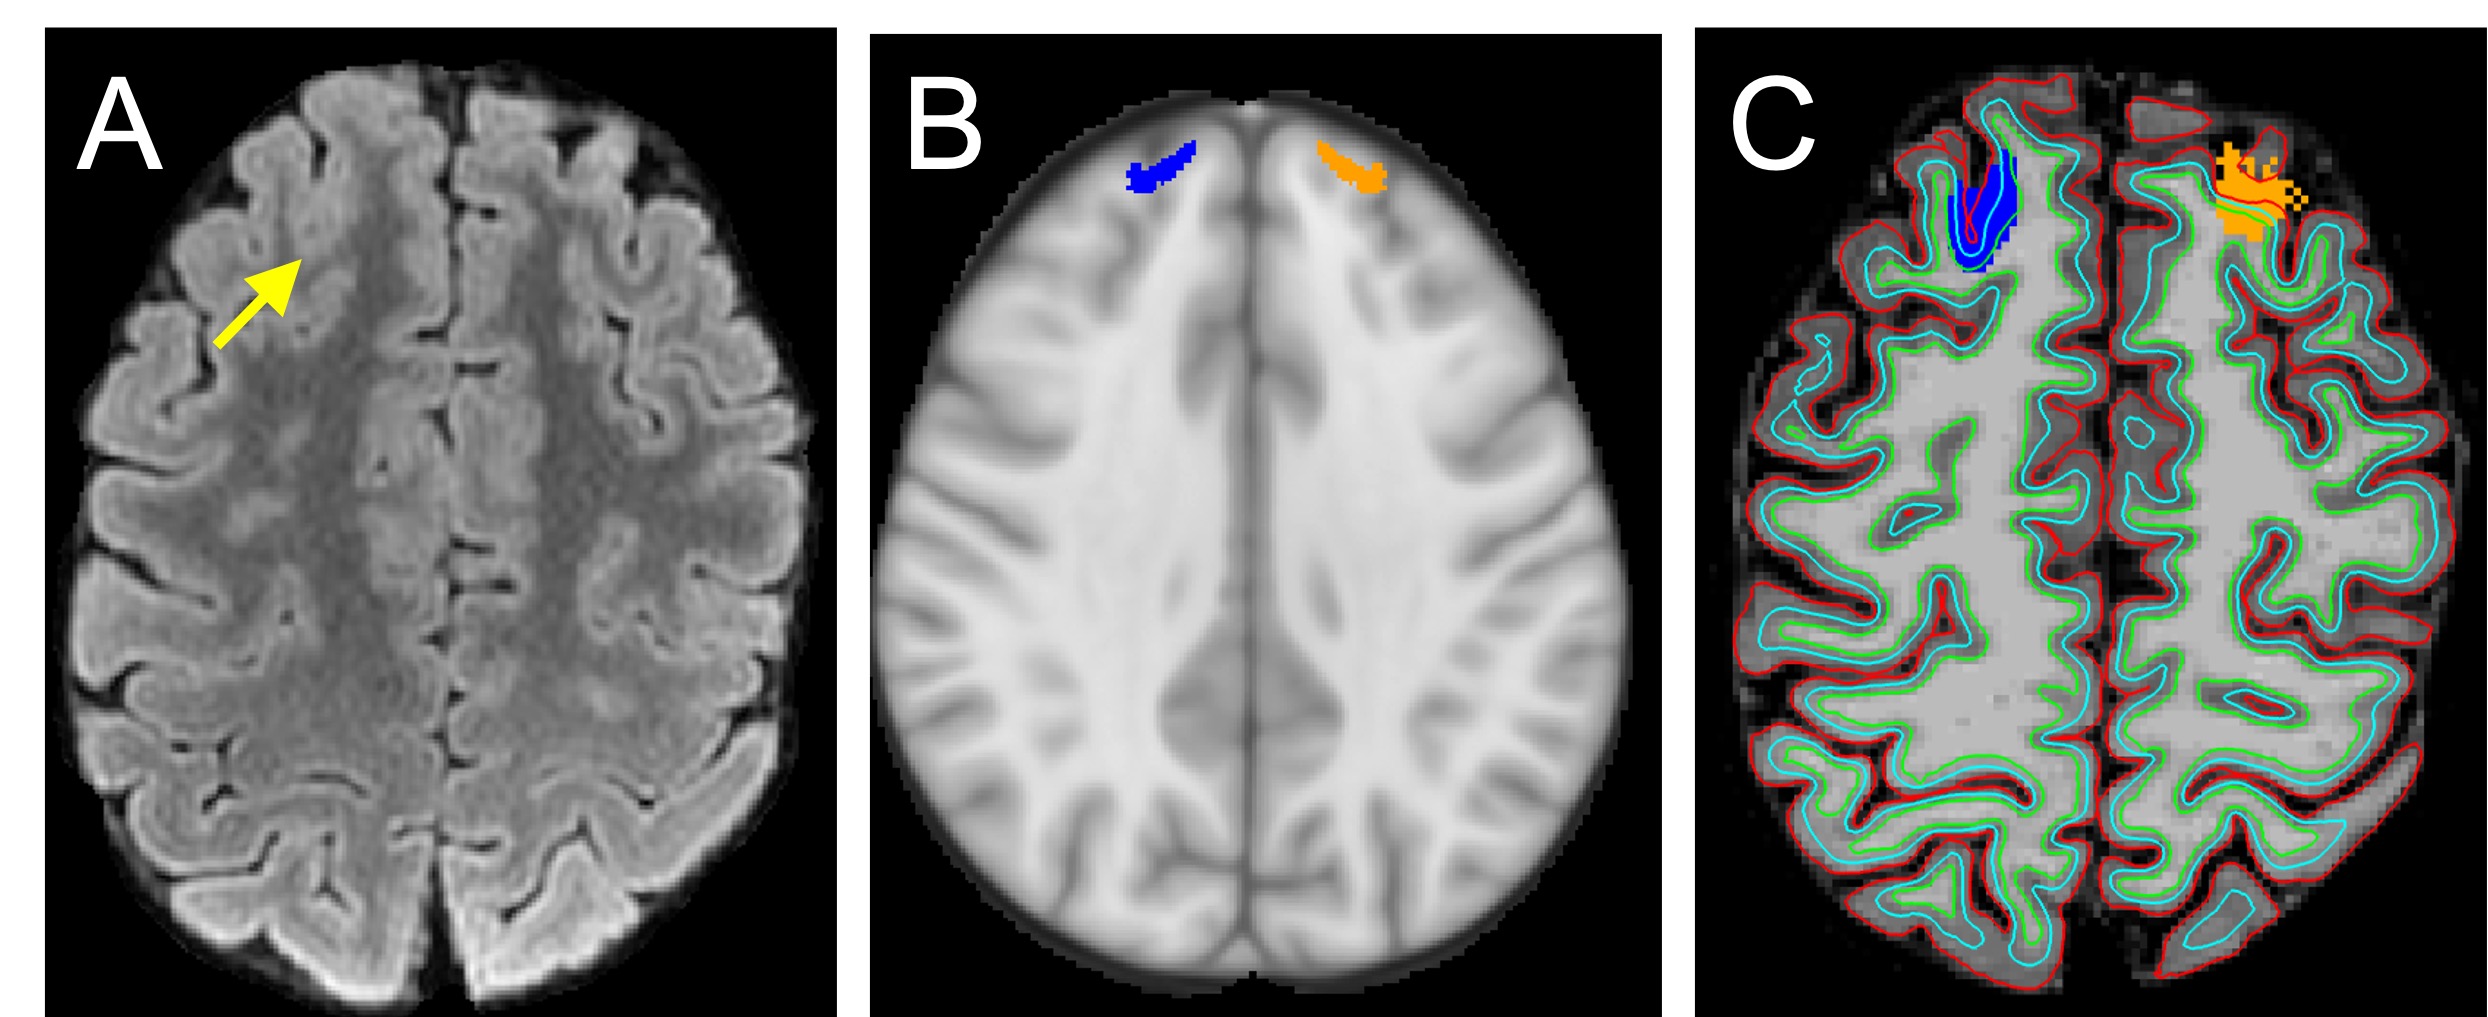
Figure 1. (A) FCD lesion (yellow arrowhead) on a T2w-FLAIR image. (B) The FCD lesion mask (blue) and the mirrored mask (orange) on the contralateral side in the MNI space. (C) The FCD lesion mask (blue) and the mirrored mask (orange) in the native T1 space, superimposed by the white matter surface (green), an intermediate surface (the 2ndsurface in turquoise), and the pial surface (red). The projections of the lesion/contralateral masks on each surface are used for the surface analysis of cortical fiber orientations.
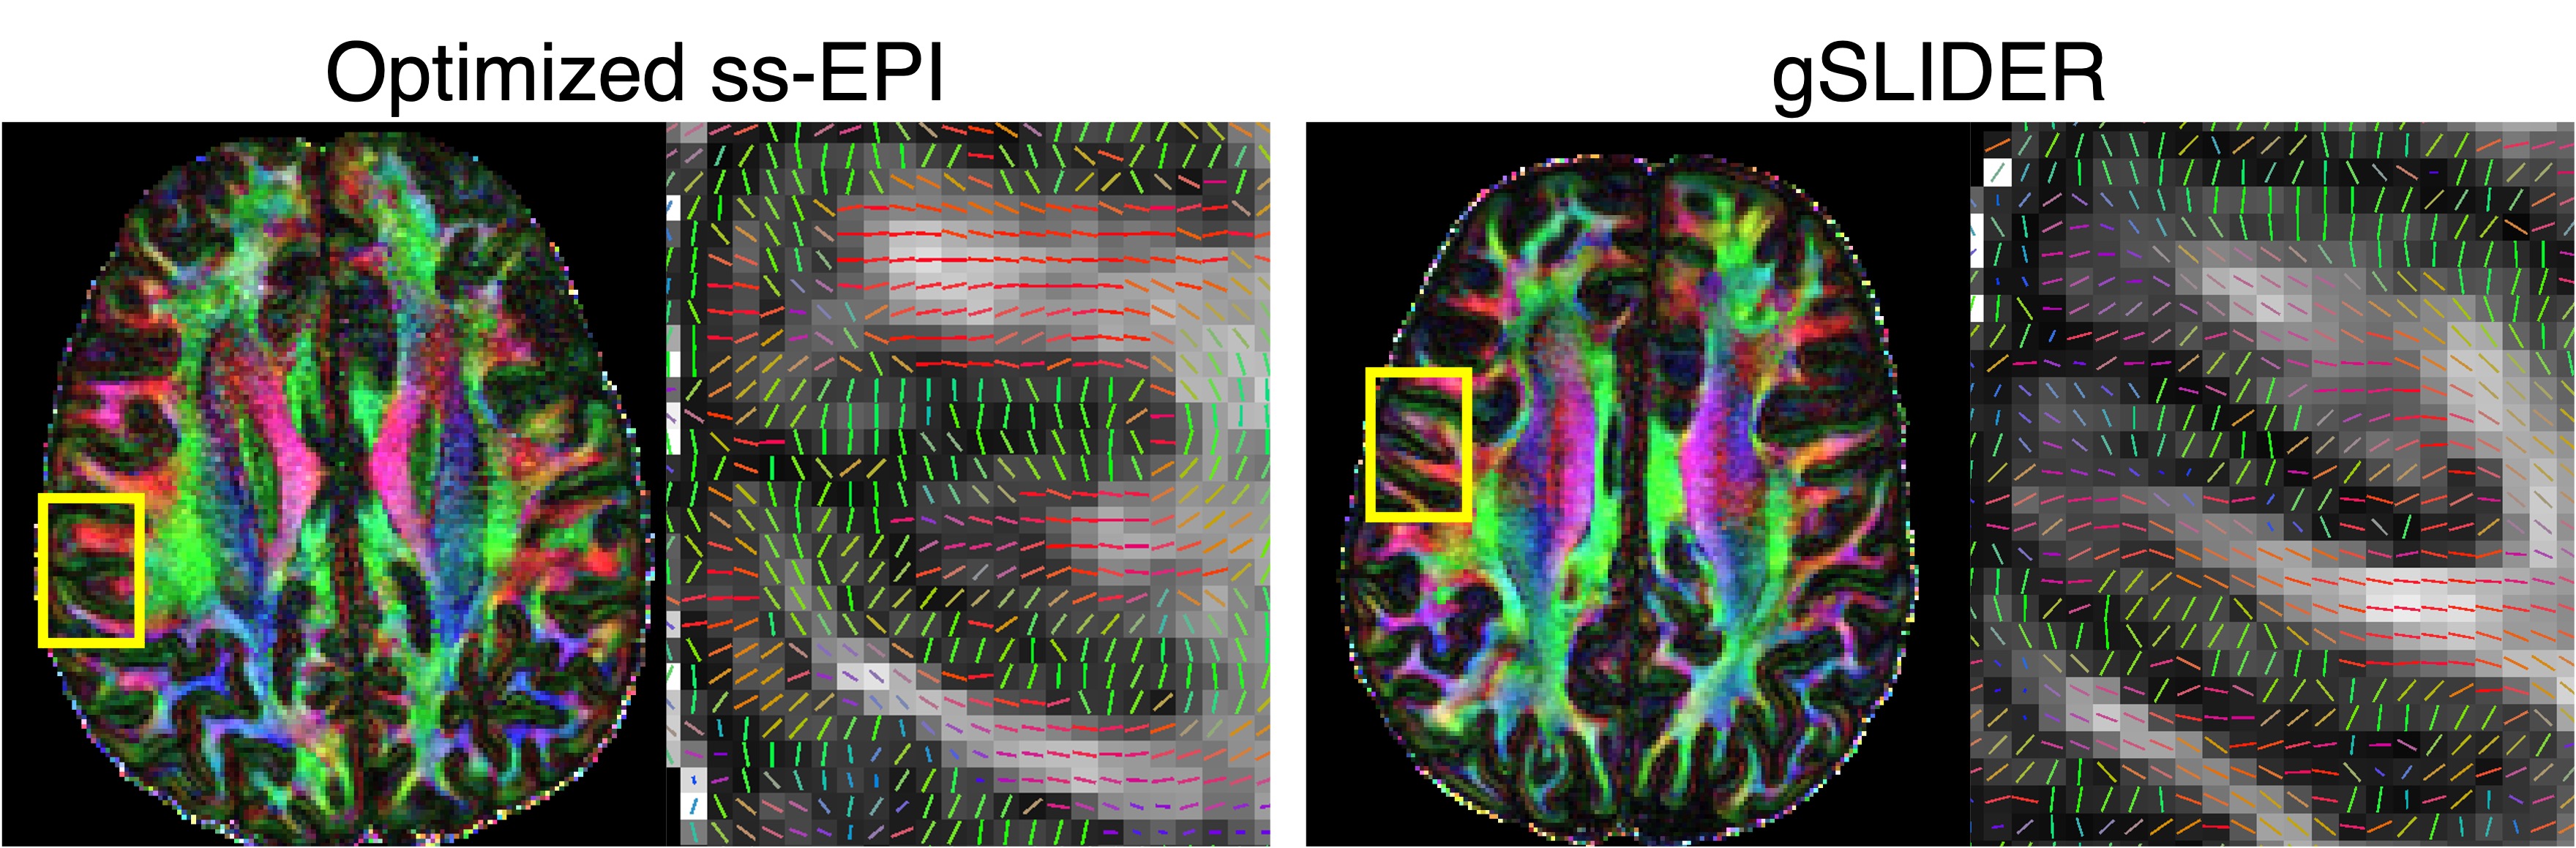
Figure 2. Example directionally-encoded color (DEC) maps and the line representation of the principal diffusion orientations in selected normal regions (i.e., not identified as FCD on clinical T2w-FLAIR images), with diffusion data from the optimized 2D ss-EPI and gSLIDER acquisitions.
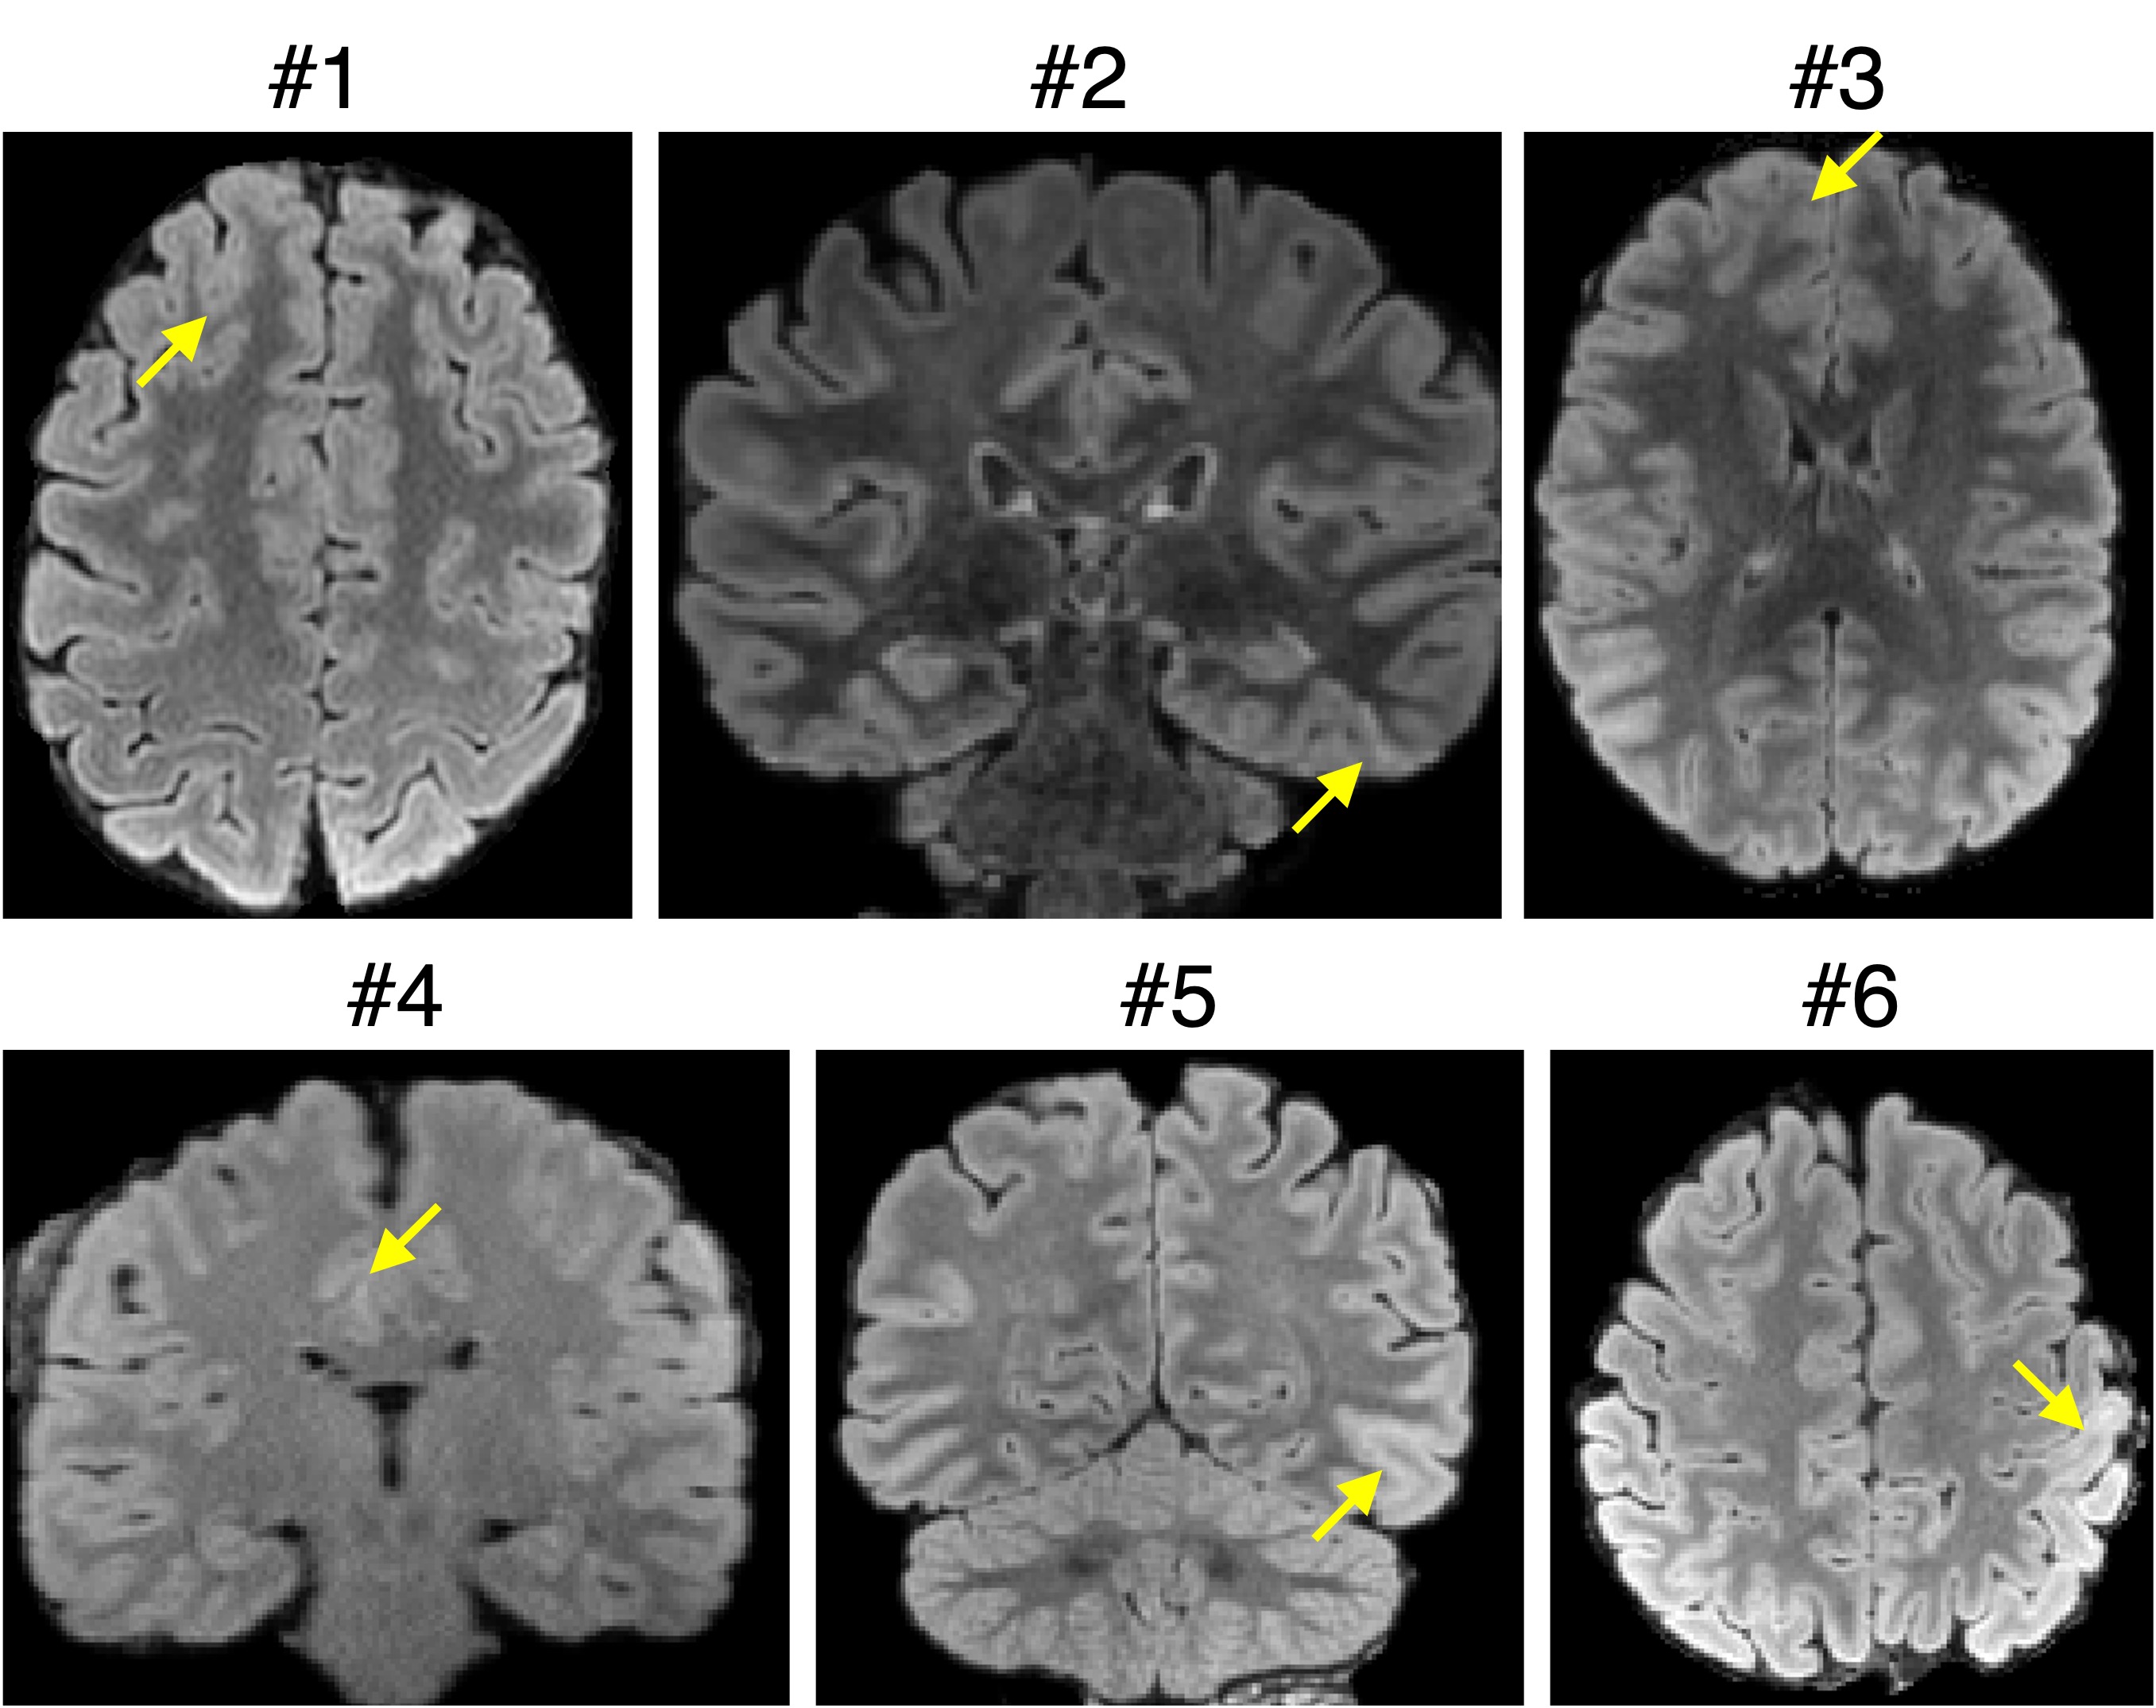
Figure 3. The FCD lesions (yellow arrowheads) on the T2w-FLAIR images on each subject, shown in the axial (patients 1, 3, and 6) or coronal view (patients 2, 4, and 5).
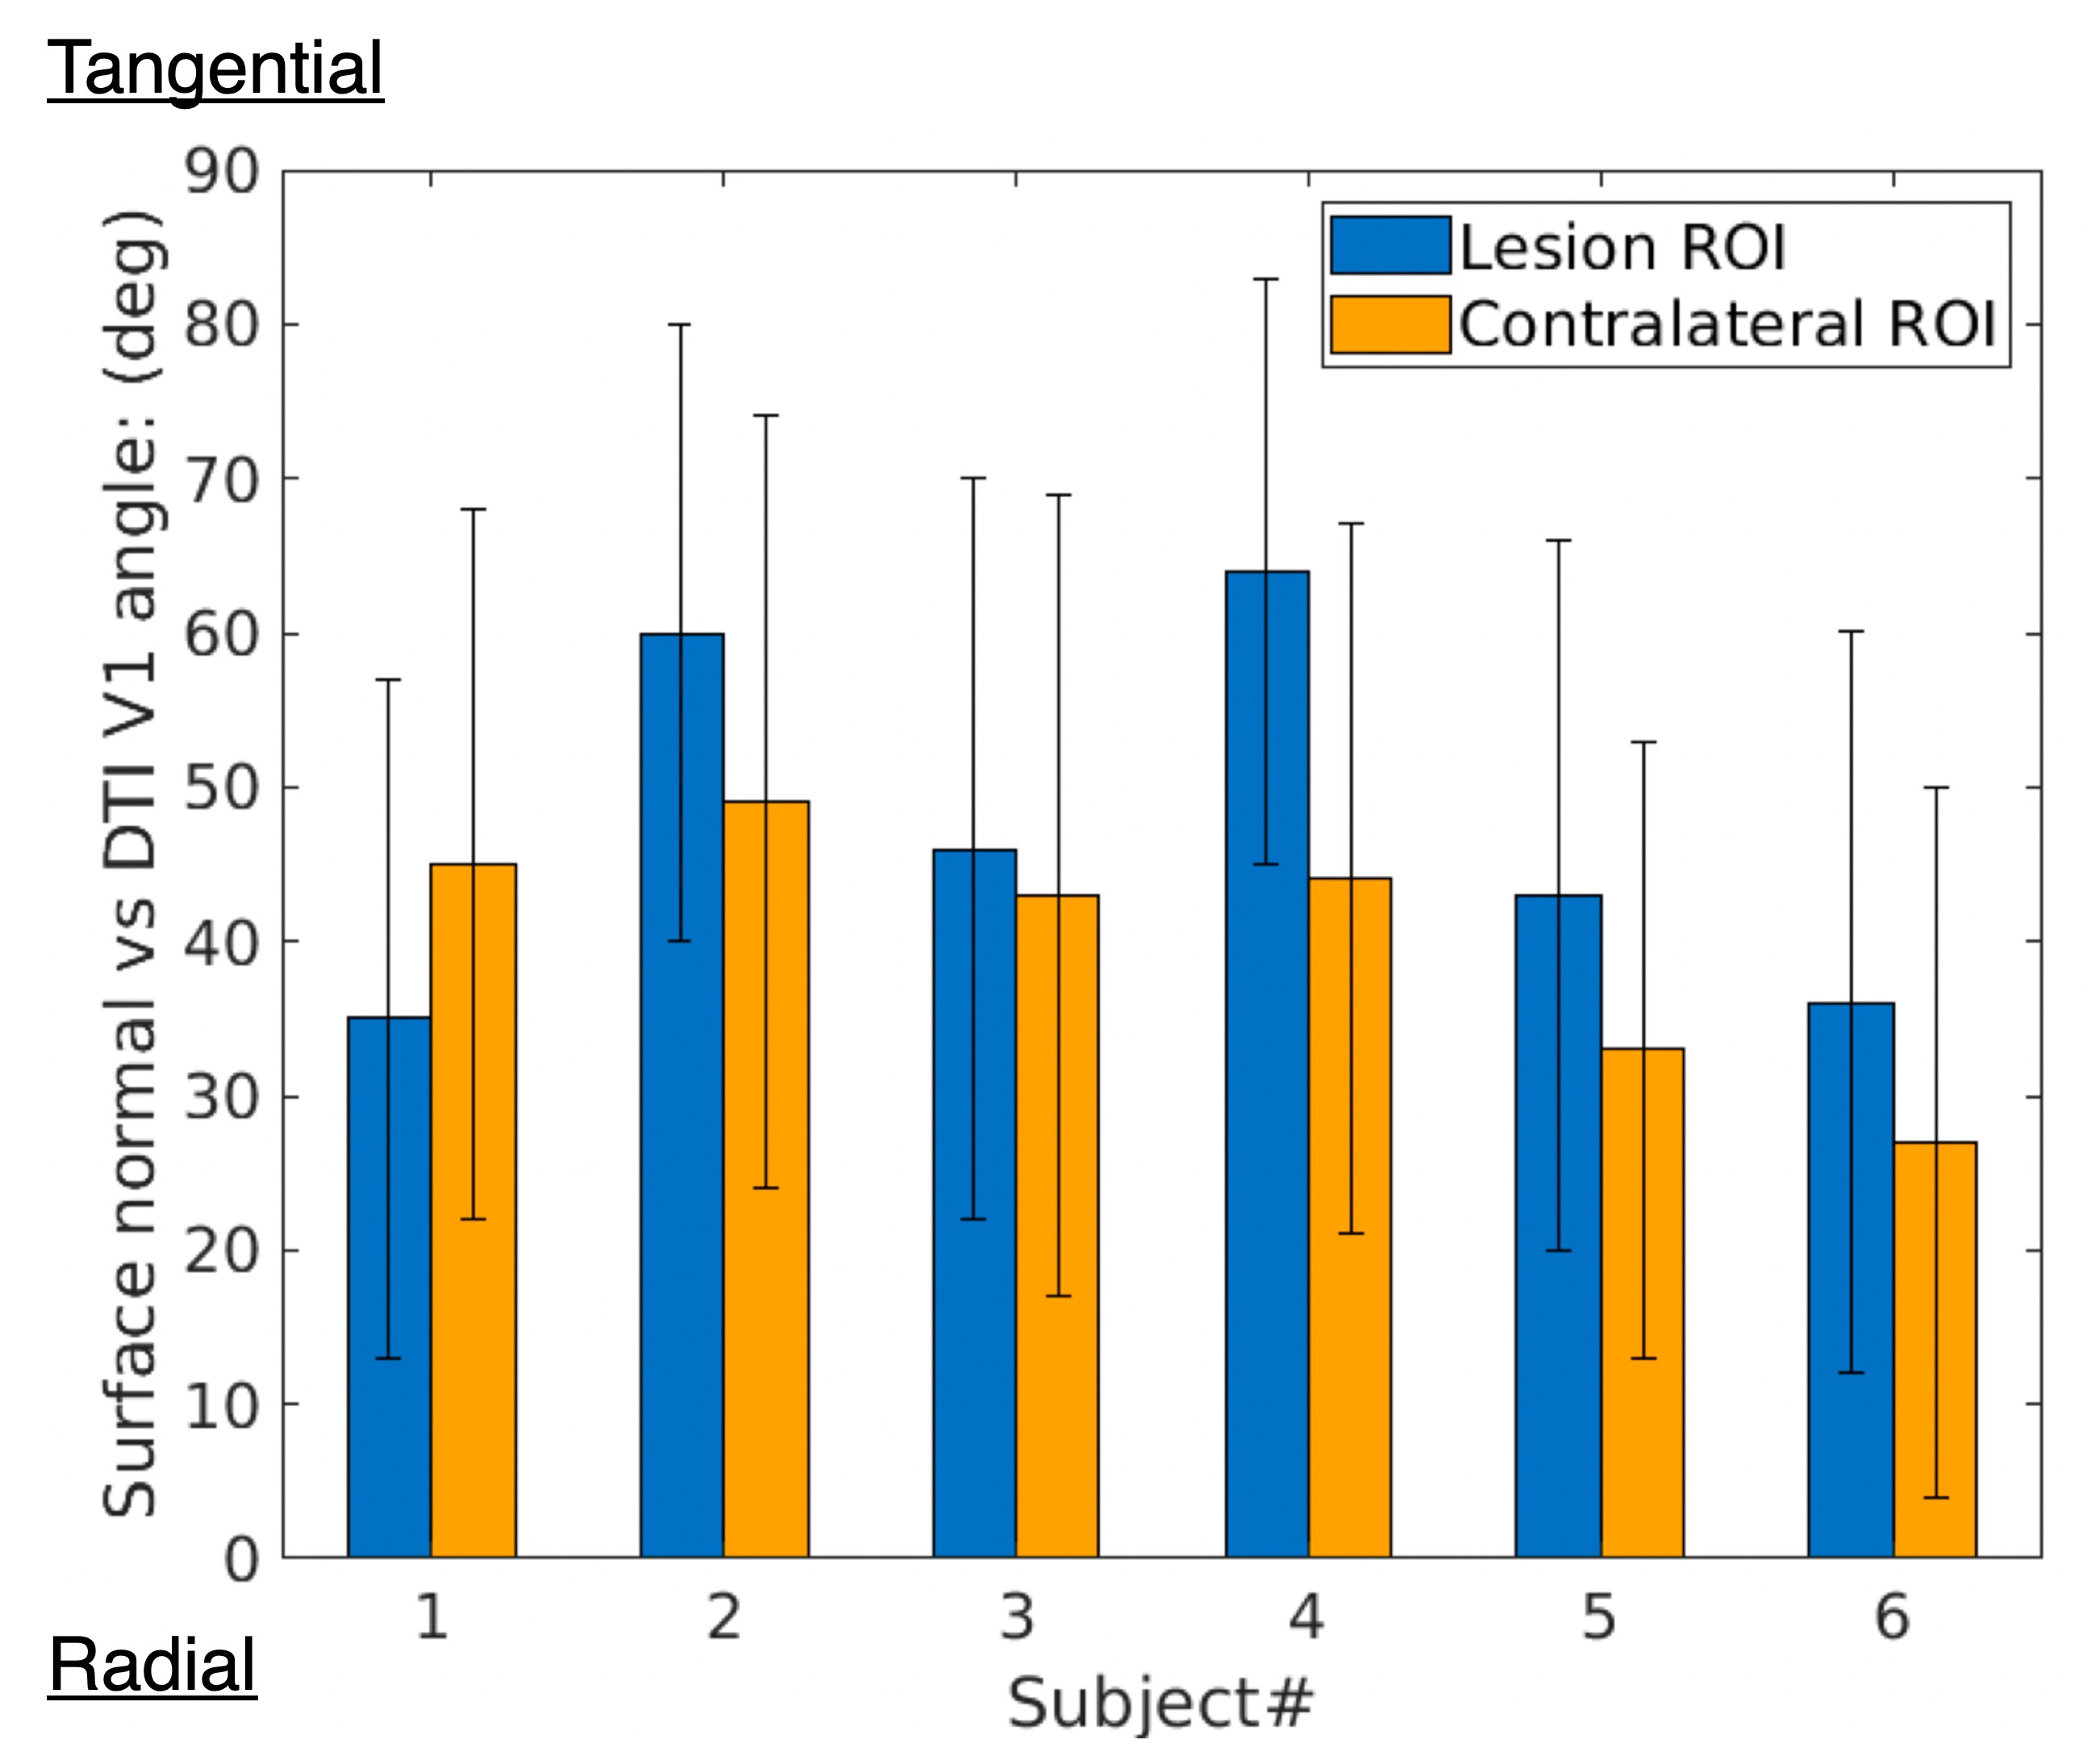
Figure 4. The mean ± standard deviations (STD) plots of the angle between the principal diffusion eigenvector (V1) and the surface norm on the 2nd intermediate surface, in the lesion (blue) and contralateral ROIs (orange) of each patient. A smaller angle corresponds to a more radial cortical fiber orientation.
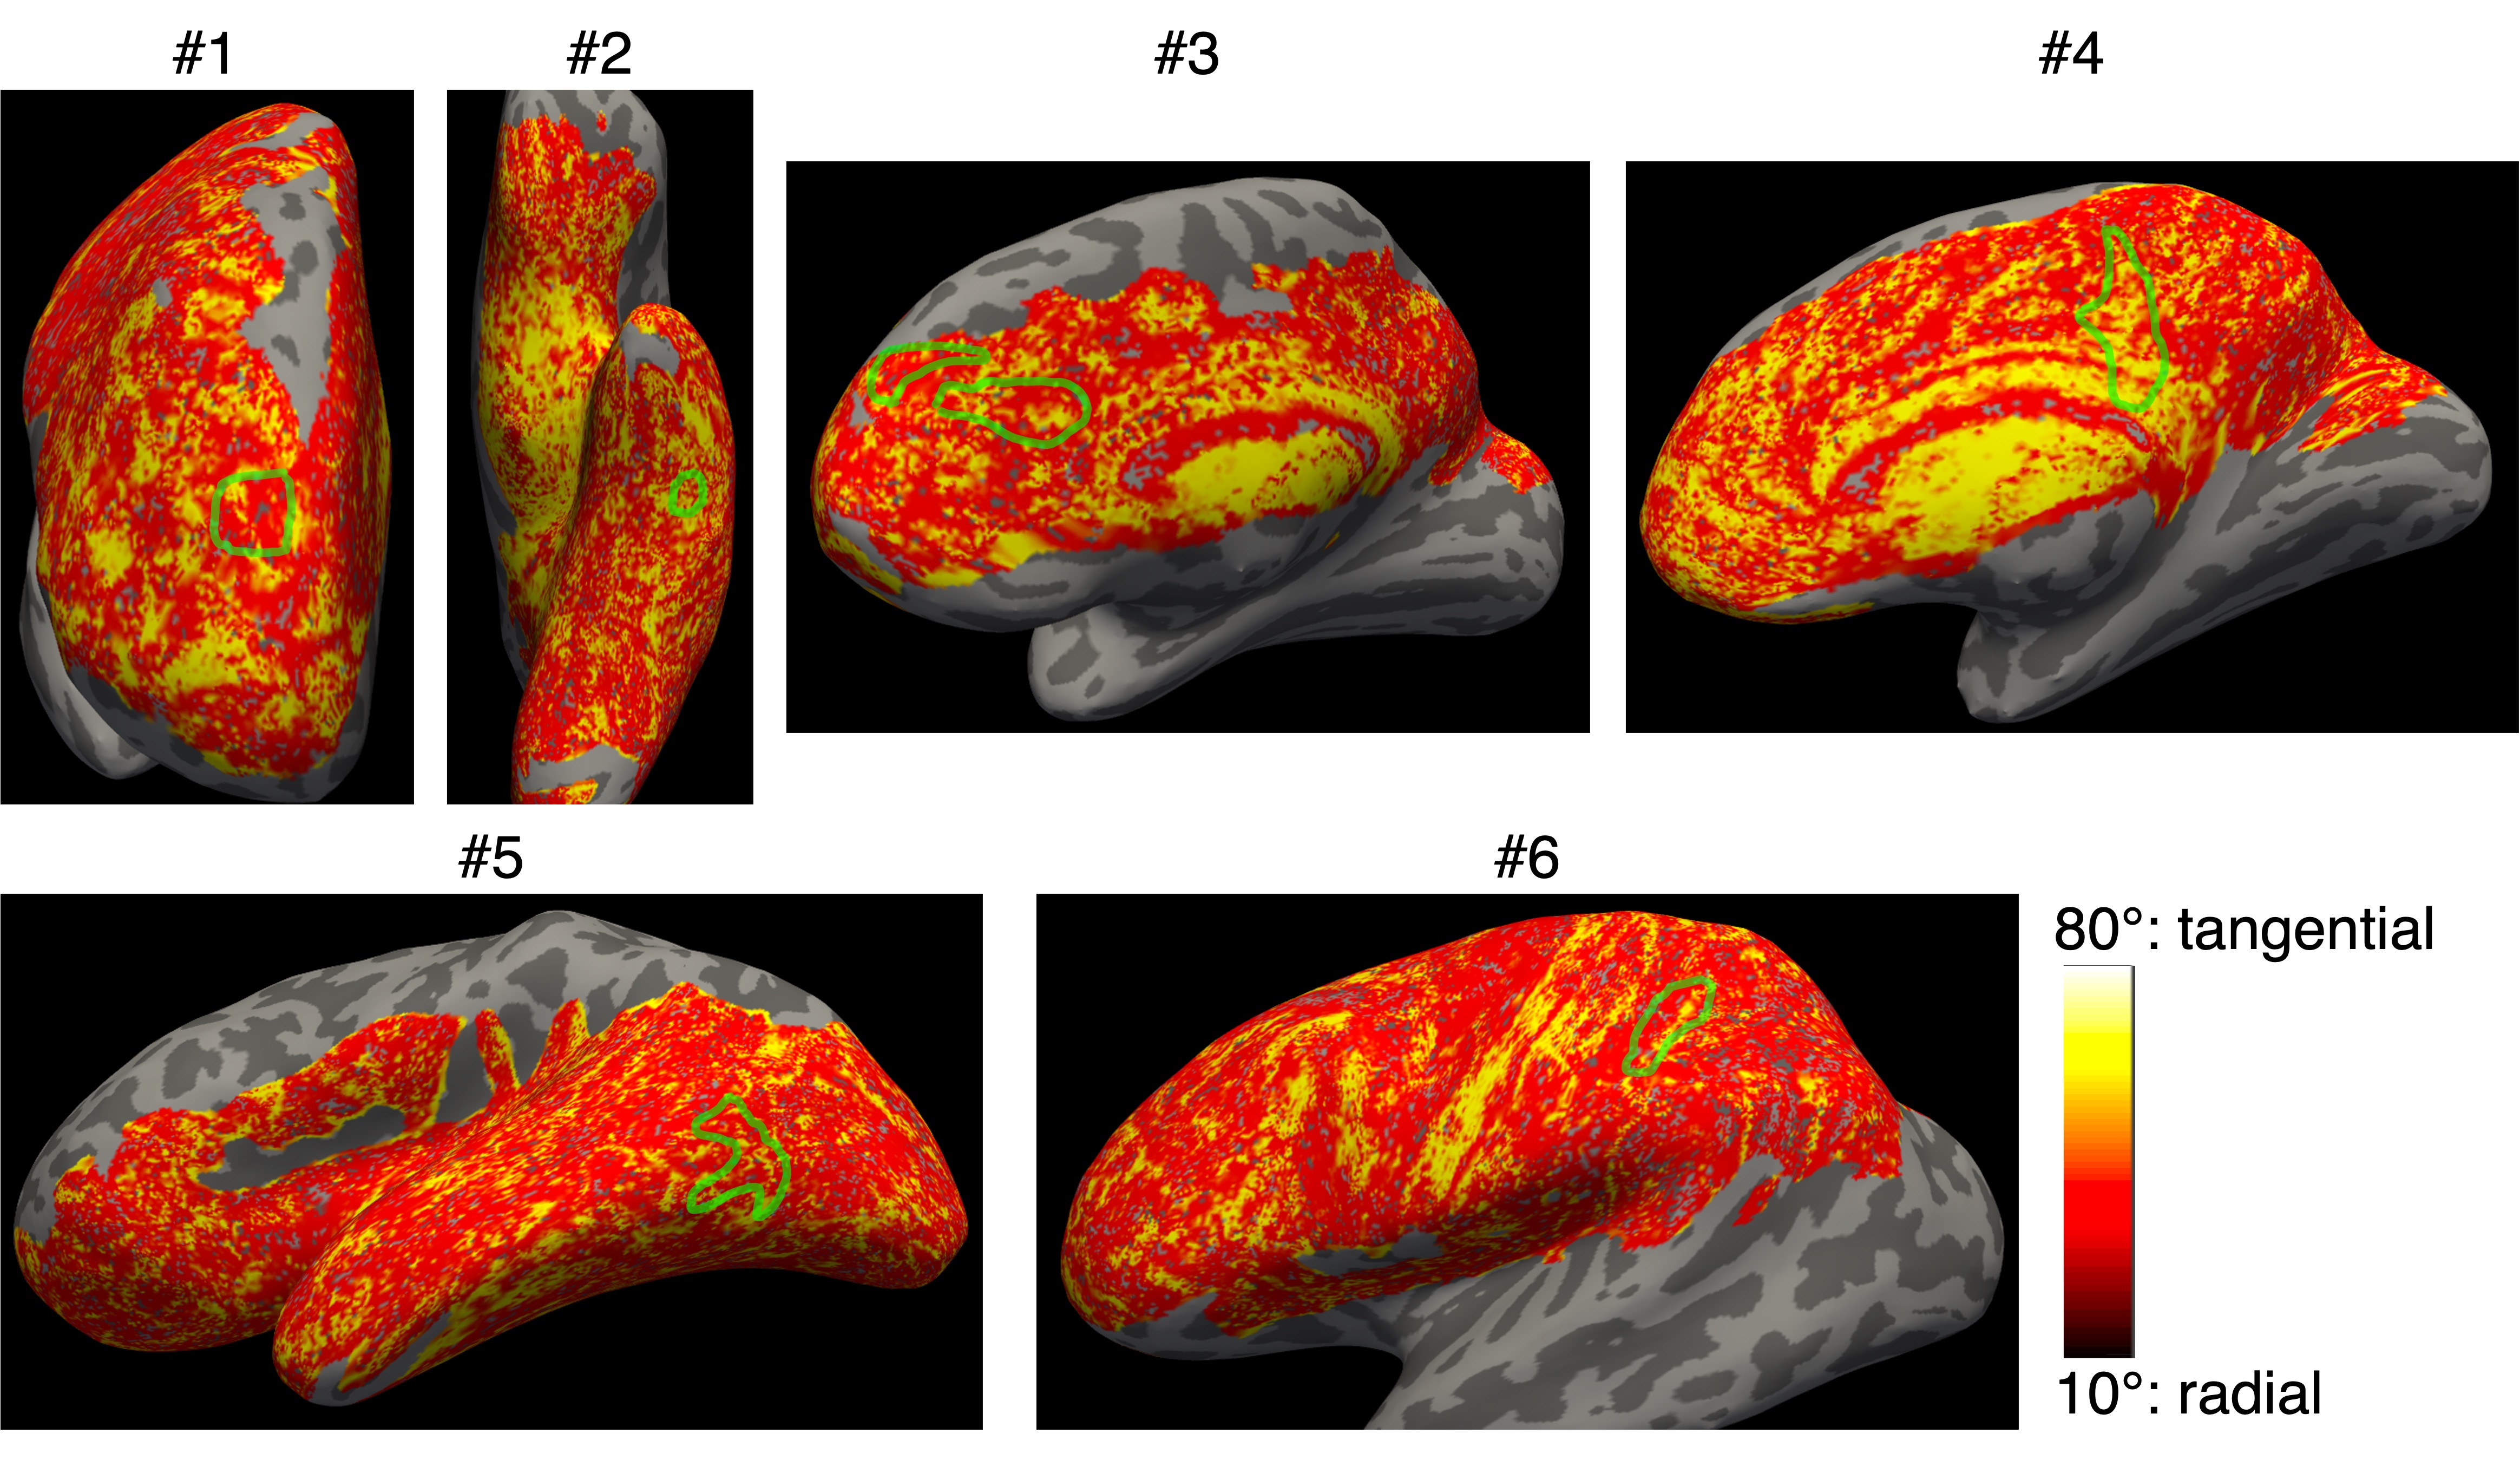
Figure 5. The angle between the principal diffusion eigenvector (V1) and the surface norm on the 2nd intermediate surface in the lesion ROI (green circles), plotted on the inflated surfaces for six patients. A smaller angle corresponds to a more radial cortical fiber orientation.