3219
The relationship of glutamate to glutamine and metabolic profiling in focal epilepsy using 7T CRT-FID-MRSI1Department for Neurosurgery, Medical University of Vienna, Vienna, Austria, 2Department of Biomedical Imaging and Image-guided Therapy, Medical University of Vienna, Vienna, Austria, 3Division of Nuclear Medicine, Department of Biomedical Imaging and Image-guided Therapy, Medical University of Vienna, Vienna, Austria, 4Department for Neurology, Medical Hospital Hietzing, Vienna, Austria, 5Center of rare and complex epilepsies, member of ERN EpiCARE, Department of Paediatrics, Medical University of Vienna, Vienna, Austria, 6Department for Neurology, Medical University of Vienna, Vienna, Austria, 7Division of Neuroradiology and Musculoskeletal Radiology, Medical University of Vienna, Vienna, Austria, 8Christian Doppler Laboratory for Clinical Molecular MR Imaging, Medical University of Vienna, Vienna, Austria
Synopsis
Keywords: Spectroscopy, High-Field MRI
Motivation: We want to explore the potential benefits that high-field MRSI can provide added value by allowing for higher spectral resolution of metabolites.
Goal(s): Our goal was to test the robustness of 7T-CRT-FID-MRSI in the characterization of epilepsy, in particular with respect to glutamate and glutamine.
Approach: We measured 42 patients with focal epilepsy using 7T-CRT-FID-MRSI. The obtained metabolites were normalized to ratios of NAA and tCr and concentration estimates of glutamate and glutamine were related to seizure frequency.
Results: We could demonstrate that high-field MRSI shows high sensitivity in identifying epileptic zones as well as a correlation of glutamate/glutamine ratios to seizure frequency.
Impact: 7T-CRT-FID MRSI shows high potential for identifying metabolic alterations in epilepsy. Additionally, due to higher spectral resolution, we could demonstrate a correlation of seizure frequency to the glutamate/glutamine ratio, potentially aiding in quantification of seizure burden in clinical practice.
Introduction
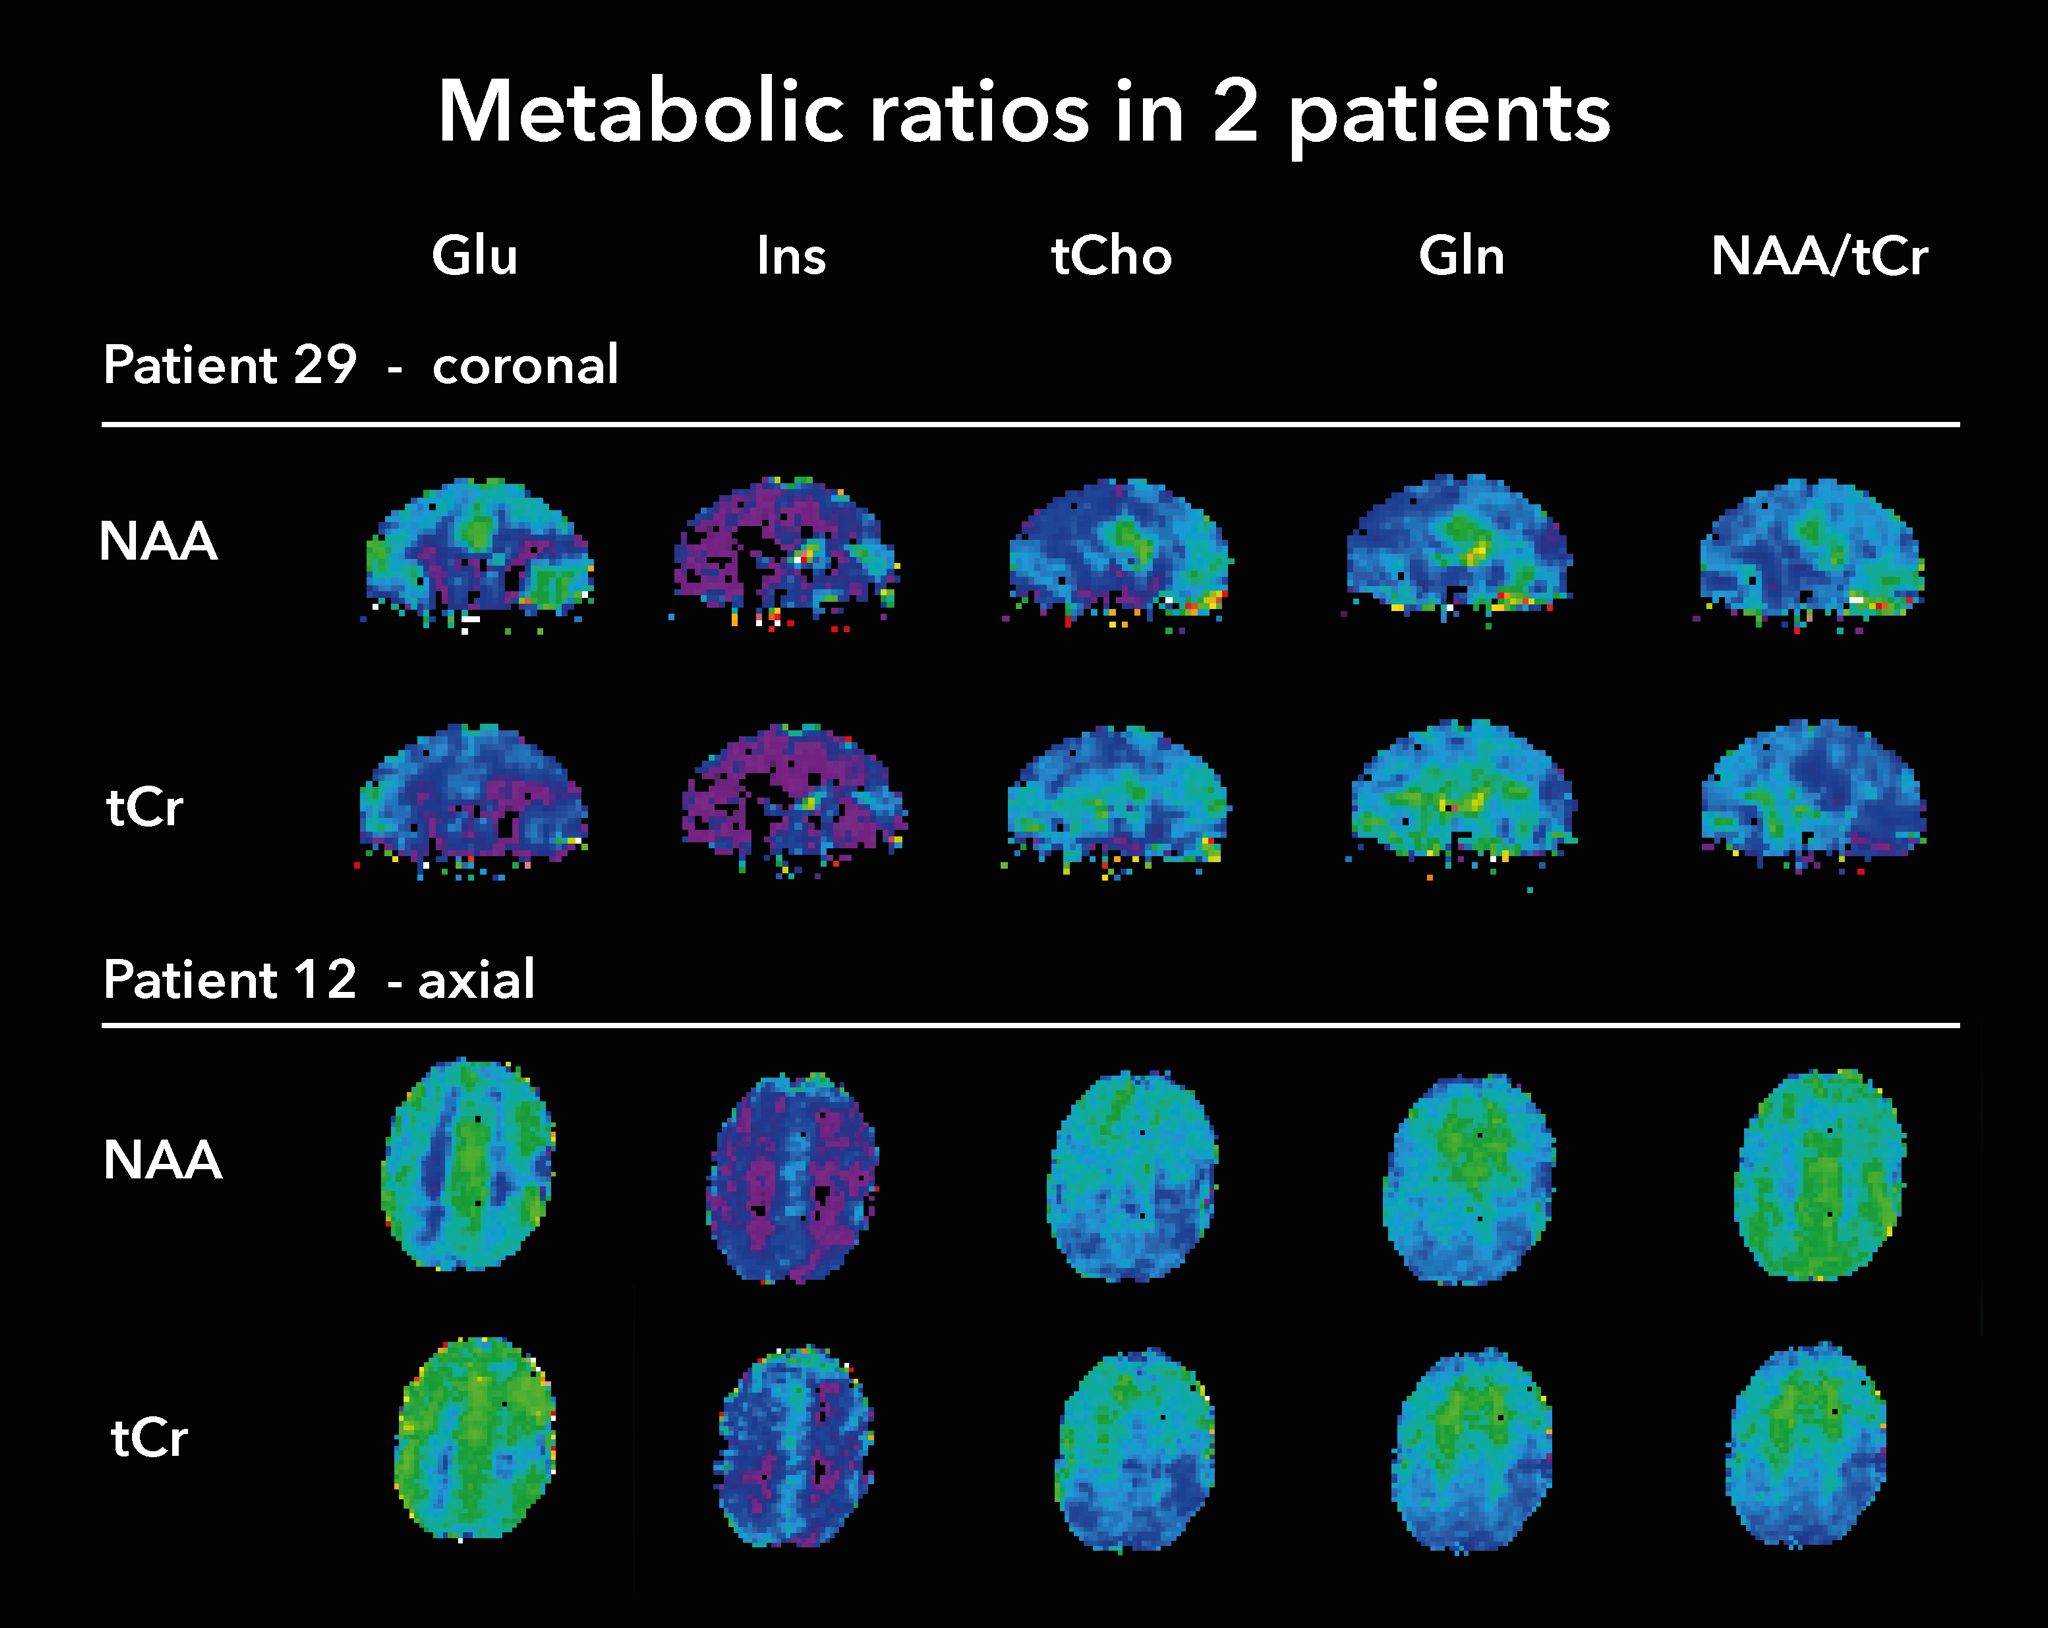
Epilepsy is a debilitating illness with a heterogenous range of pathologies unified by a common symptom: - seizures. Despite numerous pharmacological options, a third of patients remain pharmaco-resistant (1), with surgical intervention representing a possibly curative option. Successful surgery relies on the precise identification and delineation of lesions. A recent study by our group has shown that structural MRI at 7T provides diagnostic gain in focal epilepsy in up to 50% of the cases compared to routine clinical MRI (2). However, pharmaco-resistant patients without structural lesions pose a challenge in surgical planning. Mapping metabolic alterations in epileptogenic zones with MRSI presents a viable alternative, but until recently lacked fast HR-methods. Through higher spectral resolution, 7T MRSI enables the separation of metabolites with overlapping resonance frequencies, such as glutamate and glutamine (3). Despite the promising prospects of MRSI, reported changes in metabolites and ratios vary in literature at lower field strengths with normalized ratios either to N-acetylaspartate (NAA) or creatine (tCr) (4). Thus, it remains unclear which ratios show the most robust findings. The purpose of this study is to demonstrate the metabolic profile of glutamate (Glu), glutamine (Gln), myo-inositol (Ins), choline (tCho), tCr and NAA using 7T CRT-FID-MRSI in ratios normalized to NAA and Cr, as well as investigating the relationship of Glu to Gln in seizure onset zones (SOZ).Methods
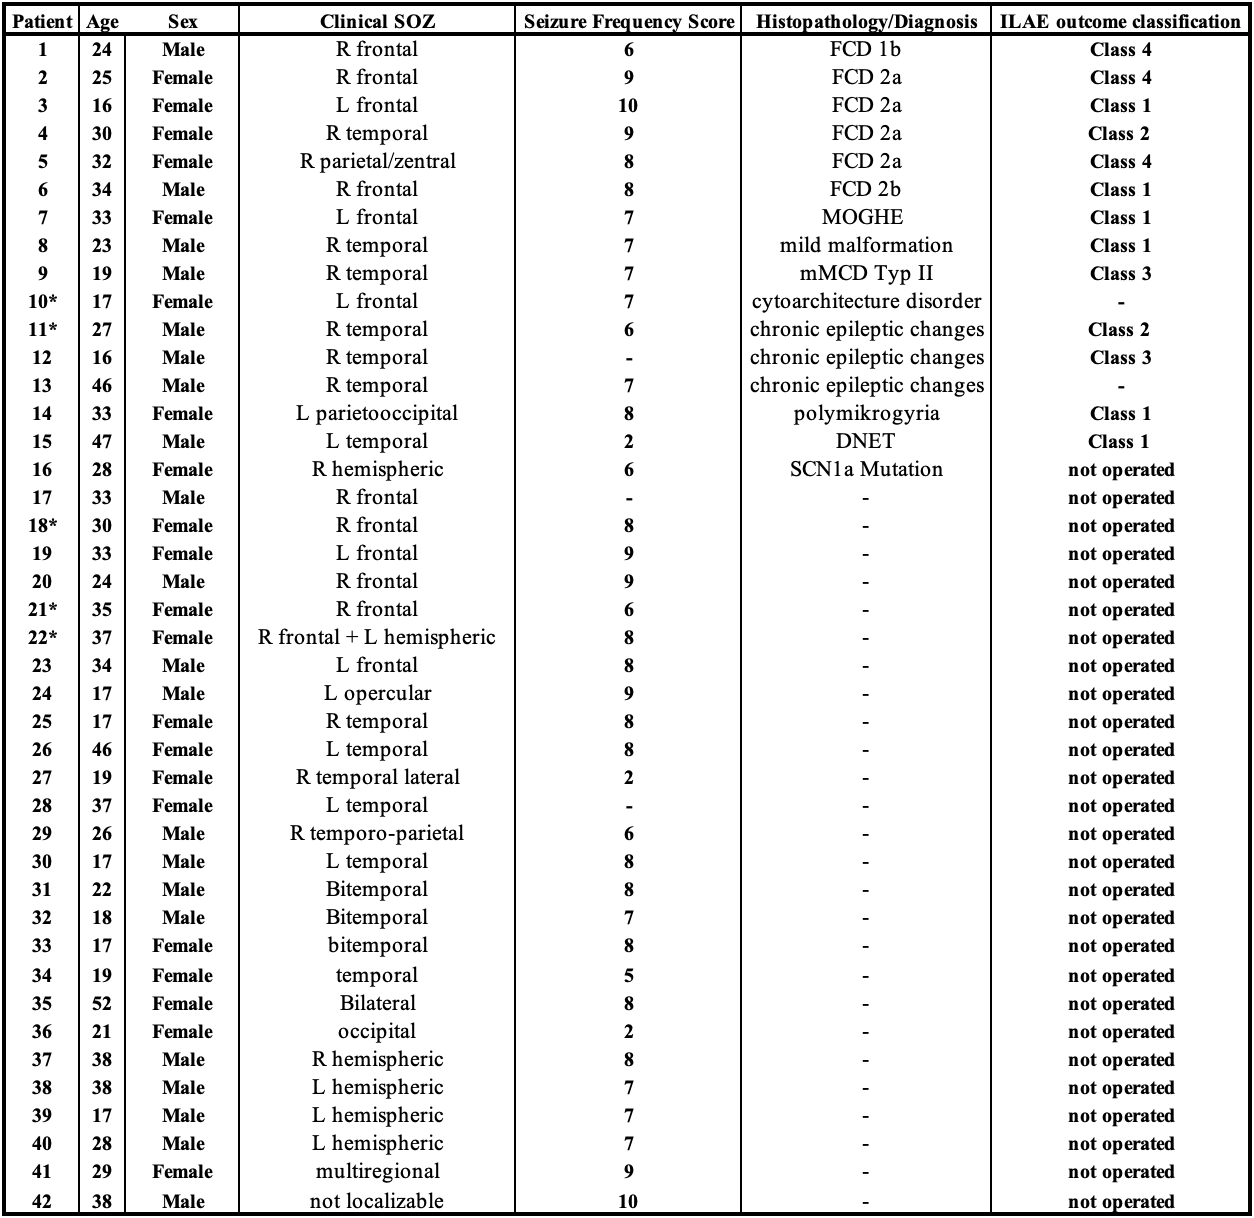
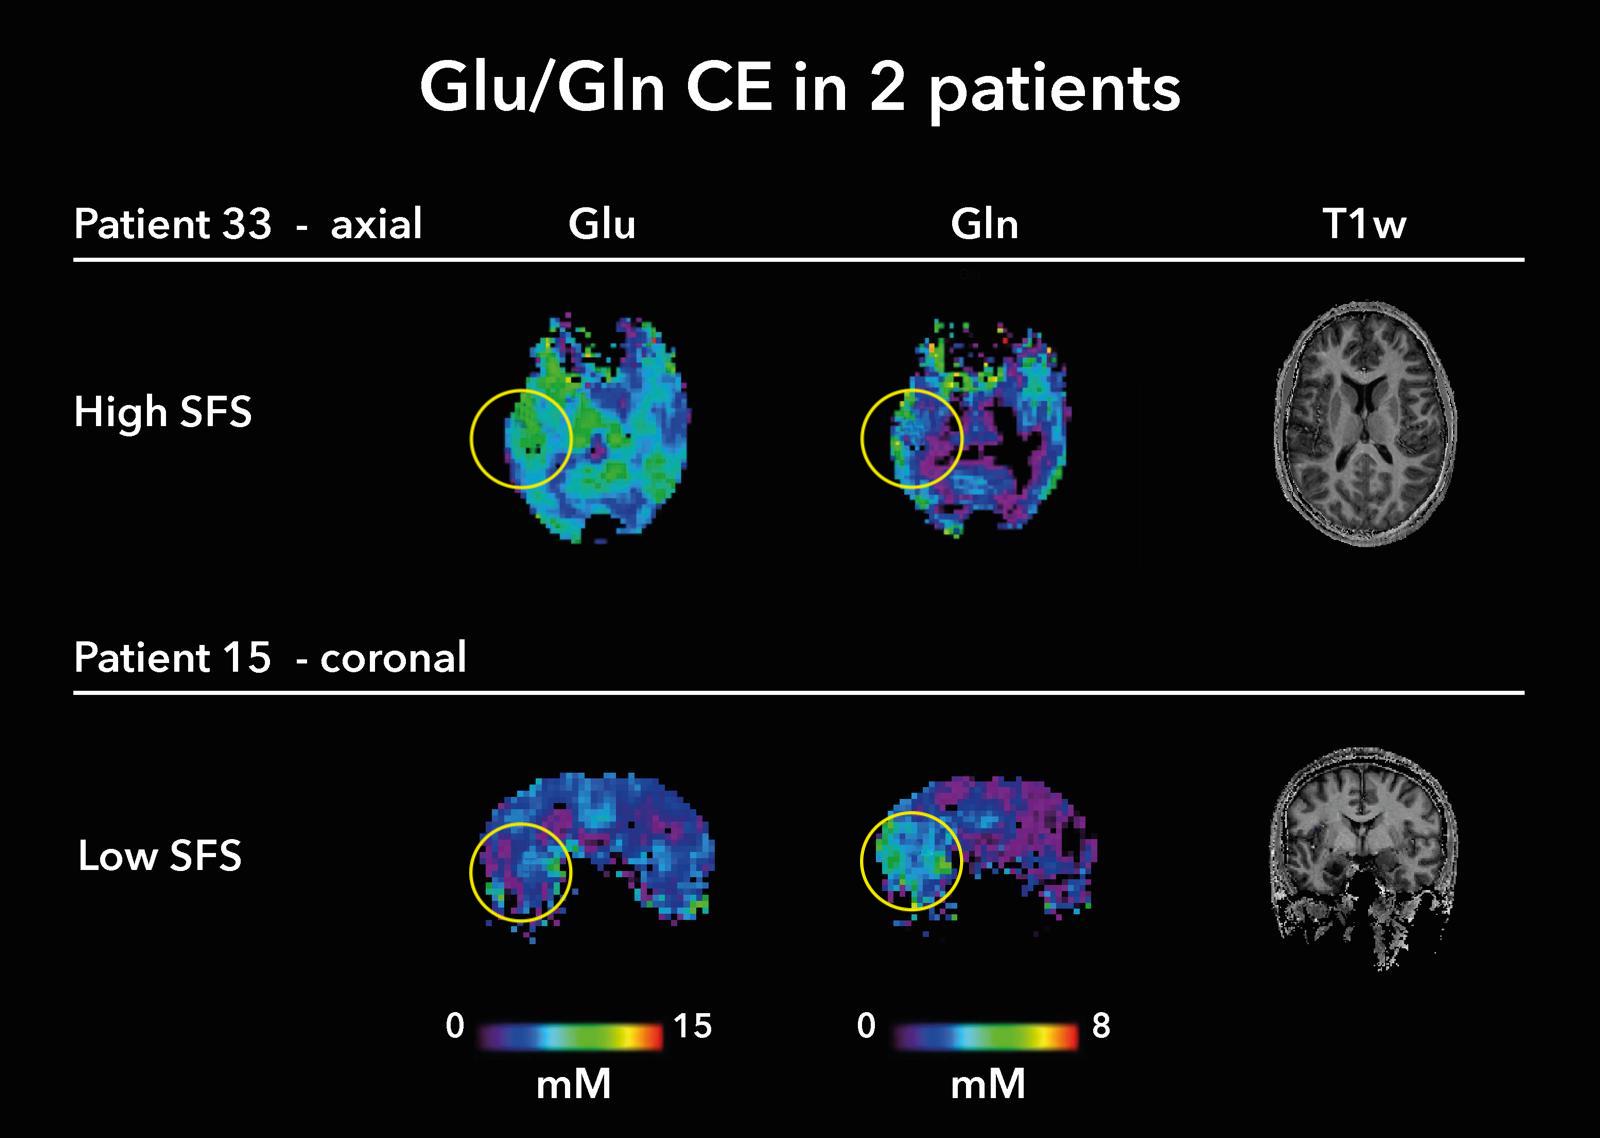
Forty-two patients with focal epilepsy (16-52 years, 21 females/21 males, Fig.1.) were enrolled in the study. Following informed written consent, they were measured with a 3D-MRSI protocol at 7T scanner (Siemens Healthineers Magnetom plus) with a 32Rx/1Tx-coil (Nova Medical). We acquired MRSI with 3.4 mm isotropic resolution in 15 minutes. The MRSI parameters included: 64×64×39 matrix, 220×220×133 mm³ FOV, acquisition delay of 1.3 ms, TR 450 ms. Morphological imaging included T1w (MP2RAGE), T2w, FLAIR, white matter suppressed T2w, and SWI. MRSI data was processed with an in-house pipeline that included L2-regularization (5). The resulting voxel spectra were quantified using LCModel with a basis set of fourteen components in a spectral range of 1.8-4.1 ppm. We evaluated the ratio maps of Glu, Gln, Ins, tCho, tCr and NAA normalized to NAA and tCr. Changes in the concentration estimates (CE) of glutamate and glutamine in the SOZ were related to the average CE of healthy volunteers (GluCN,GlnCN) obtained by previous work (6). The resulting GluSOZ/GluCN=GluLCR (LCR=lesion-control ratio, respectively for Gln) were further analyzed as ratios of GluLCR/GlnLCR, lending insight into the relationship of these metabolites in irritative zones. The findings were evaluated in relation to the clinical SOZ (seizure semiology, clinical MRI and EEG), seizure frequency (as seizure frequency score (7)) and where possible, to histopathology. Five patients were excluded from analysis due to insufficient scan quality.Results
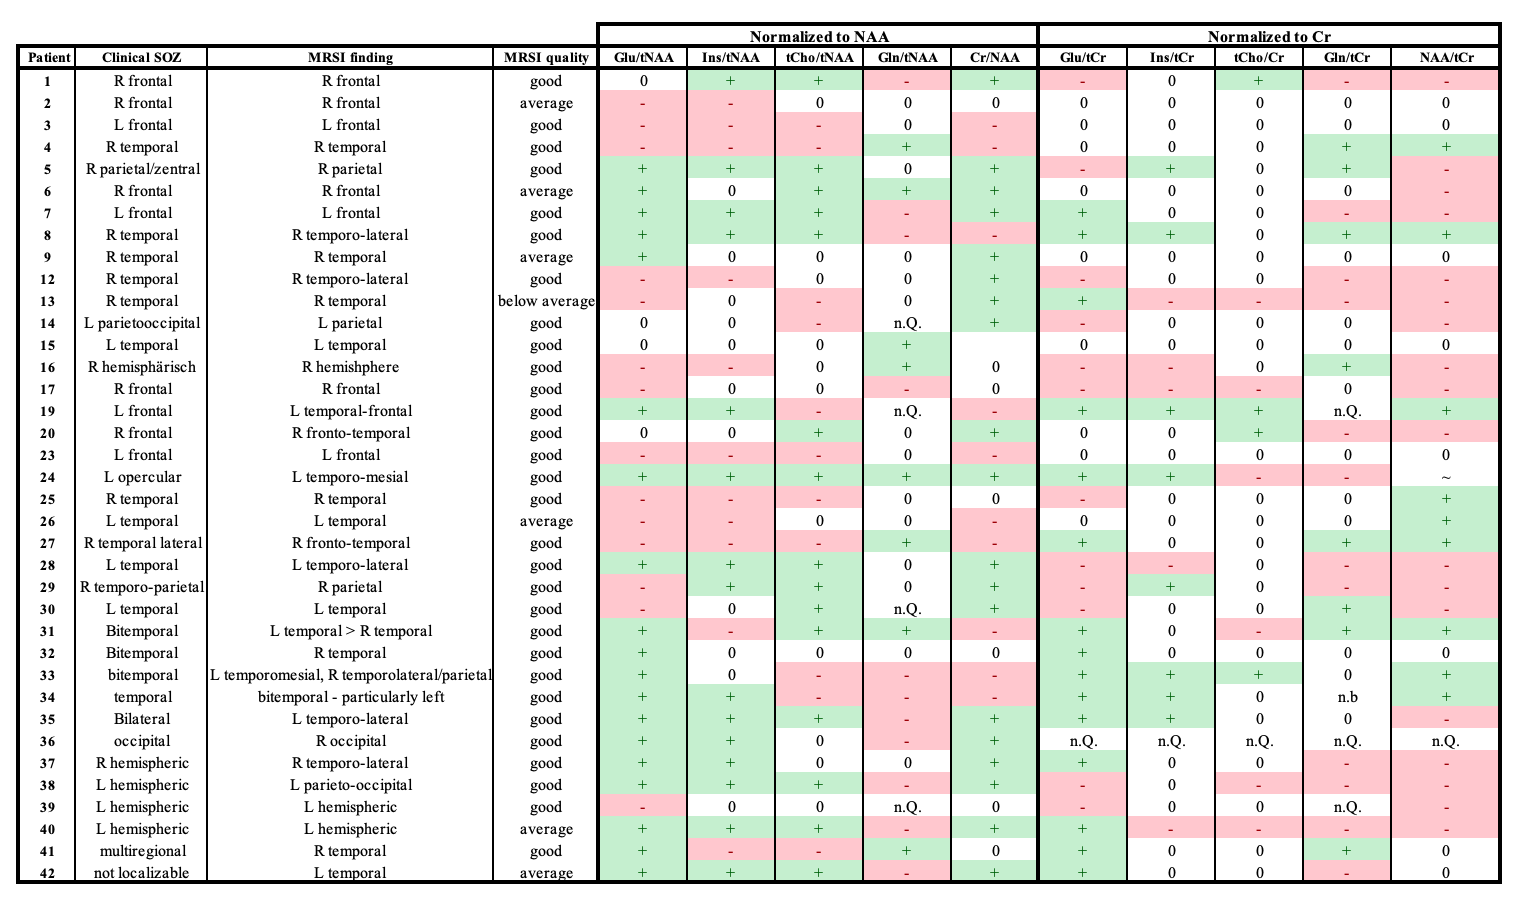
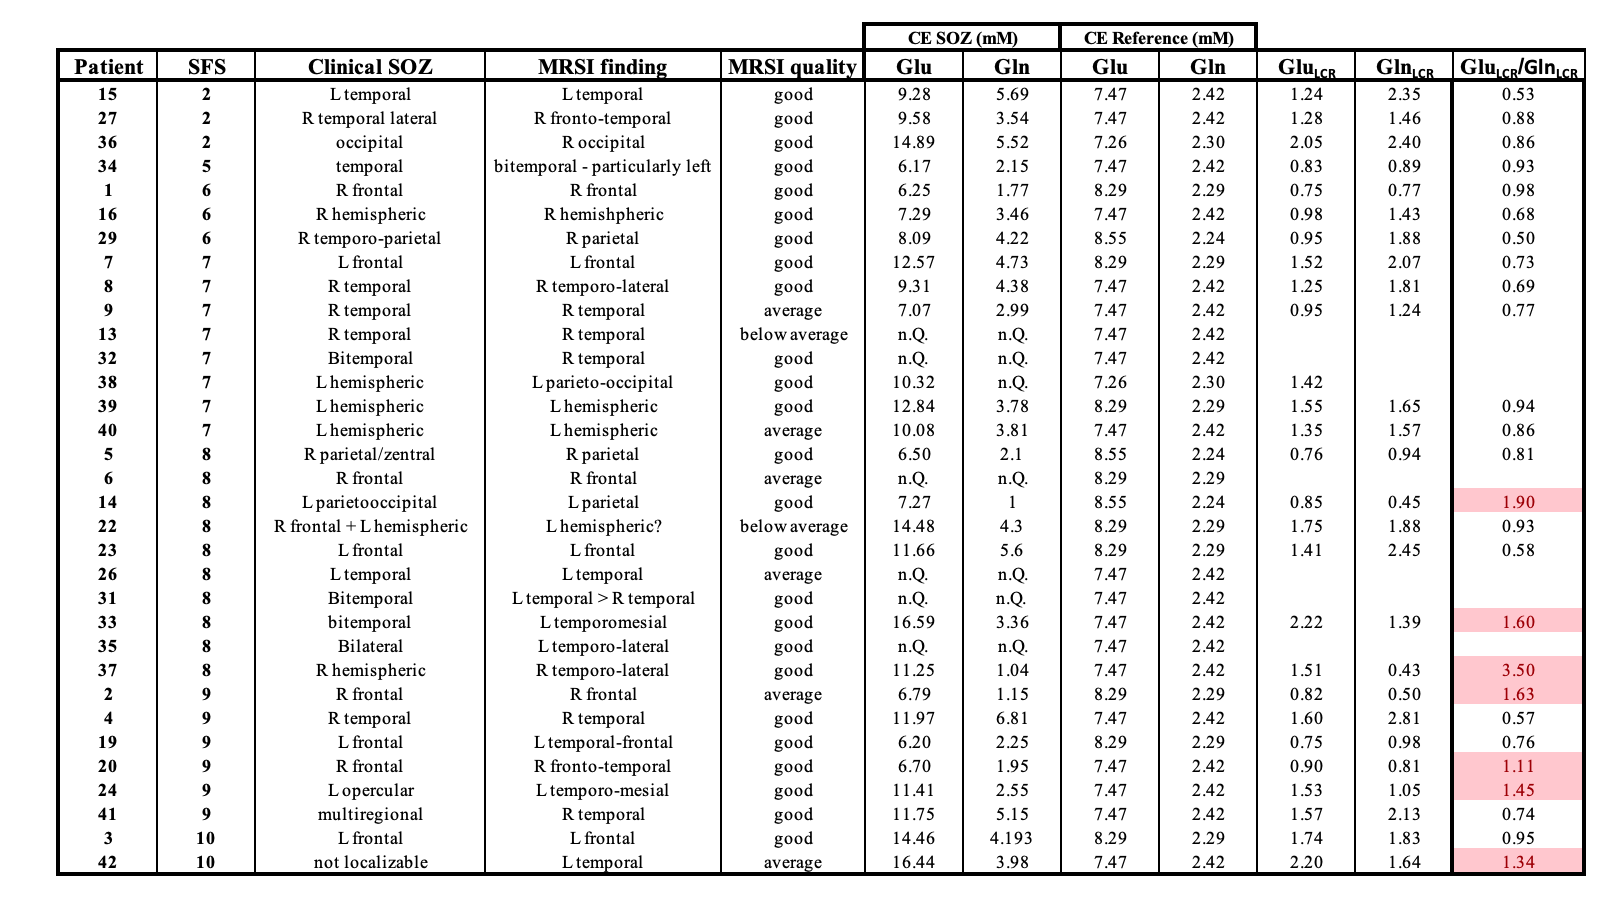
In accordance with heterogeneous findings of other groups, we could find no pattern in the metabolic profiling of ratios in relation to pathology, seizure frequency or postoperative outcome. With respect to sensitivity of diagnosing alterations in the SOZ, ratios to NAA showed changes in all patients, whereas normalization to Cr showed reduced sensitivity, yielding findings in only 32/37. Despite the heterogeneity of metabolic profiles, both ratios provided high correlation to SOZ in all patients. With respects to glutamate and glutamine, ratios of GluLCR/GlnLCR>1 indicate a higher rate of increase of glutamate over glutamine in the SOZ compared to healthy controls, whereas GluLCR/GlnLCR<1 suggest a relative rise of GlnLCR compared to GluLCR.Mostly, GlnLCR was larger than GluLCR, indicating that glutamine is upregulated in the SOZ compared to glutamate. However, taking a closer look at the distribution of the ratio GluLCR/GlnLCR, in particular in relation to seizure frequency, we observed that increases of the ratio correlated to higher Seizure Frequency Scores (SFS) as seen in Table 3.Discussion
Our findings suggest that 7T CRT-FID-MRSI shows high sensitivity in identifying metabolic alterations in focal epilepsy, even though profiling of metabolic changes remains heterogeneous. In particular, ratios normalized to NAA prove to be most sensitive in the detection of changes, potentially due to a commonly described decrease of NAA in epileptogenic pathologies(4). Furthermore, our results indicate that the glutamate/glutamine cycle may be affected by seizure frequency, with increases of Gln mostly prevalent at lower seizure frequencies, whereas high frequencies seem to correlate with increases in Glu. This relationship may prove helpful in predicting seizure frequency burden in patients suffering from seizure amnesia. However, larger cohorts and quantitative analytics are necessary to substantiate these findings. Additionally, time of last seizure prior to MRI may be a significant confounding factor that was not taken into account in the course of this study.Acknowledgements
This study was supported by the Austrian Science Fund (FWF) project KLI 1121. The financial support by the Austrian Federal Ministry for Digital and Economic Affairs, the National Foundation for Research, Technology and Development and the Christian Doppler Research Association is gratefully acknowledged.References
1. Fattorusso, A. et al. The Pharmacoresistant Epilepsy: An Overview on Existant and New Emerging Therapies. Front. Neurol. 12, 674483 (2021).
2. Hangel, G. et al. Implementation of a 7T Epilepsy Task Force consensus imaging protocol for routine presurgical epilepsy work-up: effect on diagnostic yield and lesion delineation. J. Neurol. (2023) doi:10.1007/s00415-023-11988-5.
3. Hangel, G. et al. High-resolution metabolic imaging of high-grade gliomas using 7T-CRT-FID-MRSI. NeuroImage Clin. 28, 102433 (2020).
4. Tschampa, H. J. et al. Proton magnetic resonance spectroscopy in focal cortical dysplasia at 3 T. Seizure32, 23–29 (2015).
5. Bilgic, B., Gagoski, B., Kok, T. & Adalsteinsson, E. Lipid suppression in CSI with spatial priors and highly undersampled peripheral k‐space. Magn. Reson. Med. 69, 1501–1511 (2013).
6. Hangel, G. et al. Inter‐subject stability and regional concentration estimates of 3D‐FID‐MRSI in the human brain at 7 T. NMR Biomed. 34, e4596 (2021).
7. Schäuble, B. et al. Seizure outcomes after stereotactic radiosurgery for cerebral arteriovenous malformations. Neurology63, 683–687 (2004).
Figures