3215
High Contrast MRI of the Prostate Using Divided Reverse Subtracted Inversion Recovery (drSIR) Sequences1Division of Medical Physics in Radiology, German Cancer Research Center (DKFZ), Heidelberg, Germany, 2Faculty of Physics and Astronomy, Heidelberg University, Heidelberg, Germany, 3Division of Radiology, German Cancer Research Center (DKFZ), Heidelberg, Germany, 4Department of Radiology, University of California San Diego, San Diego, CA, United States
Synopsis
Keywords: Novel Contrast Mechanisms, Prostate, Inversion Recovery
Motivation: Divided reverse Subtracted Inversion Recovery (drSIR) has shown potential for brain MRI but has not yet been applied to the prostate.
Goal(s): To produce prostate images with high $$$T_1$$$ contrast and highlight the junction between the peripheral and transitional zones by using two IR-TSE images with different inversion times (TIs).
Approach: In healthy volunteers, the TIs that suppressed the peripheral and transitional zones as well as the tissue junction were determined, and the corresponding images were subtracted and divided pixelwise.
Results: High $$$T_1$$$ contrast between the prostate zones was achieved without contrast agents and subtle $$$T_1$$$ heterogeneities were observed.
Impact: High $$$T_1$$$ contrast with obvious distinction between the peripheral and the transitional zones of the prostate was achieved without contrast agents. The approach is likely to show lesions with high contrast and may improve the detection and delineation of tumors.
Introduction
Divided reverse Subtracted Inversion Recovery (drSIR) is a new MR technique developed as part of the Inversion Recovery (IR) based MASDIR (Multiplied, Added, Subtracted and/or Divided Inversion Recovery) approach$$$^1$$$. It can be used to significantly increase the $$$T_1$$$ contrast in particular domains of $$$T_1$$$ values. While this has previously been applied to brain MRI, this project has adapted the approach for MRI of the prostate. The aim is to produce high contrast between the peripheral zone (PZ) and the transitional zone (TZ) and show a high signal boundary between the PZ and TZ in normal volunteer prostate images.Methods
A routine Turbo Spin Echo (TSE) sequence was used with an added inversion pulse. Two different inversion times (TIs), $$$\text{TI}_1$$$ (longer TI) and $$$\text{TI}_2$$$ (shorter TI), were used. The two IR-TSE images were then subtracted pixelwise and normalized by their sum:
$$S_{\text{drSIR}}(T_1)=\frac{S_1(T_1)-S_2(T_1)}{S_1(T_1)+S_2(T_1)}\hspace{3cm}(1)$$
The expected signal $$$S_i(T_1)$$$ in each of the IR images is described by the signal equation:
$$S_i(T_1)=S_0(1-2e^{-\frac{\text{TI}_i}{\text{T1}}}+e^{-\frac{\text{TR}}{T_1}})\hspace{2.63cm}(2)$$
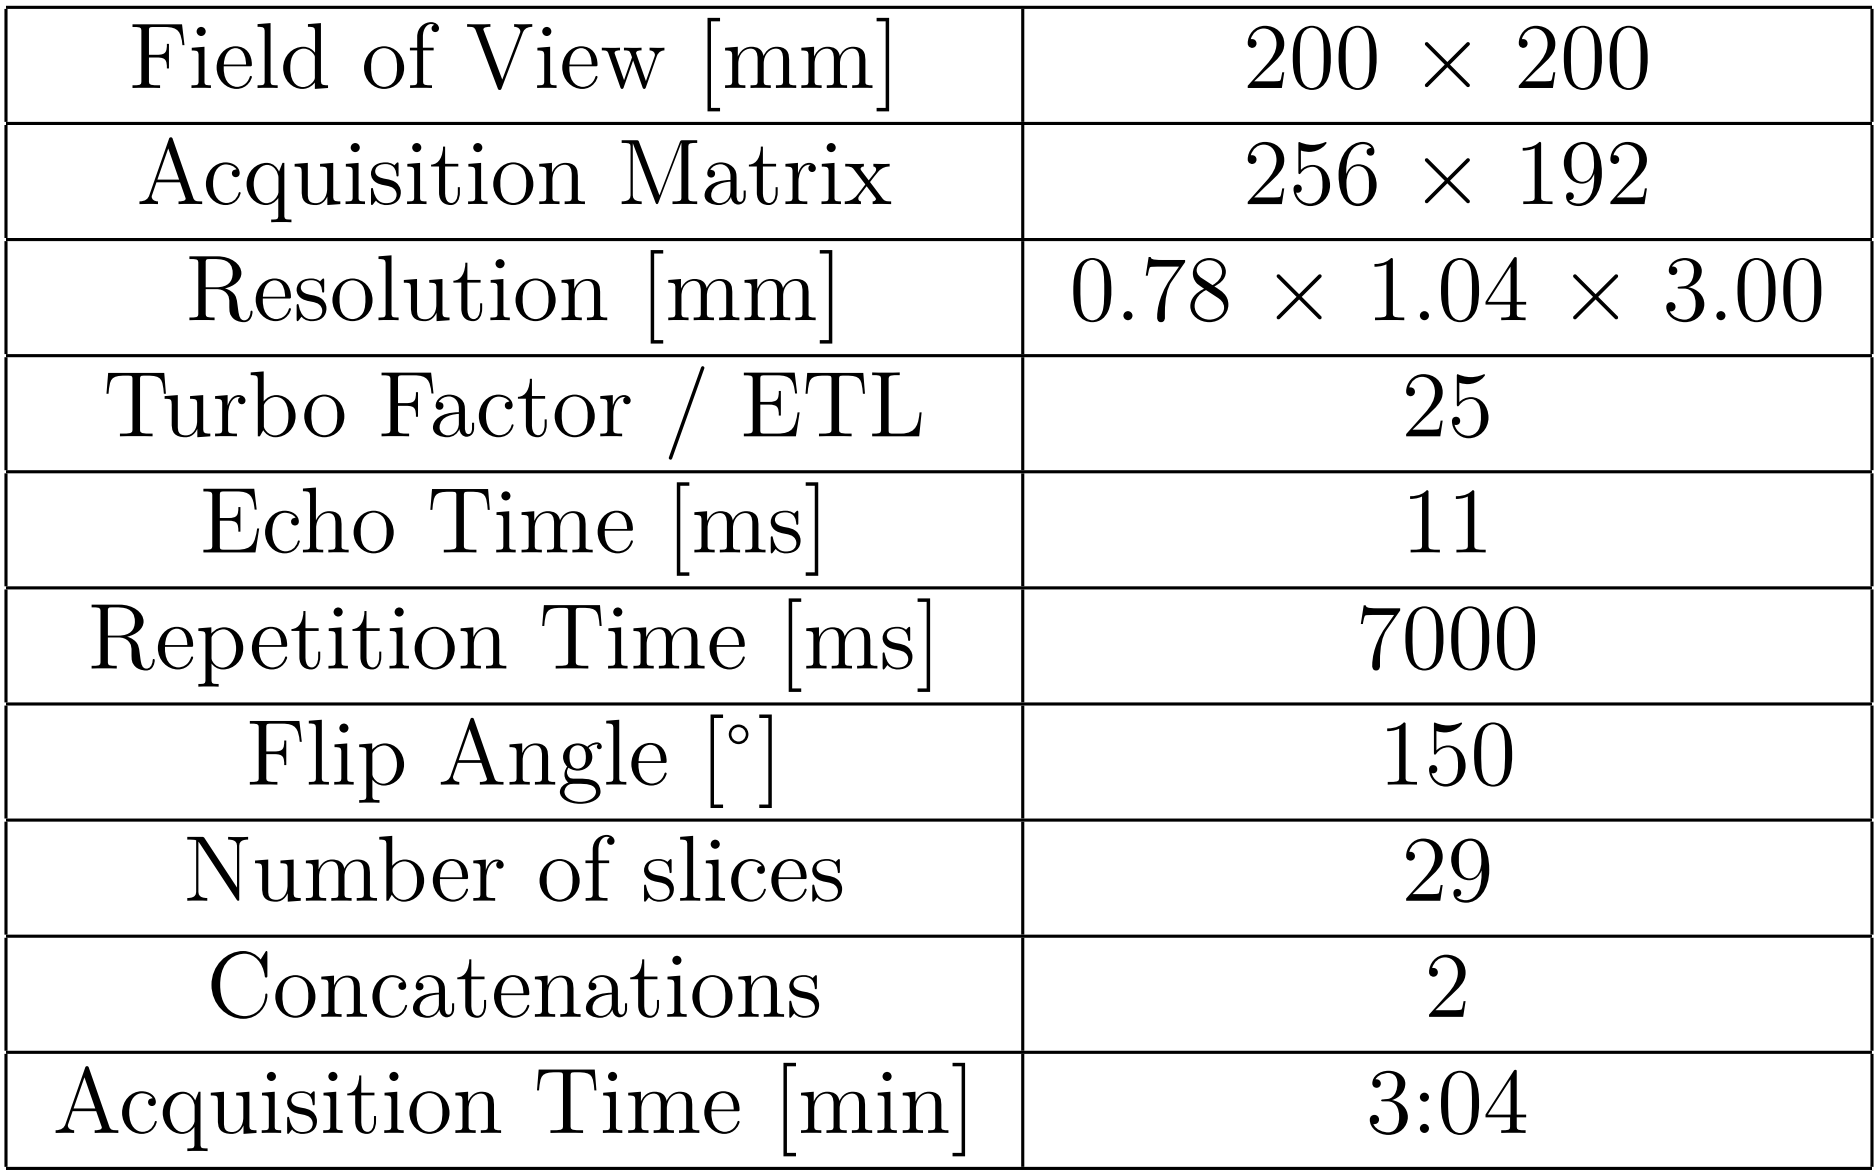
The signal in the resulting drSIR images depends almost entirely on $$$T_1$$$. The influence of $$$T_2$$$ and proton density is largely removed by the normalization shown in Eq. 1. The expected $$$T_1$$$ dependence is shown in Figure 1. Maximum contrast is produced for $$$T_1\text{s}$$$ between the two $$$T_1\text{s}$$$ that are nulled in the individual IR-TSE images. In addition to the high $$$T_1$$$ contrast in the $$$T_1$$$ domain between the two nulled $$$T_1\text{s}$$$, highlighting the junction between two tissues is possible if one of the TIs is chosen to suppress signal at a $$$T_1$$$ between those of the two adjacent tissues. This has been successfully used to produce high signal boundaries between white and gray matter in the brain$$$^1$$$ and is here used to produce a high signal boundary between the PZ and the TZ. The TIs were optimized in four healthy volunteers within an IRB approved study. The TIs that effectively suppressed the PZ and TZ were found, as well as the TI to suppress mixed tissue voxels at the junction between PZ and TZ. The measurements were conducted on two 3 T MRI systems (Siemens Magnetom Vida and Prisma), and each sequence lasted 3:04 min; a drSIR dataset can thus be acquired in 6:08 min. No contrast agent was used and the data shown here was acquired from a healthy volunteer aged 50.
Results
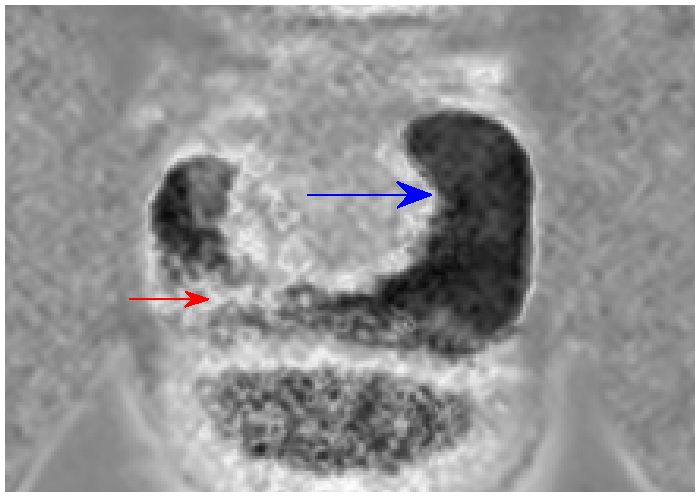
The PZ was most effectively suppressed with a TI of about 1200 ms corresponding, as follows from Eq. 2, to a $$$T_1$$$ of about 1780 ms. In the TZ, optimal suppression was achieved with a TI of around 750 ms corresponding to a $$$T_1$$$ of about 1090 ms. It was possible to suppress the mixed tissue at the junction between the PZ and the TZ with a TI of about 900 ms. Images corresponding to each of these three TIs can be found in Figure 2 (top row and bottom left). The drSIR images, which were calculated with $$$\text{TI}_1 = 1200$$$ ms (suppresses the PZ) and either $$$\text{TI}_2=750$$$ ms (suppresses the TZ) or $$$\text{TI}_2=900$$$ ms (suppresses mixed tissue at the PZ/TZ junction) are shown in Figures 3 and 4, respectively. Figure 3 shows very high contrast between the PZ and TZ. In Figure 4, the tissue junction is partially highlighted with a white line. A $$$T_1$$$ reduction in the lower right PZ is displayed with increased signal, such that the extent of the lower right PZ is not well delineated.Discussion
These volunteer measurements have shown that it is possible to produce high contrast in the prostate using the drSIR imaging approach. The PZ and TZ signals can be well suppressed, and the shorter $$$T_1$$$ in the TZ compared to the PZ produces very high contrast. Possible explanations for the observed $$$T_1$$$ reduction in the right PZ may be post-inflammatory change. There is also physiological asymmetry. As PCa lesions in the PZ have a shorter $$$T_1$$$ than normal$$$^{2,3}$$$, it is expected that they would be visible with high contrast as well, depending on the choice of $$$\text{TI}_2$$$ and the magnitude of the decrease in $$$T_1$$$. Unlike other $$$T_1$$$-weighted sequences for the prostate, this technique does not require the use of contrast agents.Conclusion
The success of the volunteer imaging shown here suggests that drSIR images have the potential to display prostate lesions in the PZ with high $$$T_1$$$ contrast without the use of intravenous contrast agents. This may be a high-resolution complement to diffusion-weighted imaging as well as to conventional $$$T_2$$$ weighting. Patient studies are planned in the near future to assess the diagnostic potential of this technique..
Acknowledgements
No acknowledgement found.References
- Ma YJ, Moazamian D, Cornfeld DM, Condron P, Holdsworth SJ, Bydder M, Du J, Bydder GM. Improving the understanding and performance of clinical MRI using tissue property filters and the central contrast theorem, MASDIR pulse sequences and synergistic contrast MRI. Quant Imaging Med Surg. 2022 Sep;12(9):4658-4690. doi: 10.21037/qims-22-394. PMID: 36060593; PMCID: PMC9403590.
- Baur, A.D.J., Hansen, C.M., Rogasch, J. et al. Evaluation of T1 relaxation time in prostate cancer and benign prostate tissue using a Modified Look-Locker inversion recovery sequence. Sci Rep 10, 3121 (2020). https://doi.org/10.1038/s41598-020-59942-z
- Al-Bourini O, Seif Amir Hosseini A, Giganti F, Balz J, Heitz LG, Voit D, Lotz J, Trojan L, Frahm J, Uhlig A, Uhlig J. T1 Mapping of the Prostate Using Single-Shot T1FLASH: A Clinical Feasibility Study to Optimize Prostate Cancer Assessment. Invest Radiol. 2023 Jun 1;58(6):380-387. doi: 10.1097/RLI.0000000000000945. Epub 2022 Dec 13. PMID: 36729865.
Figures
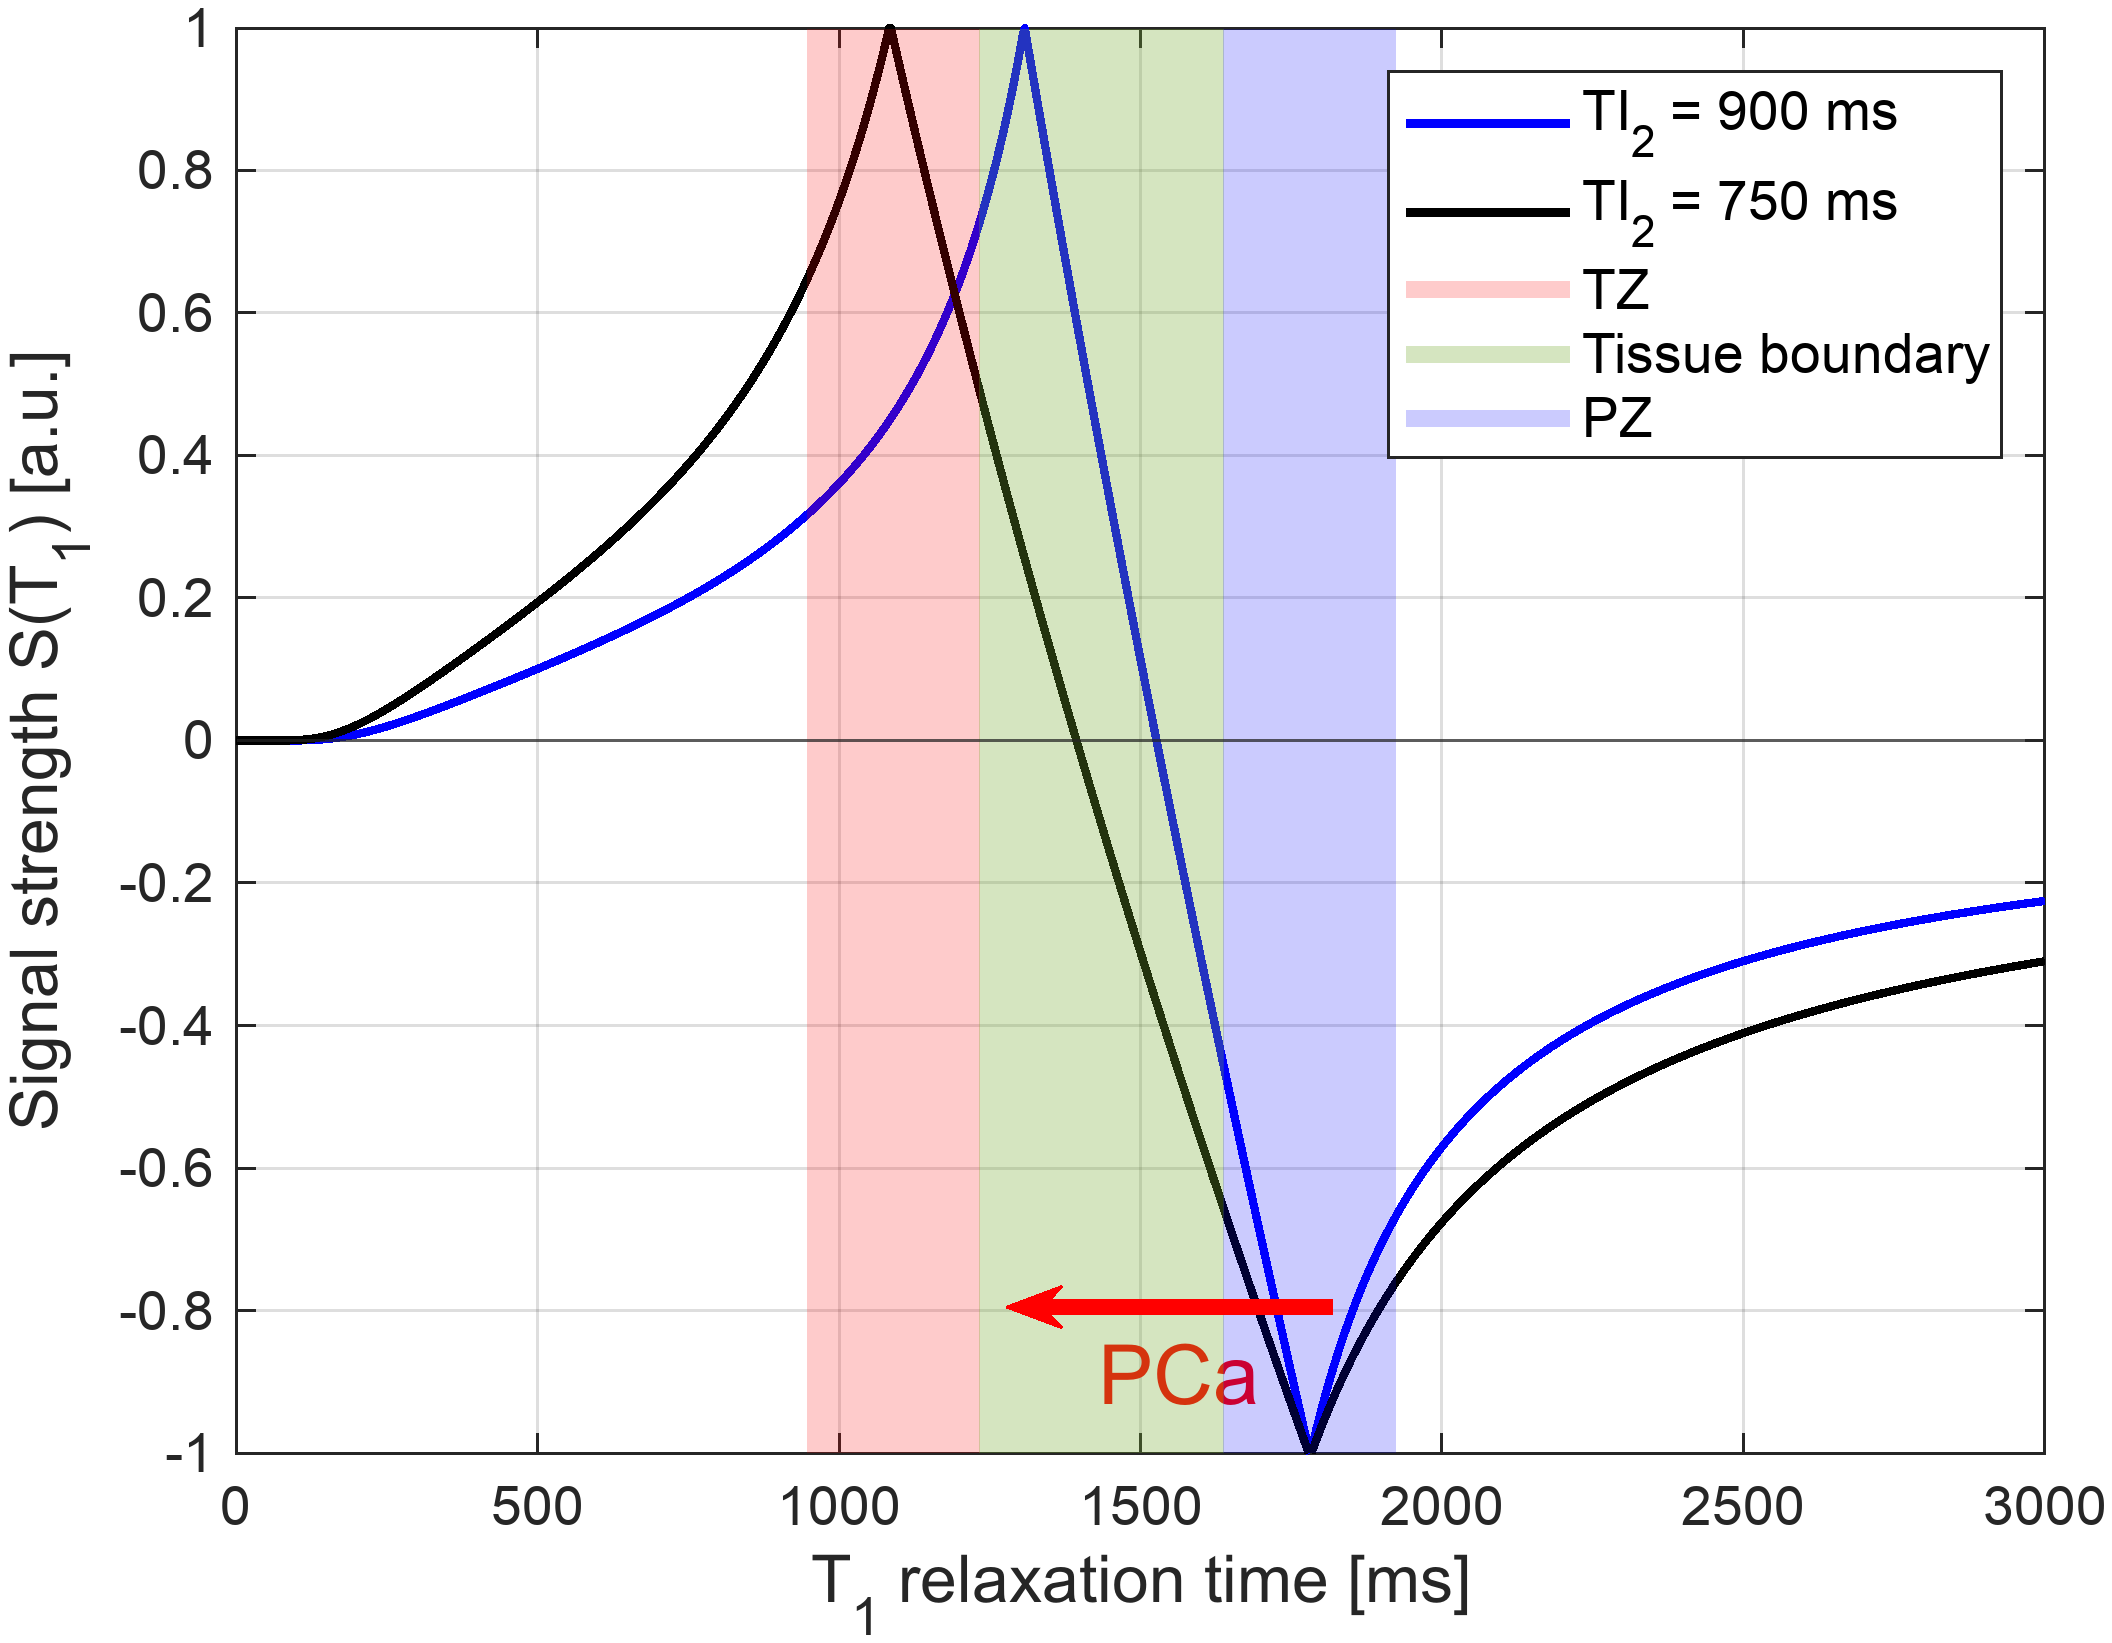
Figure 1: Expected signal strength for a drSIR image with $$$\text{TI}_1=1200$$$ ms and $$$\text{TI}_2=900$$$ ms (blue) or $$$\text{TI}_1=1200$$$ ms and $$$\text{TI}_2=750$$$ ms (black) as a function of $$$T_1$$$. High contrast is expected at the tissue junction between the TZ and the PZ. The red arrow demonstrates that PCa lesions in the PZ have a reduced $$$T_1$$$$$$^{2,3}$$$ and should be observable with high contrast.
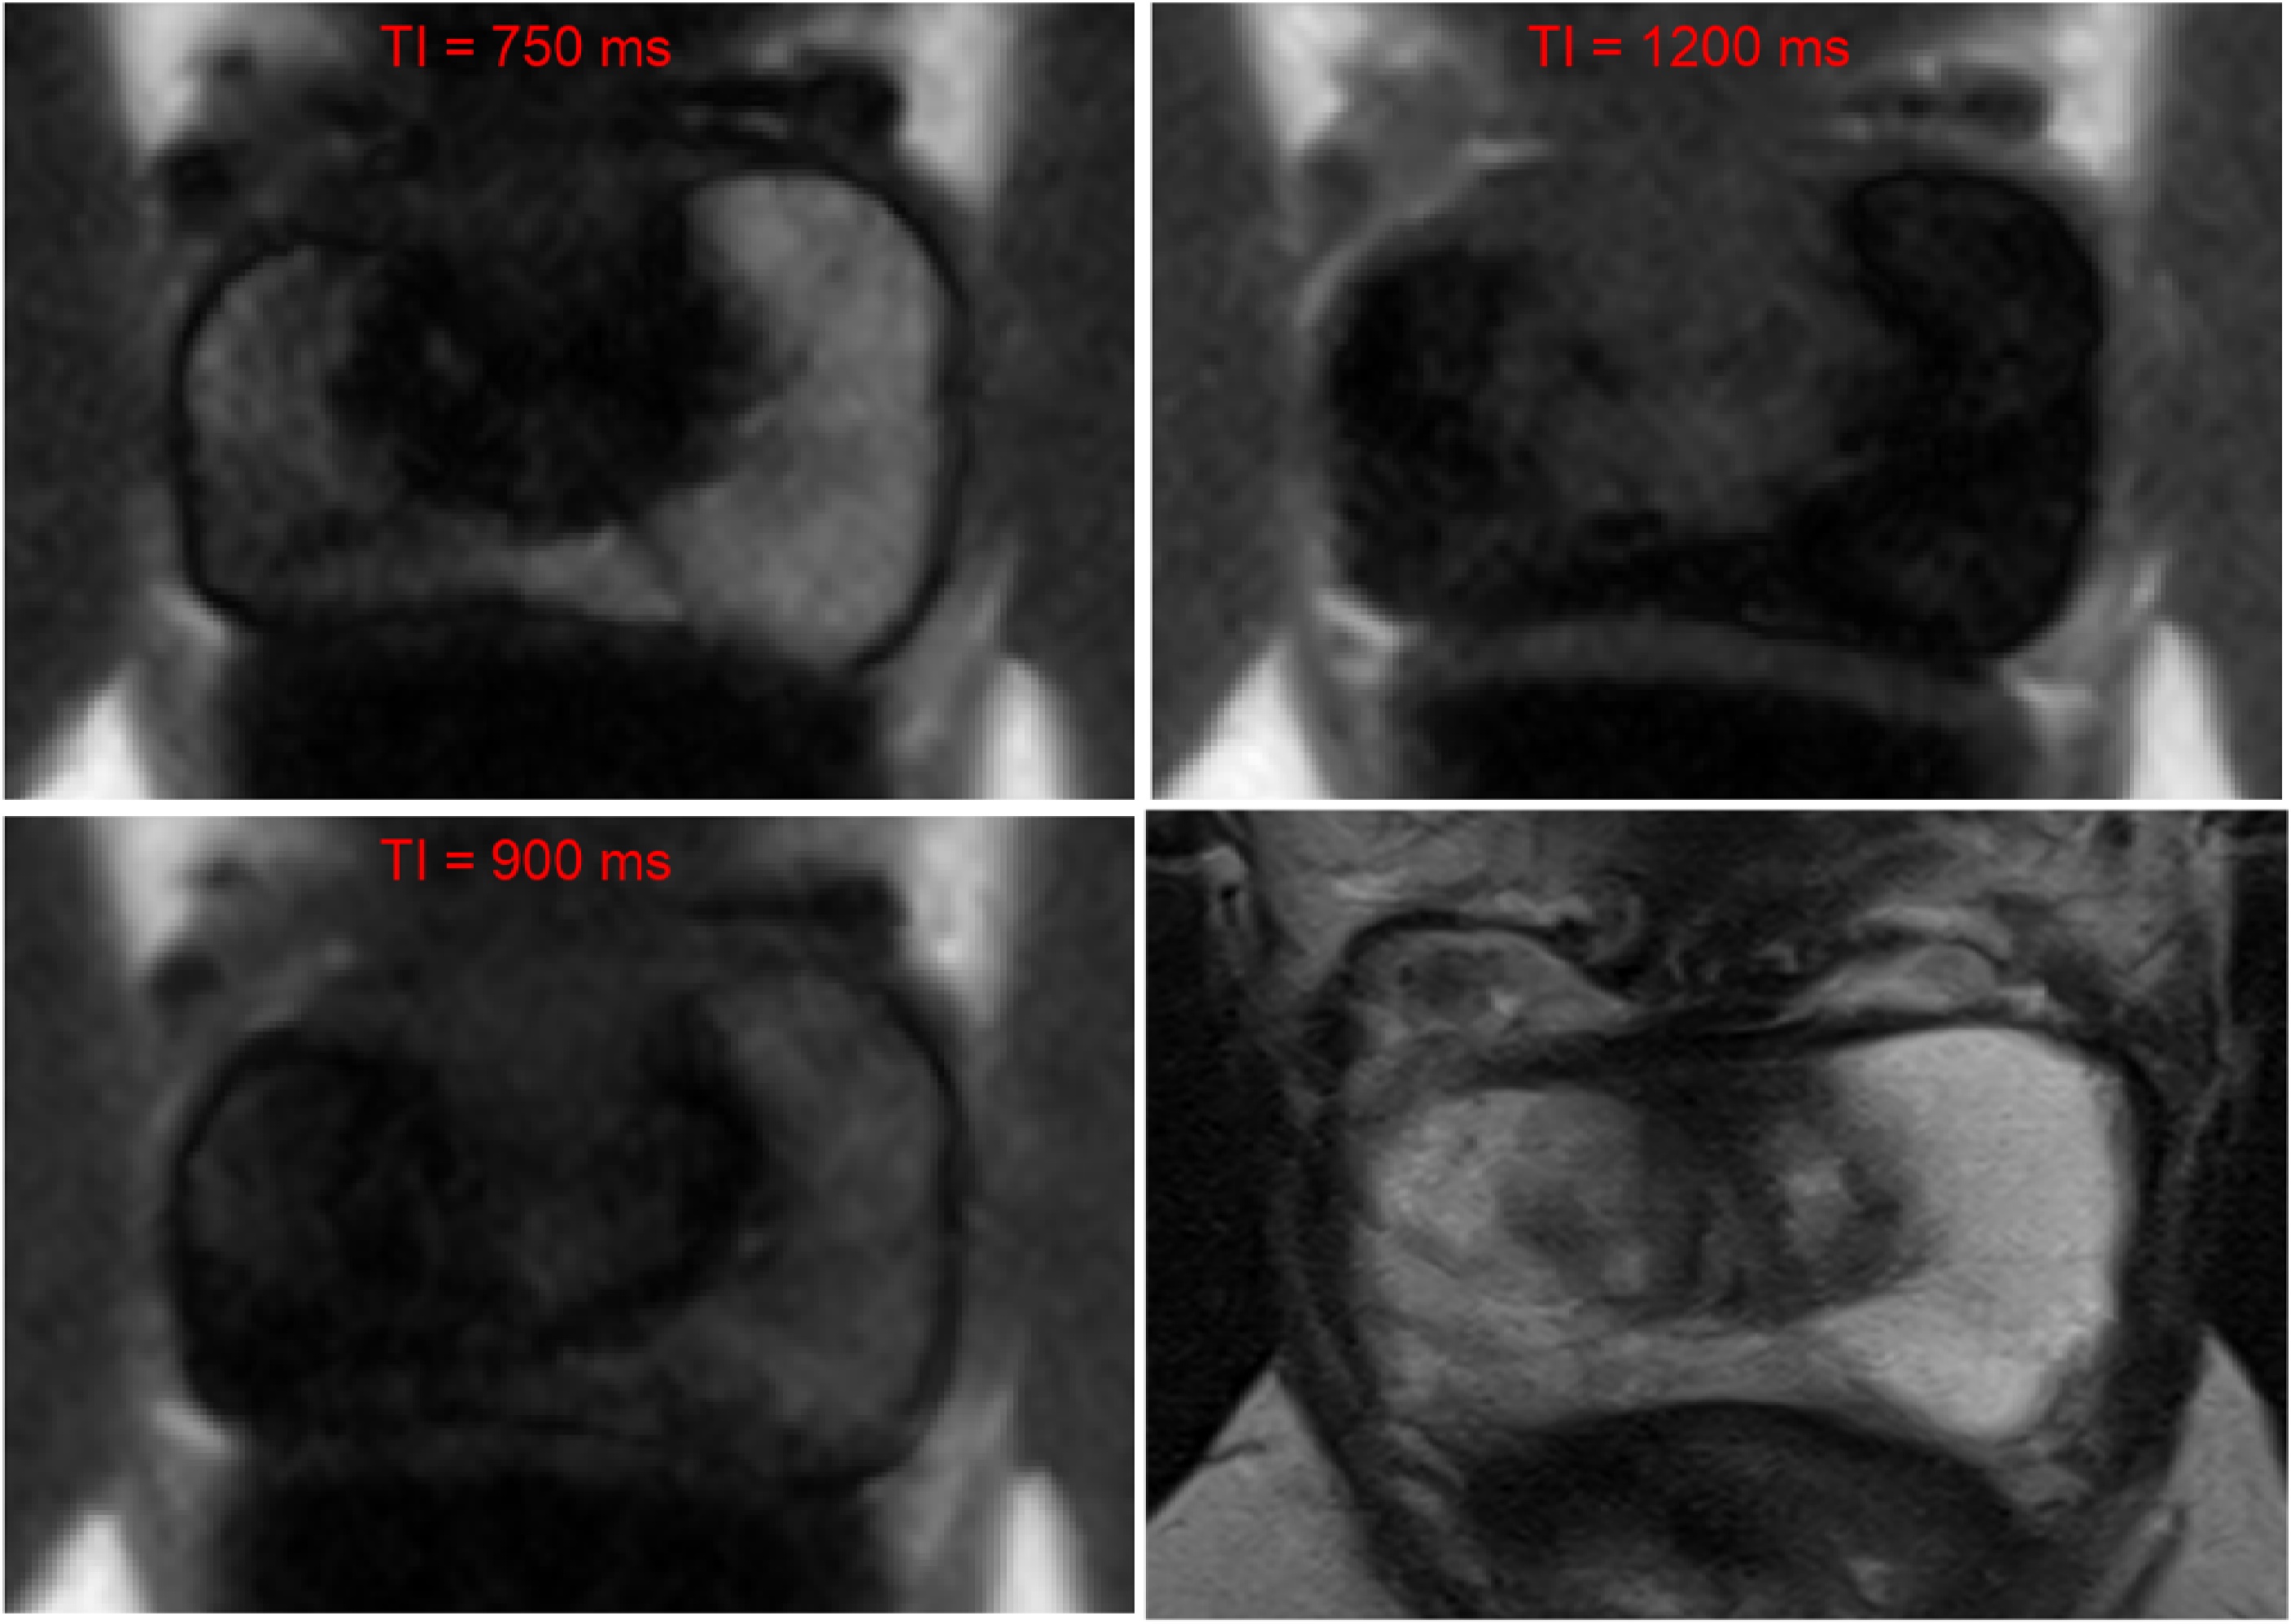
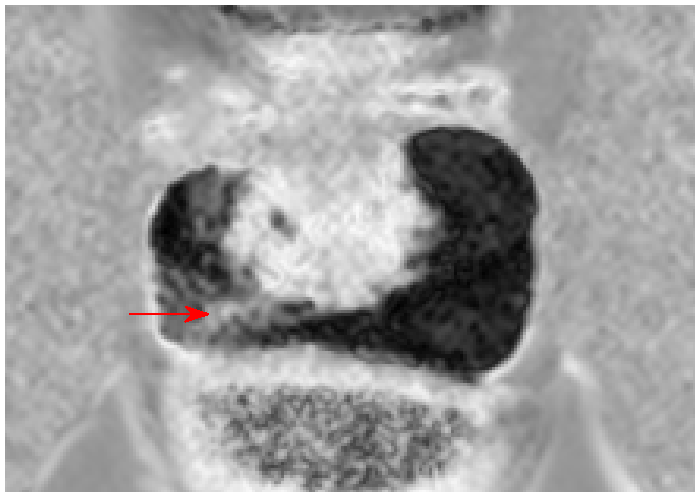
Figure 3: drSIR image of the prostate in a healthy volunteer with $$$\text{TI}_1=1200$$$ ms and $$$\text{TI}_2=750$$$ ms. The TZ shows very high signal while the PZ has mostly low signal (dark). The areas with increased signal in the right PZ (pointed to by the red arrow) correspond to a reduction in $$$T_1$$$.