3211
Biophysical models on multi-parametric maps reveal brain tissue changes in molecular environments of iron and myelin in multiple sclerosis at 3T1Experimental and Clinical Research Center, Max Delbrück Center for Molecular Medicine and Charité – Universitätsmedizin Berlin, corporate member of Freie Universität Berlin and Humboldt-Universität zu Berlin, Berlin, Germany, 2The Edmond and Lily Safra Center for Brain Sciences, The Hebrew University of Jerusalem, Jerusalem, Israel, 3Neuroscience Clinical Research Center, Charité – Universitätsmedizin Berlin, corporate member of Freie Universität Berlin and Humboldt-Universität zu Berlin, Berlin, Germany, 4Berlin Institute of Health at Charité – Universitätsmedizin Berlin, Biomedical Innovation Academy, Berlin, Germany, 5Department of Psychiatry and Neurosciences, Charité – Universitätsmedizin Berlin, corporate member of Freie Universität Berlin and Humboldt-Universität zu Berlin, and Berlin Institute of Health, Berlin, Germany, 6Berlin Center for Advanced Neuroimaging, Charité – Universitätsmedizin Berlin, corporate member of Freie Universität Berlin, Humboldt-Universität zu Berlin, and Berlin Institute of Health, Berlin, Germany, 7Department of Neurology, Charité – Universitätsmedizin Berlin, corporate member of Freie Universität Berlin and Humboldt-Universität zu Berlin, Berlin, Germany
Synopsis
Keywords: Biomarkers, Quantitative Imaging, brain, quantitative MRI, biophysical model
Motivation: Quantitative MRI is attractive for investigating pathological tissue changes, yet translation towards clinical research remains challenging.
Goal(s): Our goal was to explore sensitivity of a fast quantitative multi-parametric mapping protocol combined with biophysical models at 3T to multiple sclerosis subtypes.
Approach: We combined quantitative maps of magnetization transfer saturation, proton density, longitudinal and transverse relaxation rates with relaxivity approaches to disentangle water and macromolecular tissue driven changes and to identify MRI biomarkers of focal and diffuse demyelination or inflammation.
Results: We found significant alterations in white matter and lesions of surrogates for myelin and iron compared to controls and worsening with disease severity.
Impact: A fast quantitative multi-parameter mapping protocol combined with biophysical models based on in vivo relaxivity approaches in multiple sclerosis at 3T is sensitive to brain tissue alterations in patients, suggesting disease-specific demyelination and inflammation. An association with disability suggests disease-relevance.
Introduction
Quantitative magnetic resonance imaging (qMRI) involves mapping microstructure in standardized units sensitive to tissue properties such as myelin, iron or water content. Yet in the context of pathology, qMRI changes typically reflect mixed influences from aging or pre-clinical degeneration unspecific to a biological property or disease. We previously adapted a 7-minute multi-parameter mapping (MPM) protocol1,2 with multi-echo fast low angle shot acquisitions at 3T to reconstruct whole-brain quantitative maps of magnetization transfer saturation (MT), proton density (PD), longitudinal (R1), and transverse relaxation rate (R2*) with 1.6 mm isotropic resolution (Figure 1). Here we apply biophysical models based on two recently described in vivo relaxivity approaches: i) tissue relaxivity sensitive to lipid forms calculated as the linear dependency of qMRI parameters to the non-water tissue fraction, i.e., 1-PD = Macromolecular Tissue Volume (MTV)3. MTV is a surrogate for myelin volume fraction and has shown sensitivity to multiple sclerosis (MS)3,4. This Multi-linear Dependency on MTV termed in short MDM5 can predict composition of lipids mixtures; ii) the iron relaxivity sensitive to iron forms, defined as the linear interdependency of R1 and R2* termed r1-r2* relaxivity6, reveals the paramagnetic properties of distinct iron compounds, enabling separation between meningioma and non-tumor tissue. Our cross-sectional study aims to investigate microstructural differences in brain tissues between MS patients and healthy controls (HC) to identify potential biomarkers of inflammation or demyelination in MS.Methods
Seventy-five MS patients were scanned at 3T (58 females, age 41.4±12.8 years [mean±SD]), including 34 relapsing-remitting MS (RRMS), 17 secondary progressive MS (SPMS), 24 clinically isolated syndrome (CIS) patients and 75 HC (58 females, 41.2±13.6y, age-sex matched). All participants underwent MPM with Gibbs ringing correction7 and bias field correction8. Using the hMRI toolbox9, quantitative maps of PD, MT, R1, R2∗ were reconstructed given the PD-weighted (PDw), MTw and T1w echoes. MTV maps estimating non-water fraction were computed from PD normalized against cerebrospinal fluid. The protocol included acquisition of T1-MPRAGE and T2-FLAIR images at 0.8 mm isotropic resolution for brain tissue segmentation: T1w images were segmented via FastSurfer10,11 and lesion masks were manually delineated from T2-FLAIR hyperintensities. Median values were extracted from normal appearing white matter (WM), cortical grey matter (CGM) and lesions. Derivatives of parameters to MTV and r1-r2* were calculated from the slopes of the linear fits in each region of interest (ROI). Analysis of variance (ANOVA) and linear regression models were used to evaluate effect sizes between the 3 disease groups and HC, as well as parameter association to clinical disability measured by the expanded disability status scale (EDSS).Results and Discussion
Group comparison across ROIs along 95% confidence intervals are shown in figure 2. Figure 3 details pairwise comparison of group median and respective effect sizes in WM.There is a significant increasing trend in PD (F>9.6, p<0.001) across ROIs (Figure 2a), exacerbated by disease severity suggesting accumulating water and edema. Additionally, reduction in both MT (F= 22, p<0.001) and R1 (F=14.6, p<0.001) were observed in WM which could be related to predominant myelin loss. Lower MT (F=13.9, p<0.001), R1 (F=15.9, p<0.001) and R2*(F=16.3, p<0.001) along increased PD (F=15.7, p<0.001) discriminate MS lesions and point to salient demyelination and edema. Derivatives disentangle tissue environment alterations in iron forms (r1-r2*) and lipids (dMT, dR1, dR2*) from water content changes. The latter may drive MPM differences while MDM inform about structural tissue changes comparing CIS and RRMS to SPMS (Figures 2b and 3). A difference between CIS compared to HC and SPMS was seen in r1-r2* (F= 4.7, p=0.001). This sensitivity to iron homeostasis alterations might be indicative of acute inflammation, whereas R2* in WM may be occulted by bidirectional contributions of myelin, iron and water. MDM demonstrate variations in dMT, dR1 indicating differences in molecular composition in WM (F(dR1)=8.4, p<0.001) and lesions (F(dMT)=6.9, F(dR1)=4.1, p<0.01) between MS subtypes. Co-variations of surrogates for myelin and iron in WM may mirror loss of iron from damaged oligodendrocytes and degeneration of WM fibers. Parameters significantly associated with EDSS (Table 1) relate clinical disability to T1-lesional (e.g. black holes) and diffuse WM damage (inflammatory and demyelinating). Normal appearing tissue differences between groups appear weaker than in lesions, as partial volume effects or regional heterogeneity could limit sensitivity, encouraging tractography or voxel-based quantification.Conclusion
Alterations in MPM and relaxivities suggest tissue microstructural differences between MS subtypes linked to demyelination or inflammation. While qMRI maps inform about the magnitude of microstructural changes, MDM and r1-r2* provide increased sensitivity to alterations of the chemical environment surrounding the tissue. An association with disease-related disability in MS warrants further exploration of biophysical models using MPM-extracted metrics.Acknowledgements
HT was supported by iNAMES - MDC - Weizmann - Helmholtz International Research School for Imaging and Data Science from NAno to MESo
References
1. Cooper G, Hirsch S, Scheel M, Brandt AU, Paul F, Finke C, et al. Quantitative Multi-Parameter Mapping Optimized for the Clinical Routine. Front Neurosci. 2020;14:611194.
2. Weiskopf N, Suckling J, Williams G, Correia MM, Inkster B, Tait R, et al. Quantitative multi-parameter mapping of R1, PD(*), MT, and R2(*) at 3T: a multi-center validation. Front Neurosci. 2013;7:95.
3. Mezer A, Yeatman JD, Stikov N, Kay KN, Cho NJ, Dougherty RF, et al. Quantifying the local tissue volume and composition in individual brains with magnetic resonance imaging. Nat Med. 2013;19(12):1667-72.
4. Berman S, Backner Y, Krupnik R, Paul F, Petrou P, Karussis D, et al. Conduction delays in the visual pathways of progressive multiple sclerosis patients covary with brain structure. Neuroimage. 2020;221:117204.
5. Filo S, Shtangel O, Salamon N, Kol A, Weisinger B, Shifman S, et al. Disentangling molecular alterations from water-content changes in the aging human brain using quantitative MRI. Nat Commun. 2019;10(1):3403.
6. Filo S, Shaharabani R, Bar Hanin D, Adam M, Ben-David E, Schoffman H, et al. Non-invasive assessment of normal and impaired iron homeostasis in the brain. Nat Commun. 2023;14(1):5467.
7. Kellner E, Dhital B, Kiselev VG, Reisert M. Gibbs-ringing artifact removal based on local subvoxel-shifts. Magn Reson Med. 2016;76(5):1574-81.
8. Lutti A, Hutton C, Finsterbusch J, Helms G, Weiskopf N. Optimization and validation of methods for mapping of the radiofrequency transmit field at 3T. Magn Reson Med. 2010;64(1):229-38.
9. Tabelow K, Balteau E, Ashburner J, Callaghan MF, Draganski B, Helms G, et al. hMRI - A toolbox for quantitative MRI in neuroscience and clinical research. Neuroimage. 2019;194:191-210.
10. Henschel L, Conjeti S, Estrada S, Diers K, Fischl B, Reuter M. FastSurfer - A fast and accurate deep learning based neuroimaging pipeline. Neuroimage. 2020;219:117012.
11. Henschel L, Kügler D, Reuter M. FastSurferVINN: Building resolution-independence into deep learning segmentation methods-A solution for HighRes brain MRI. Neuroimage. 2022;251:118933.
Figures
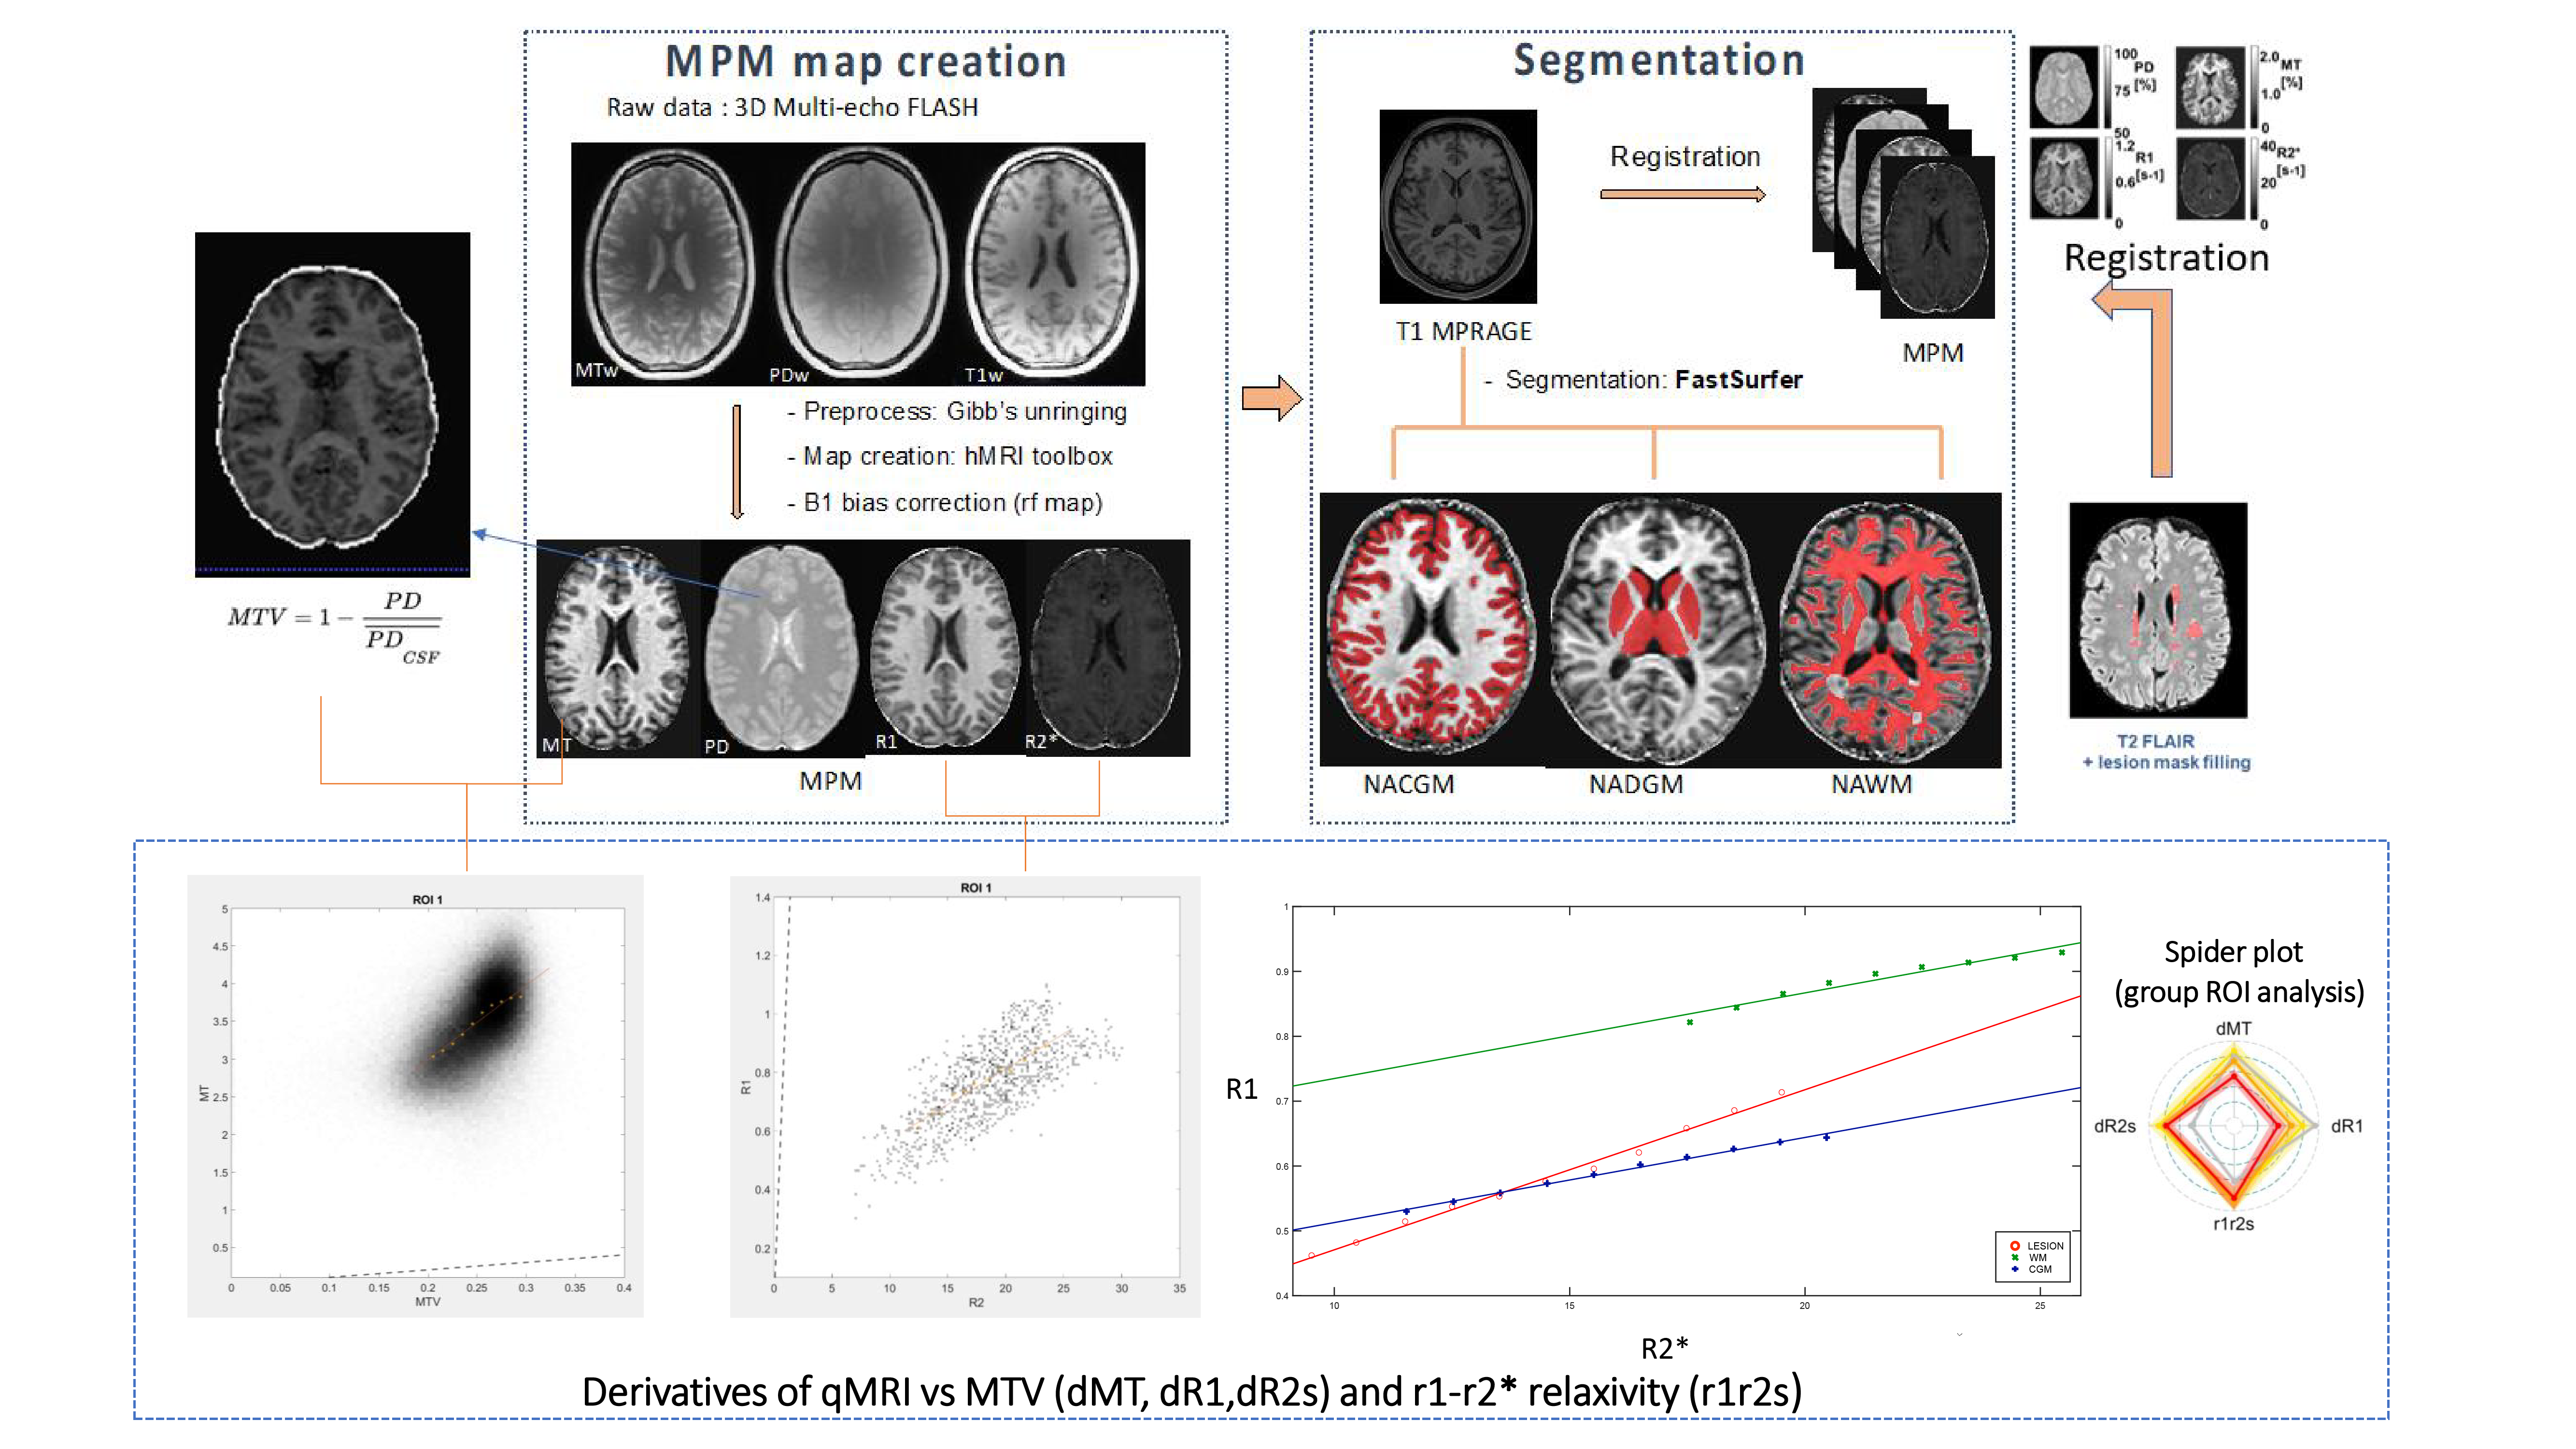
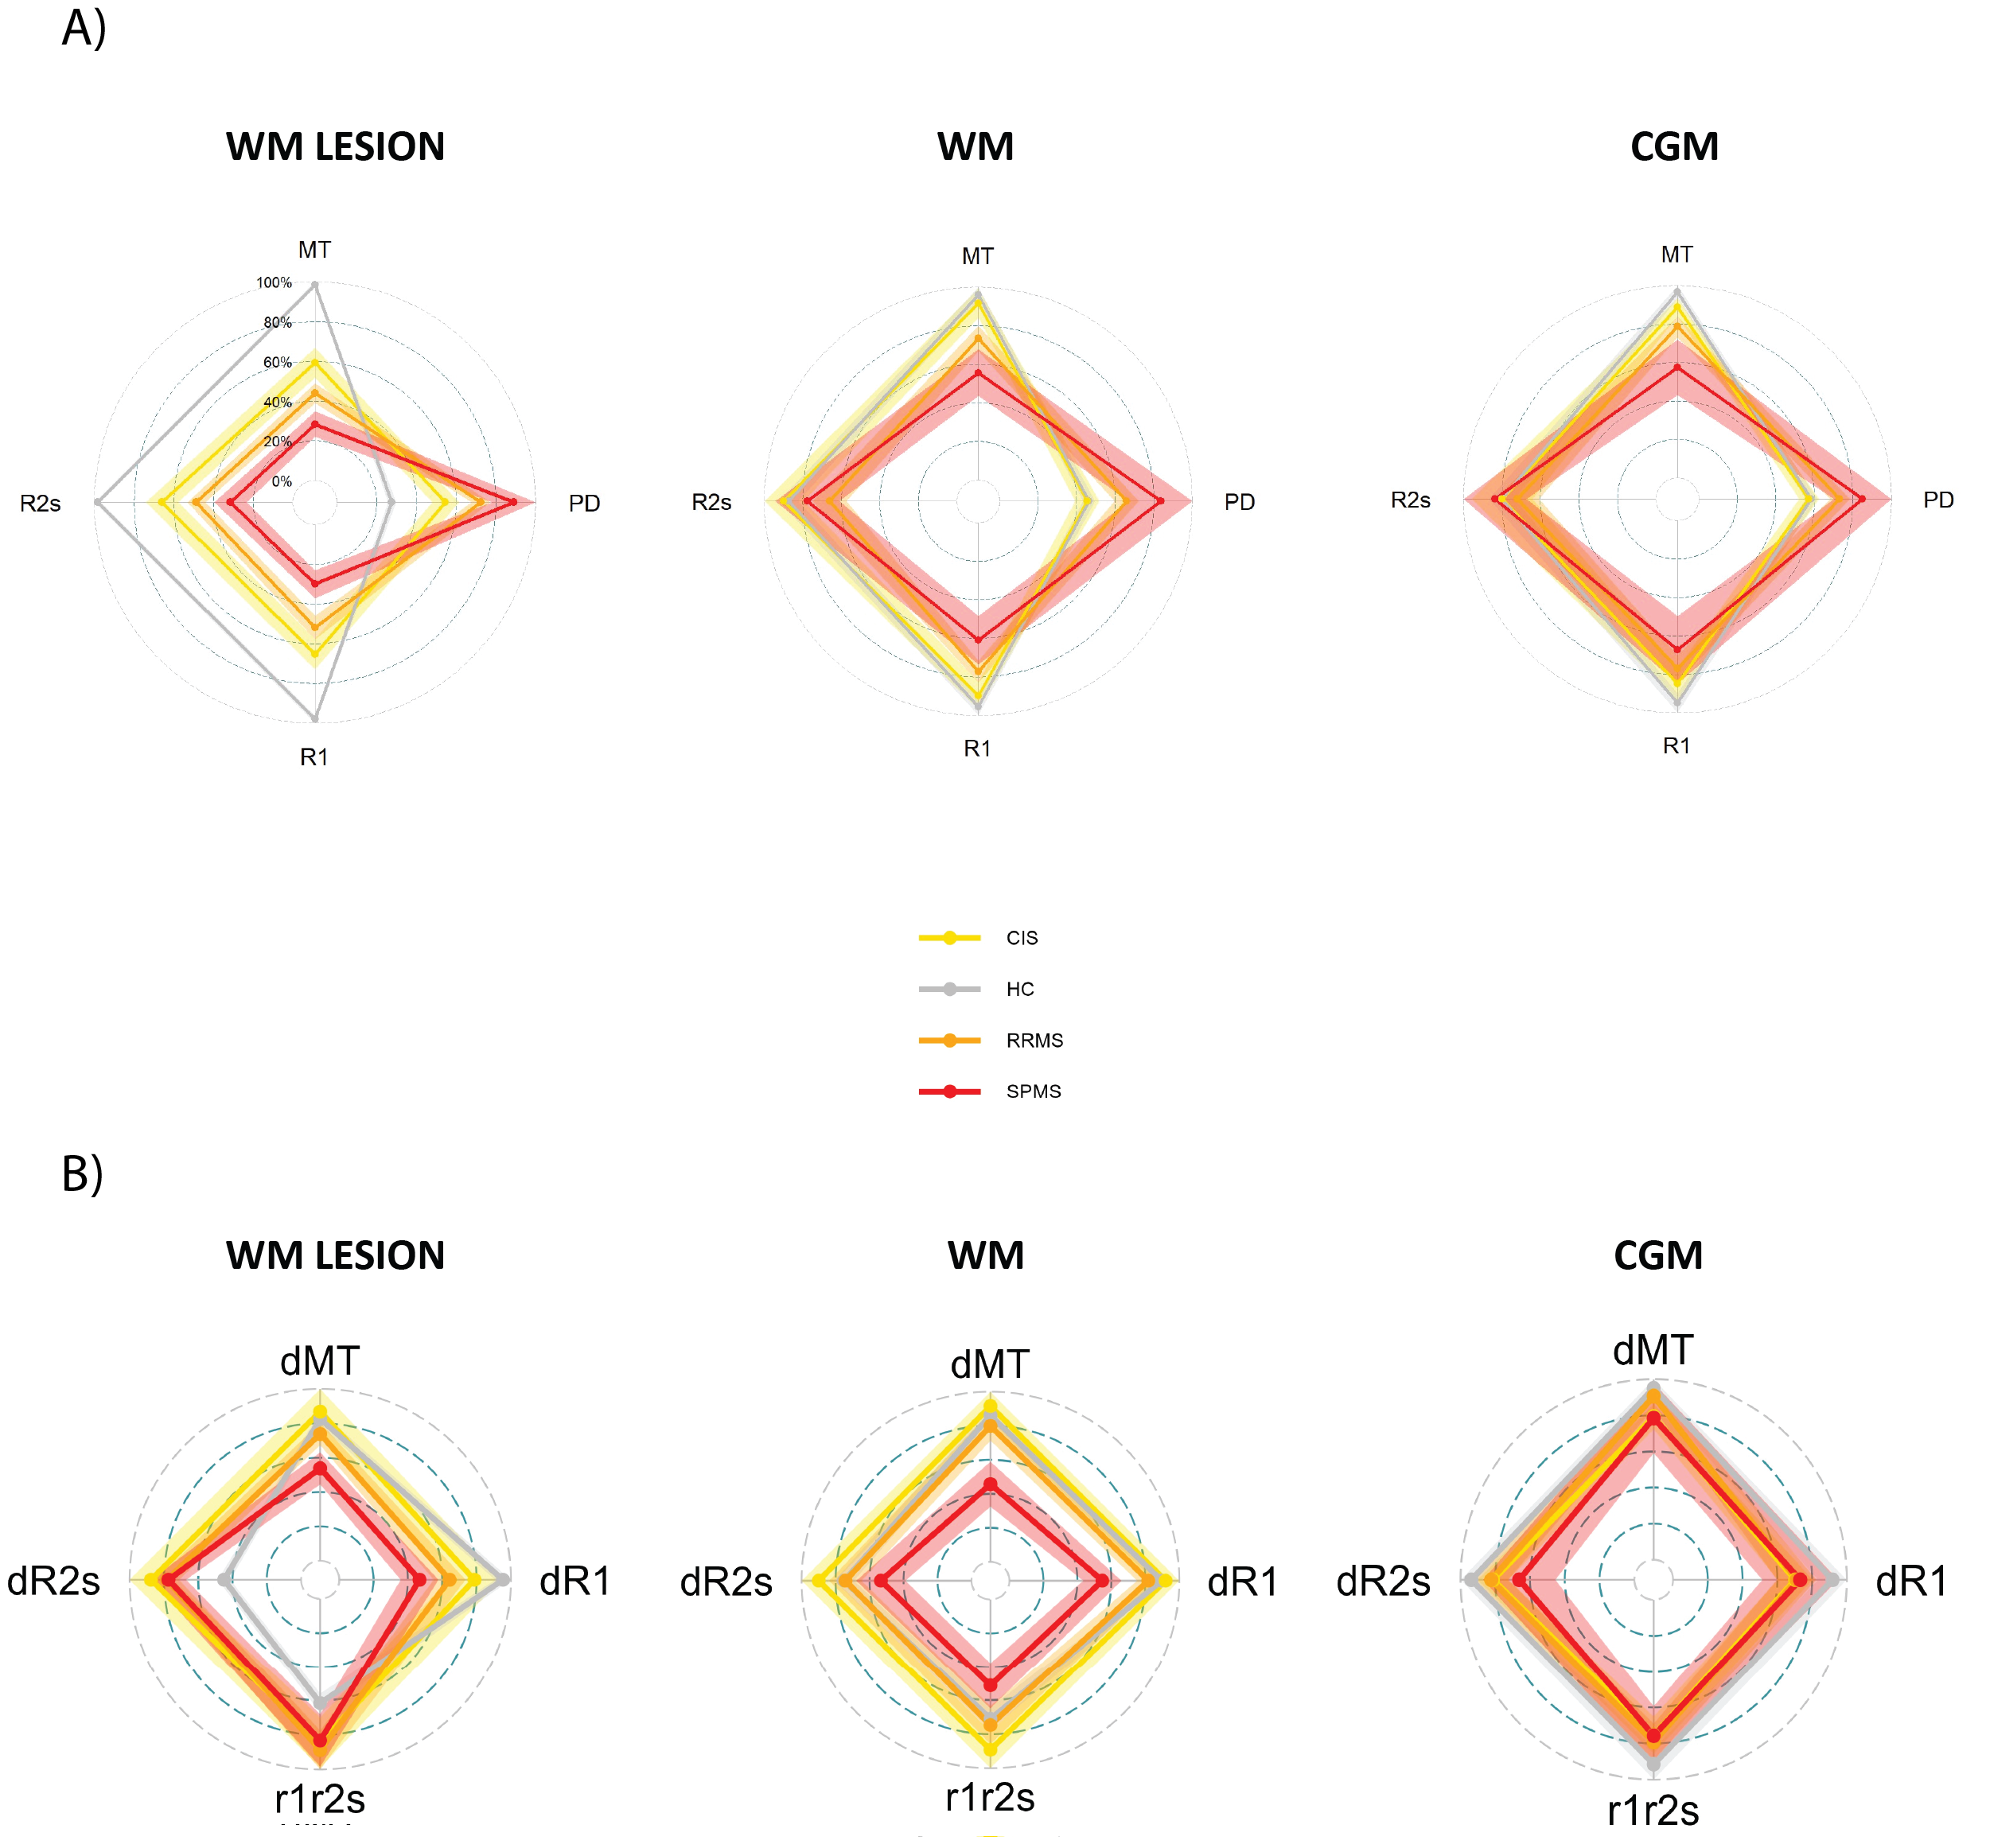
Figure 2:
A) normalized MPM spider plots comparing MS subtypes and HC.
B) normalized MDM derivatives and r1-r2* spider plots. Each axis of the spider plot is the derivative of a different qMRI parameter after normalization of measurements. Median MTV and qMRI parameter were used to fit a linear model across bins with a number of voxels higher than 4% of the total ROI to extract the slopes.
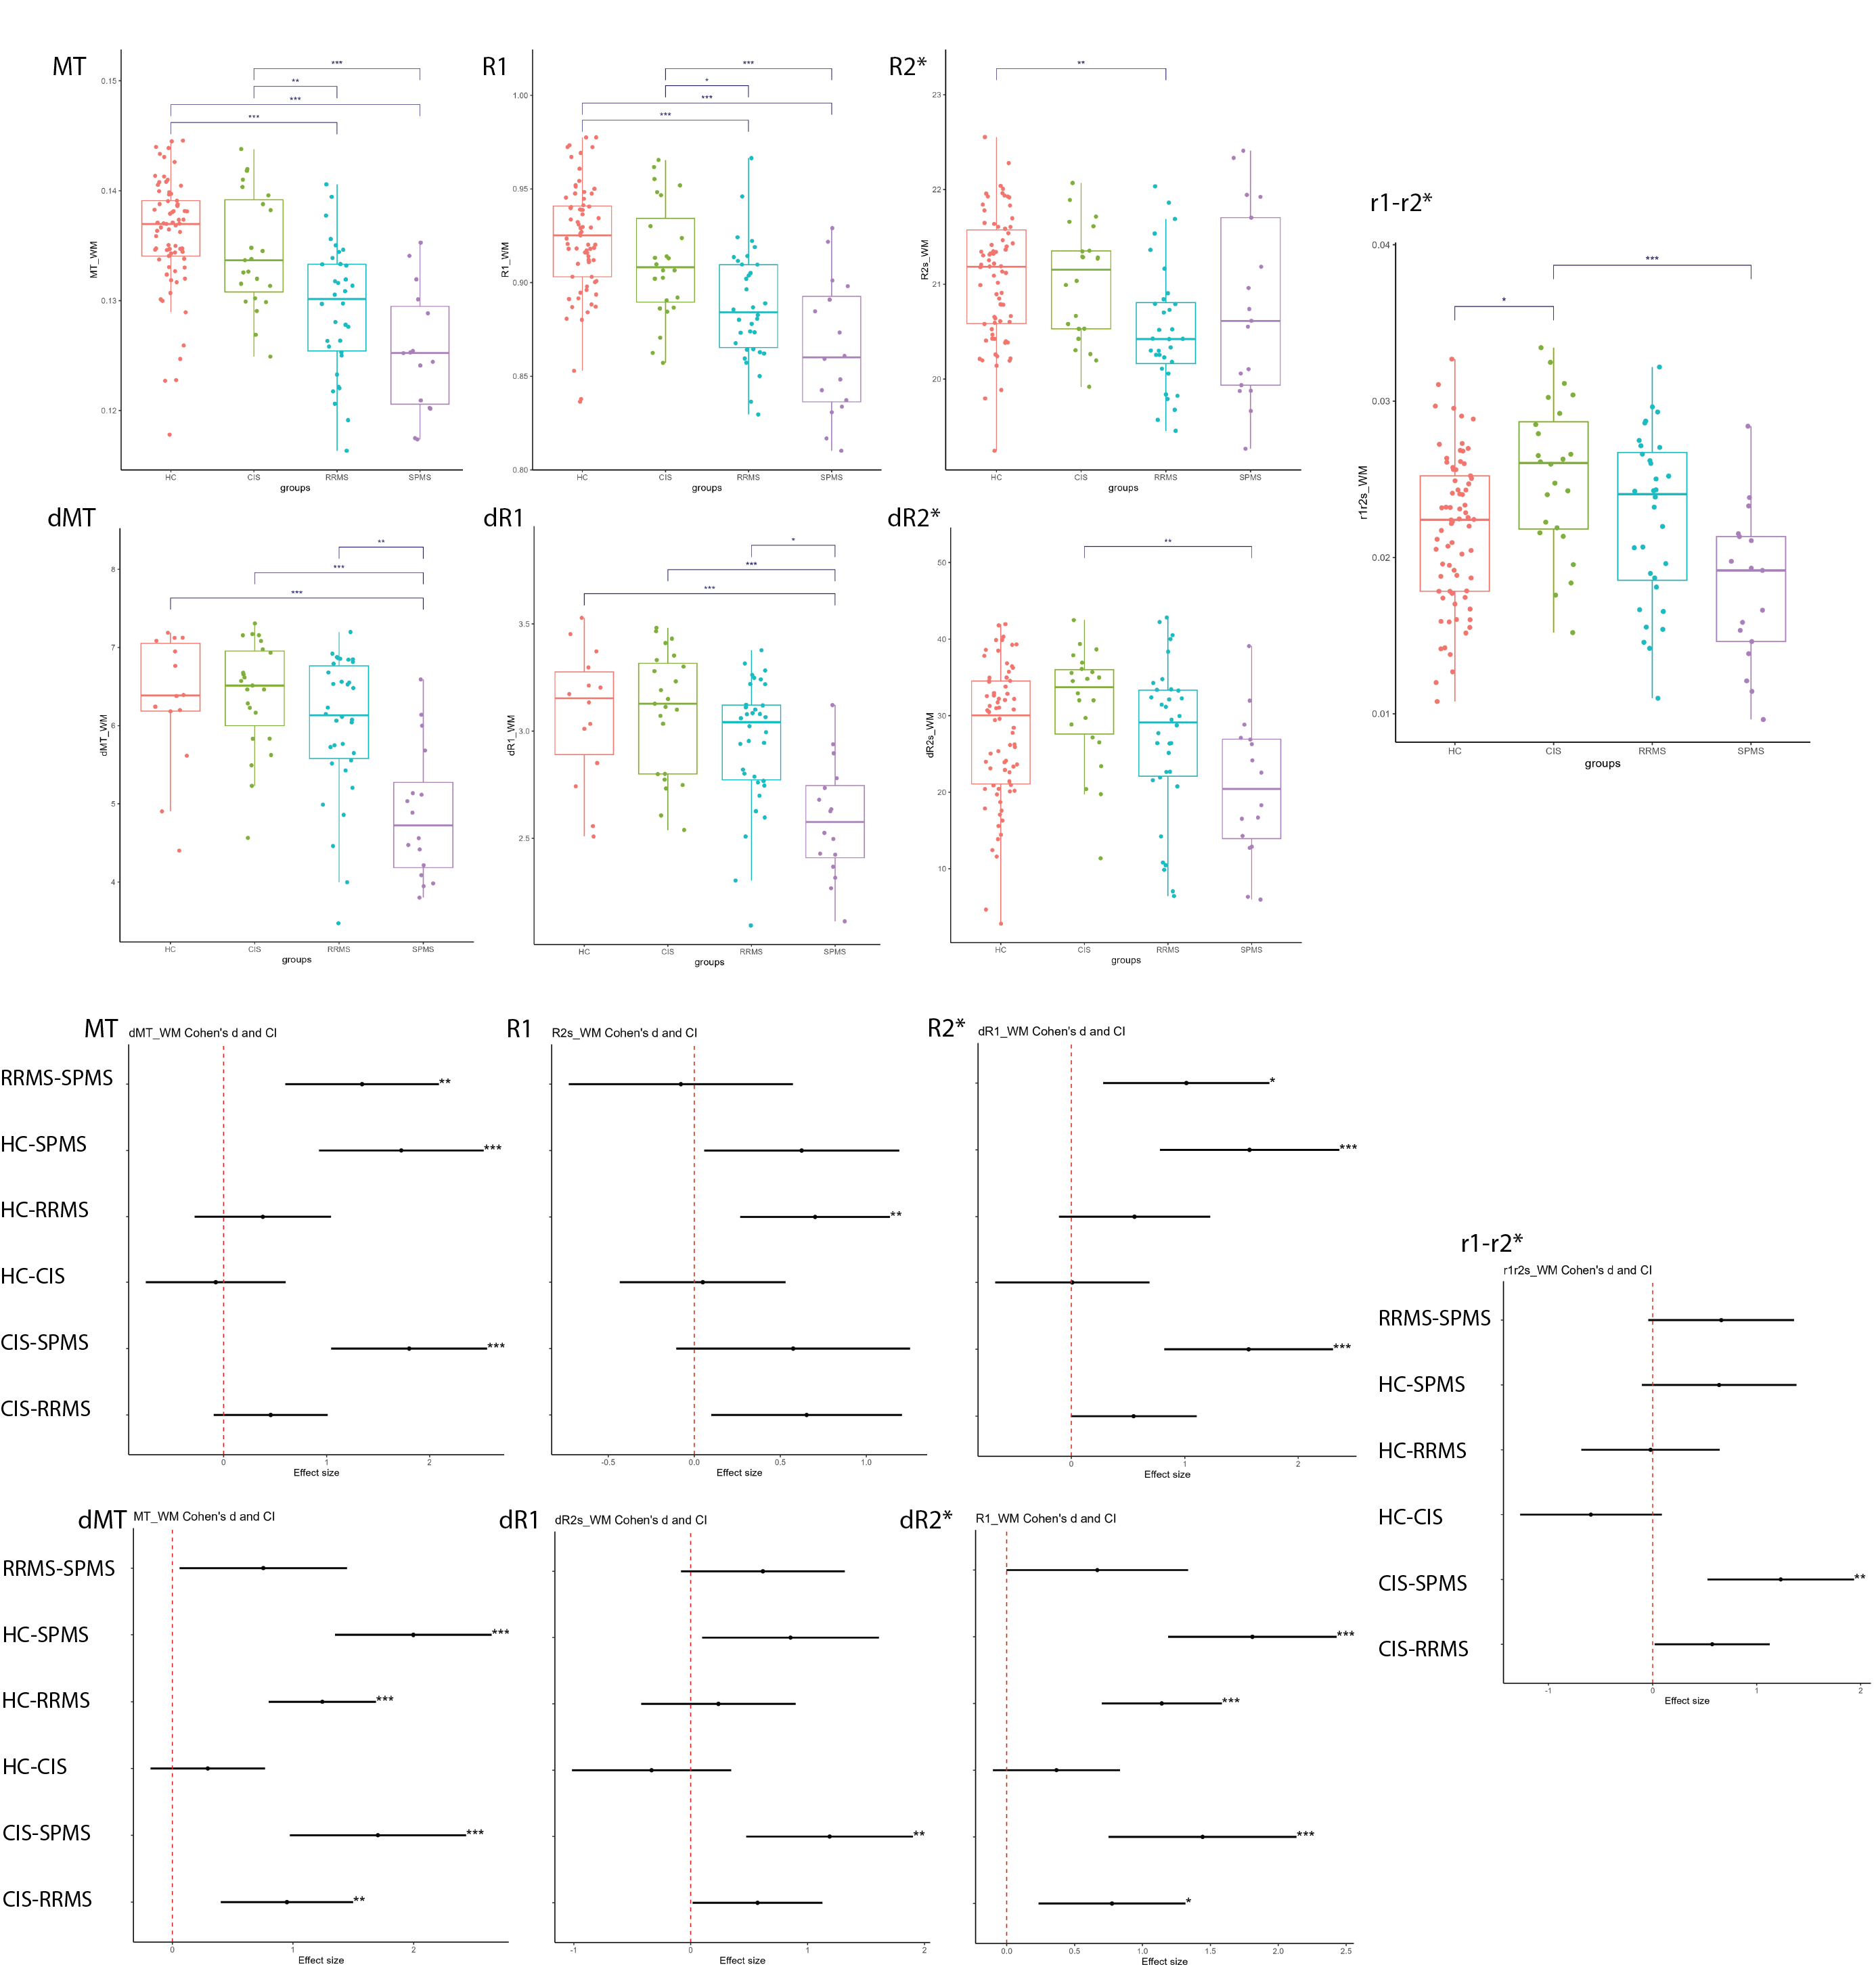
Figure 3: Group comparison boxplots and forestplots of effect sizes (cohen’s d and 95% confidence intervals) in WM.
Abbreviations: MT magnetization transfer saturation, PD proton density, R1 longitudinal relaxation rate, R2* transverse relaxation rate, dMT derivative of MT vs MTV, dR1 derivative of R1 vs MTV, dR2* derivative of R2* vs MTV, r1-r2* derivative of R1 vs R2*
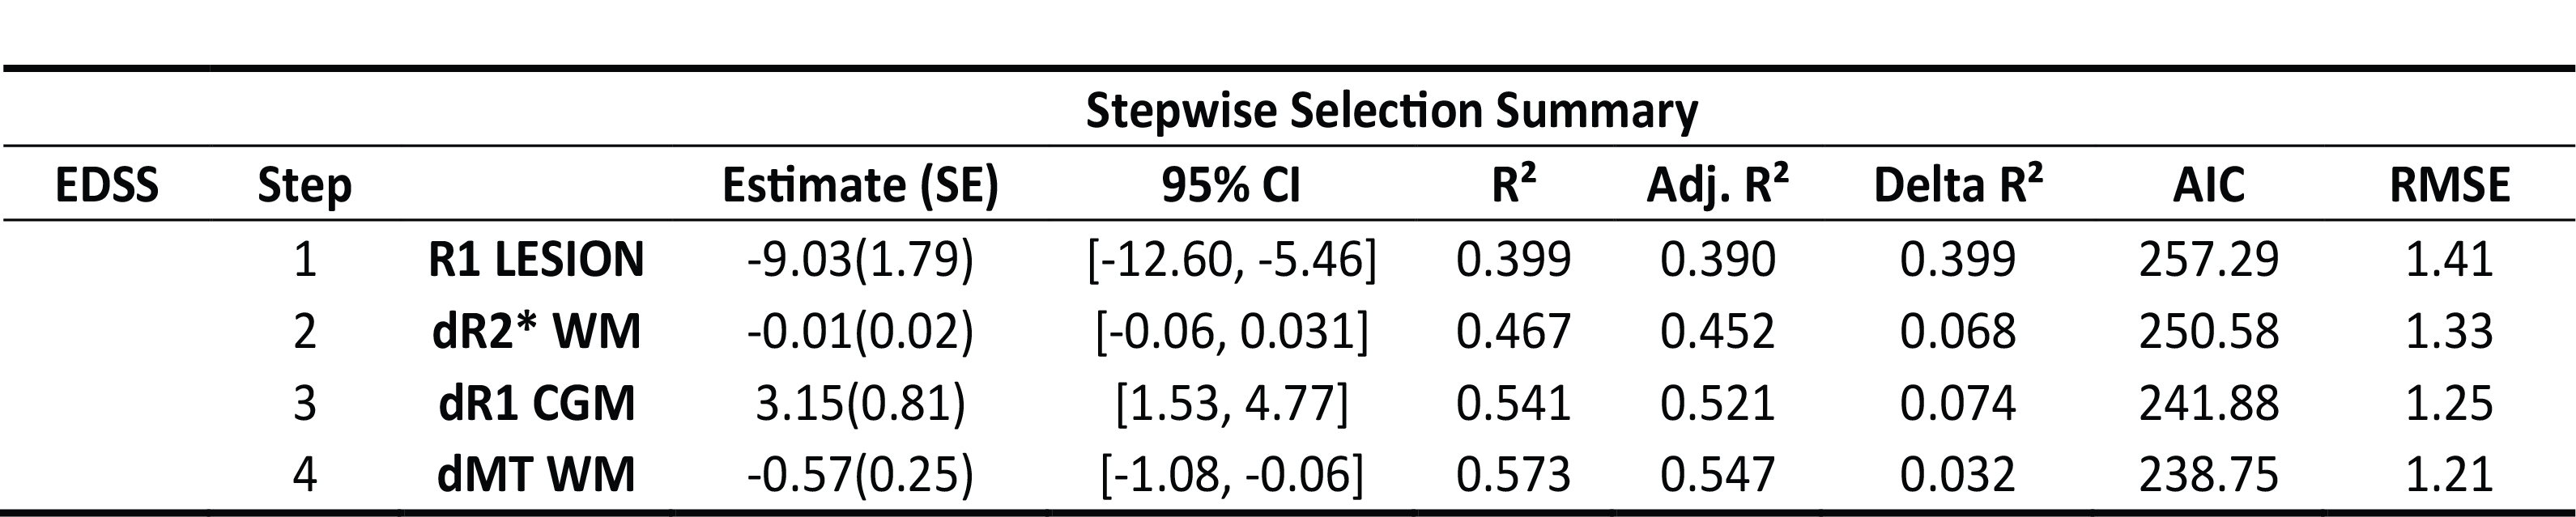
Table 1: Prediction of expanded disability status scale (EDSS) with a forward stepwise
regression (entry level into model p=0.05)
and loadings of significant parameters association to EDSS. Delta R² is the predictor individual contribution to the model's R².
Abbreviations: CI confidence interval, AIC Aikaike information criterion, RMSE root mean square, error, Adj adjusted