3210
Fast T1 Mapping to Assess Contrast Agent Clearing in the Human Brain1Cluster of Excellence Multiscale Bioimaging: from Molecular Machines to Networks of Excitable Cells (MBExC2067), University of Göttingen, Göttingen, Germany, 2Department of Interventional and Diagnostic Radiology, University Medical Center Göttingen, Göttingen, Germany, 3Department of Neurology, University Medical Center Göttingen, Göttingen, Germany, 4Institute of Biomedical Imaging, Graz University of Technology, Graz, Austria, 5Department of Cognitive Neurology, University Medical Center Göttingen, Göttingen, Germany
Synopsis
Keywords: Contrast Agents, Quantitative Imaging
Motivation: Waste clearance mechanisms are essential to maintain homeostasis of the brain. Impairment of such mechanisms may play a key role in various diseases.
Goal(s): To gain insights into waste clearance processes and propose characteristic metrics to describe them.
Approach: We injected contrast agent intravenously and monitored clearance with serial T1 mapping utilizing fast single-shot T1 acquisition with radial FLASH and NLINV reconstruction in healthy volunteers.
Results: Time-T1 values of full protocol with 35 acquisitions fit well to our exponential model and can be characterized by clearance time $$$\tau$$$ and biggest T1 difference max T1. A dramatically reduced acquisition protocol gives similar results.
Impact: Advanced fast single-shot T1 mapping is promising to characterize waste clearance function in the human brain. Because of a short whole brain acquisition time of 3 minutes it can be integrated easily into existing clinical protocols.
Introduction
Waste clearance mechanisms of the brain are essential to maintain homeostasis of the brain. Accumulation of metabolites such as Tau, Amyloid-β or α-Synuclein1−4 play a key role in various diseases such as Alzheimer’s or Parkinson’s disease and could be related to impairment of clearance mechanisms. We present a method to assess the clearance function of the human brain by intravenous application of a gadolinium-based contrast agent (CA) in combination with whole brain, single-shot T1 mapping with radial FLASH and NLINV reconstruction5 (single-shot T1) over 48h after CA administration.Methods
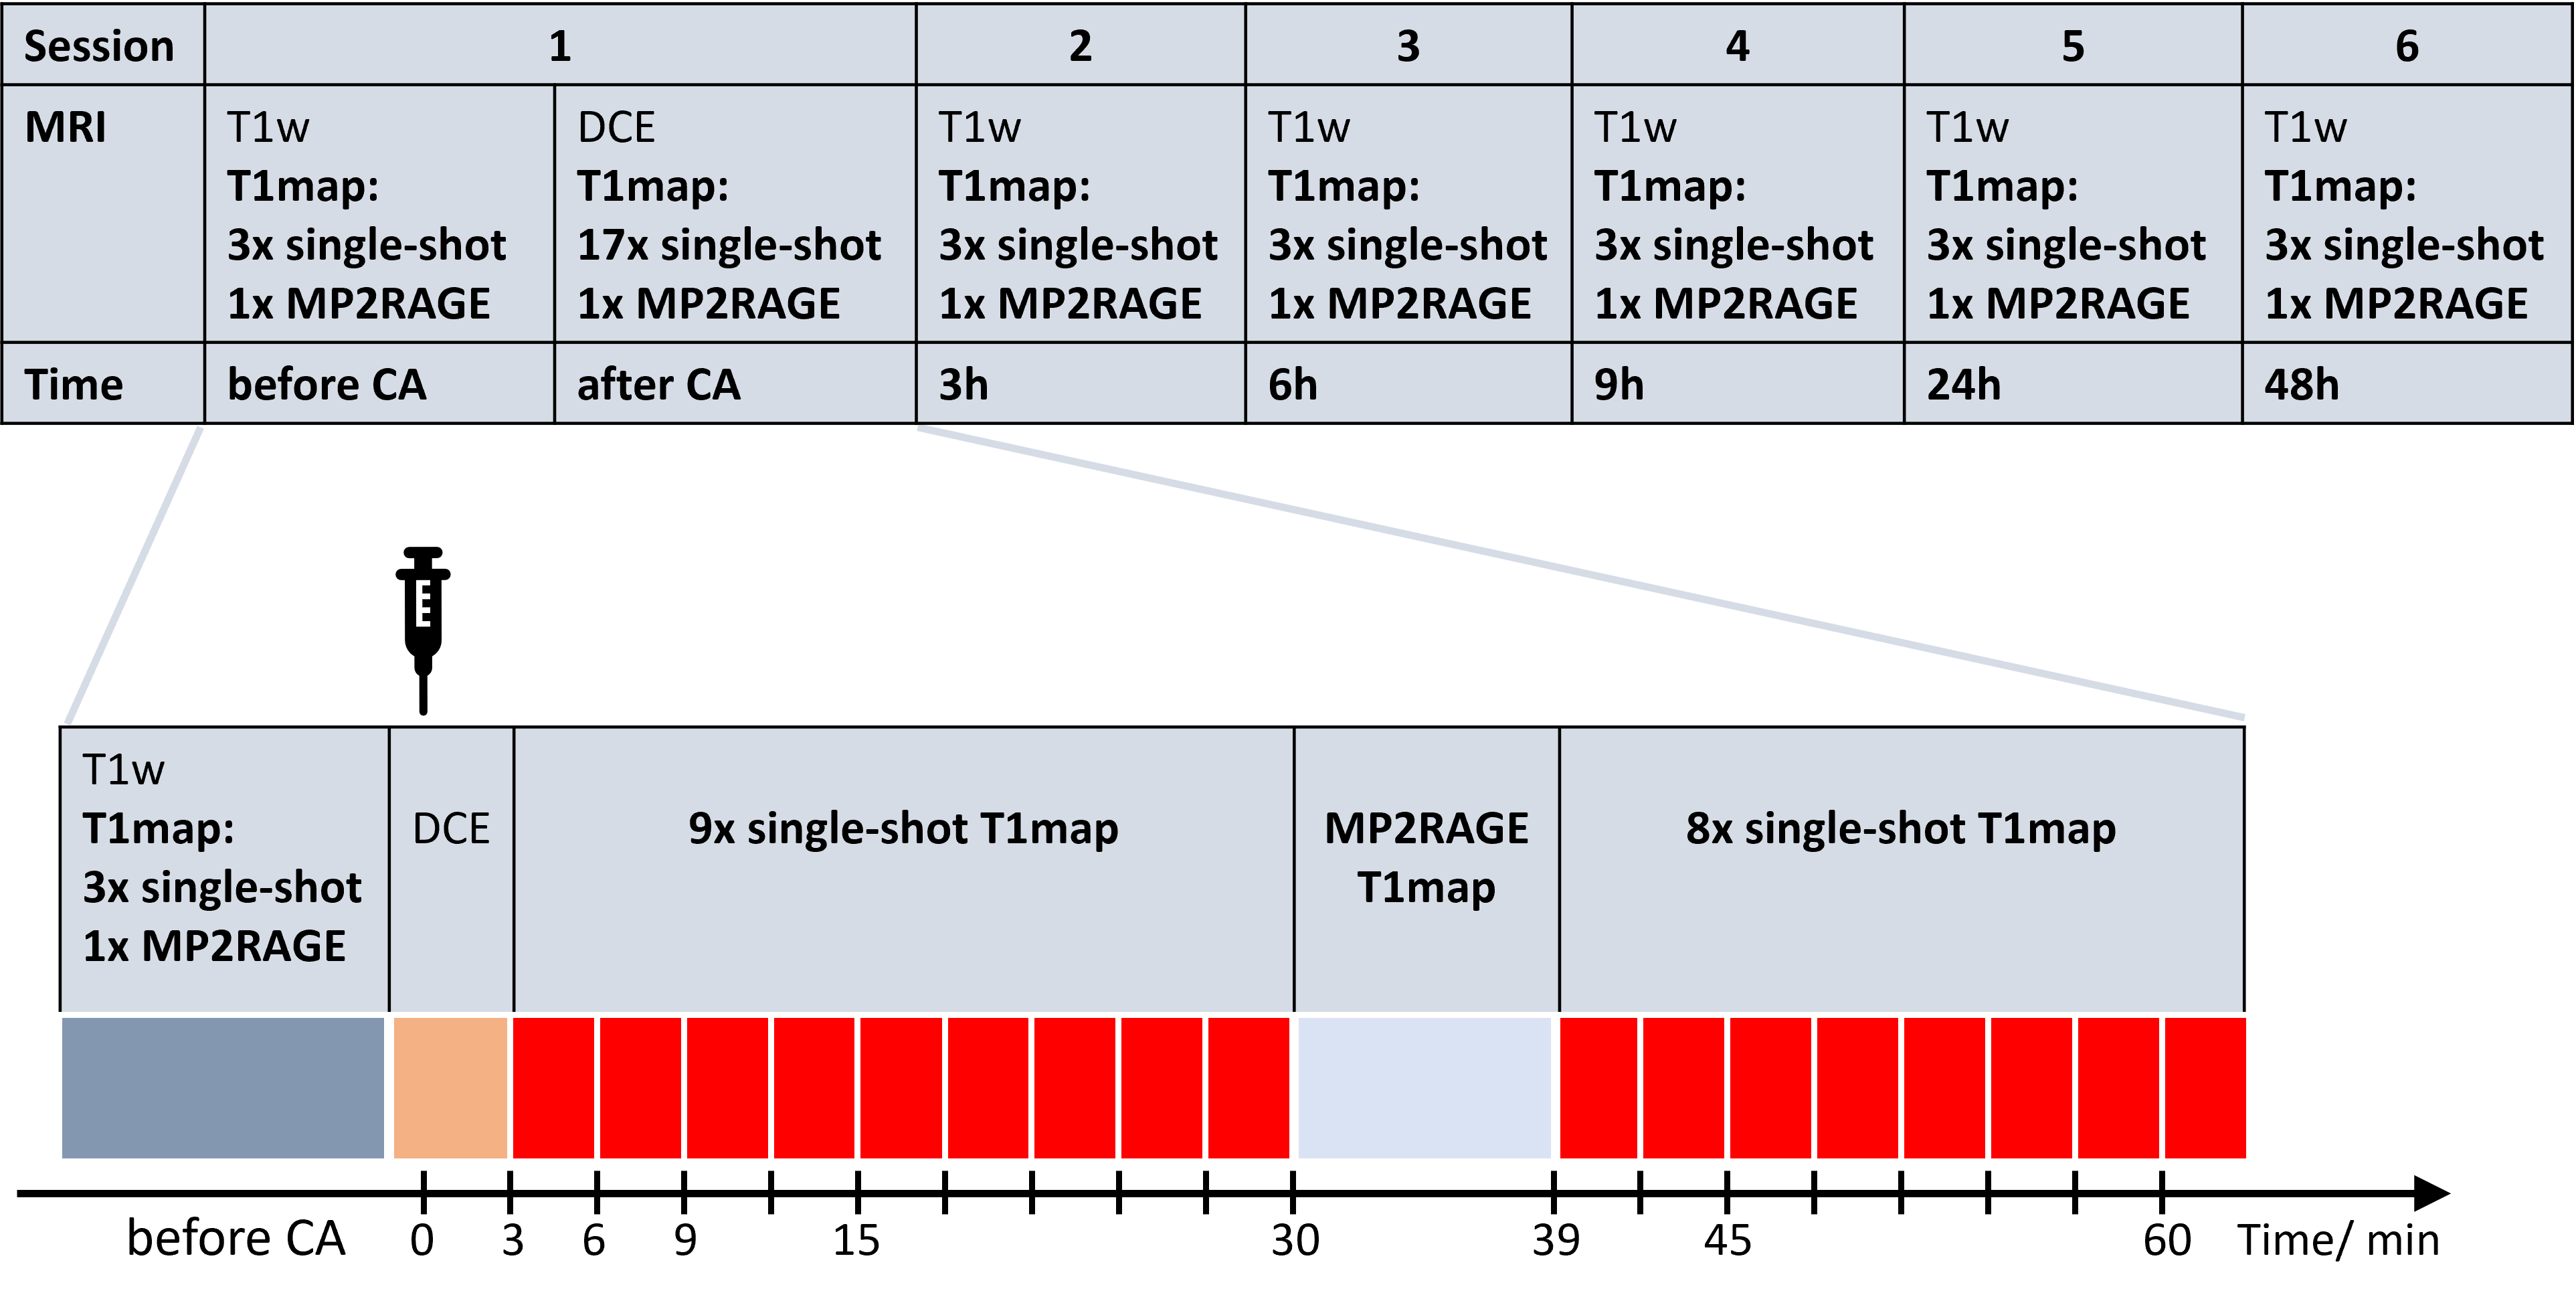
10 healthy subjects (25+/-7yrs) underwent MRI scans performed at 3T (Siemens Prisma fit) with a 64-channel head coil. The MRI protocol (Fig.1) included pre-contrast and serial post-contrast T1 mapping using single-shot radial FLASH T1 mapping5 (0.75x0.75x3mm=1.69mm3) and conventional MP2RAGE6 imaging (1mm isotropic). Each participant underwent 6 MRI sessions in total. The first session was used to acquire a T1-weighted (T1w) anatomical dataset and to record baseline T1 values (T1 native), followed by intravenous CA bolus-injection (Gadovist, 0.1ml/kg bodyweight) during a dynamic contrast enhanced (DCE) scan. Then, whole brain single-shot T1maps were acquired every 3min within the first hour, with a single MP2RAGE acquisition 30 minutes after CA application (17 single-shot and 1 MP2RAGE T1maps). Each of the 5 post-CA follow-up sessions over 48h included 3 single-shot T1maps and 1 MP2RAGE T1map.Data Preparation
T1maps were co-registered to the T1w dataset from the first session, which was also used for segmentation (Freesurfer7). Segmentation yielded masks of cortical grey matter (GM), white matter (WM), and putamen. Region-specific time-T1 values were extracted before and after CA administration and the following model was used to estimate clearance time.Clearance Model
We assume that the CA has a constant specific relaxivity r1. Therefore, the increase in the NMR relaxation rate R1 in the tissue is proportional to the concentration of the contrast agent [CA]8. Moreover, we assume that the time-dependent concentration of CA after intravenous injection can be described by a decaying exponential function8−12. Therefore, the total time-dependent rate R1 is given by$$
\begin{aligned}\mathrm{R1}\!\left(t\right) &= \mathrm{R1}^{\mathrm{native}} + \mathrm{R1}\left(\left[\mathrm{CA}\right]\right) \\ &= \mathrm{R1}^{\mathrm{native}} + \mathrm{r1}\!\left(\left[\mathrm{CA}\right]\right)\exp{\left(-t/\tau\right)} \\&= \mathrm{R1}^{\mathrm{native}} + \mathrm{r1} \times \left[\mathrm{CA}\right]\exp{\left(-t/\tau\right)}.
\end{aligned}
$$
Where $$$\tau$$$ is the clearance (or efflux) time constant and R1native is the R1 value before injection of CA. Accordingly, we expect that the maximal concentration of CA in the tissue occurs just after injection at $$$t=0$$$. Together with the relation T1=1/R1 we obtain the corresponding T1 values as a function of time after CA administration.
Results & Discussion
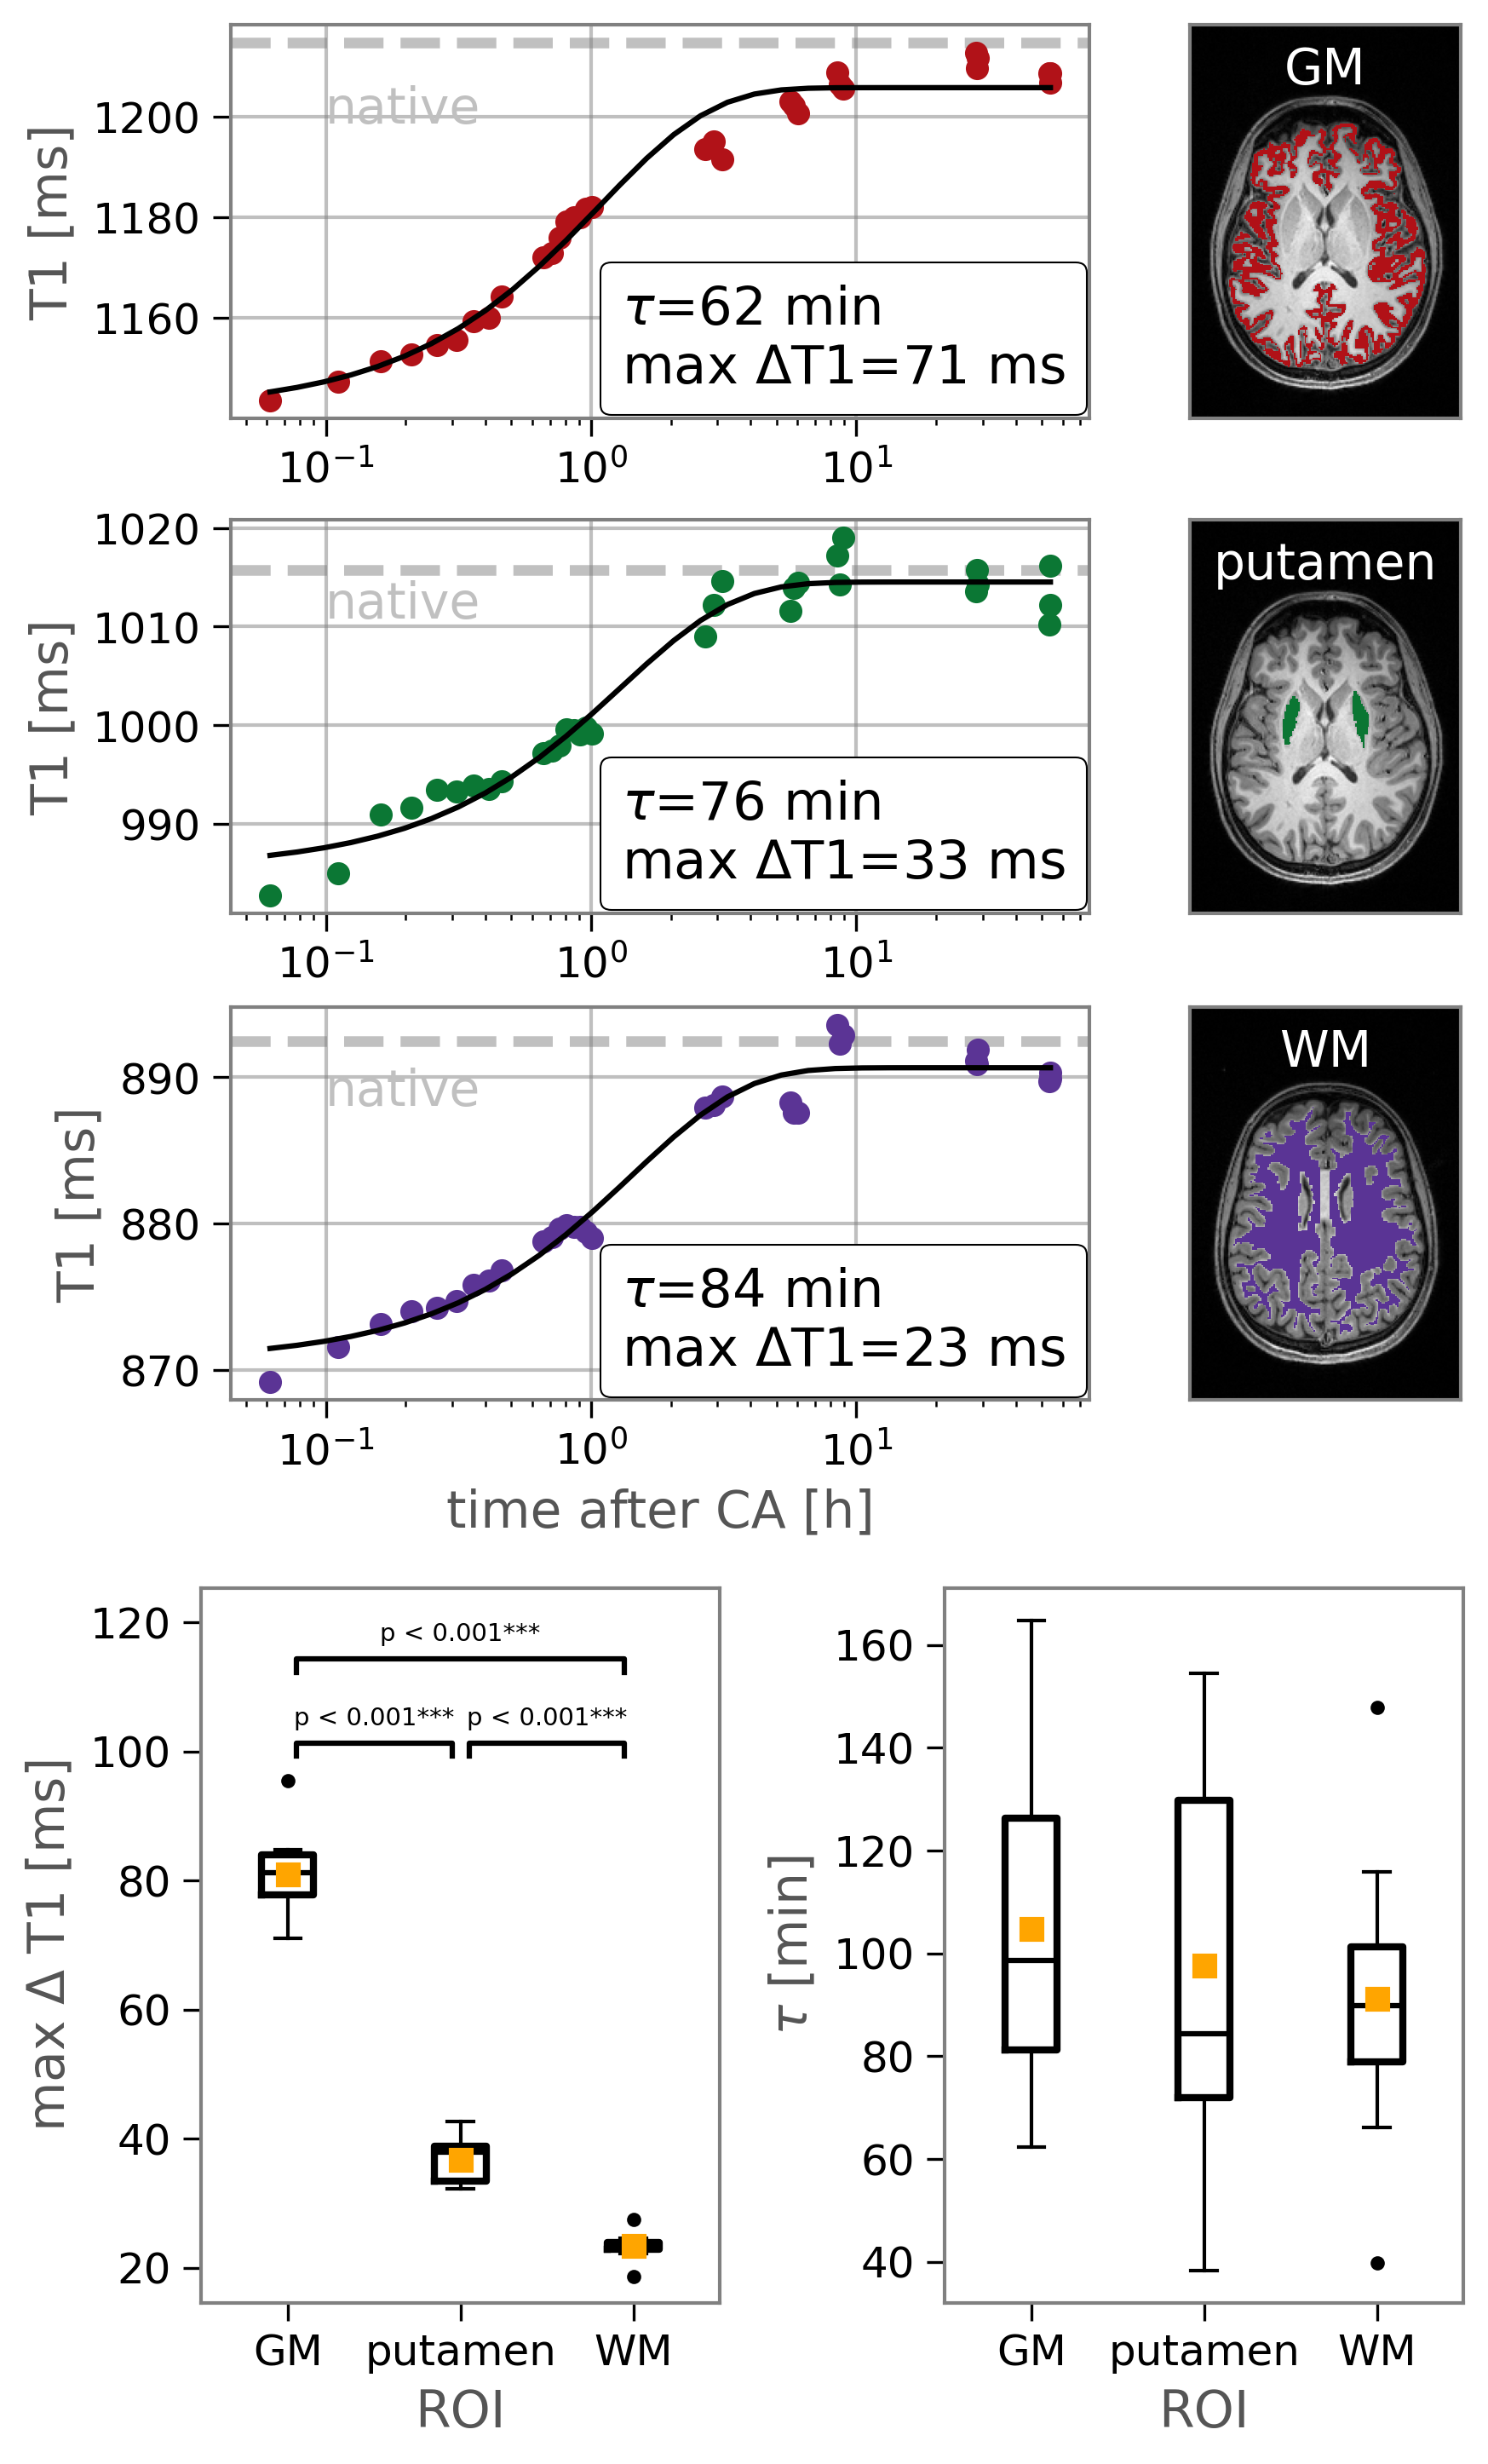
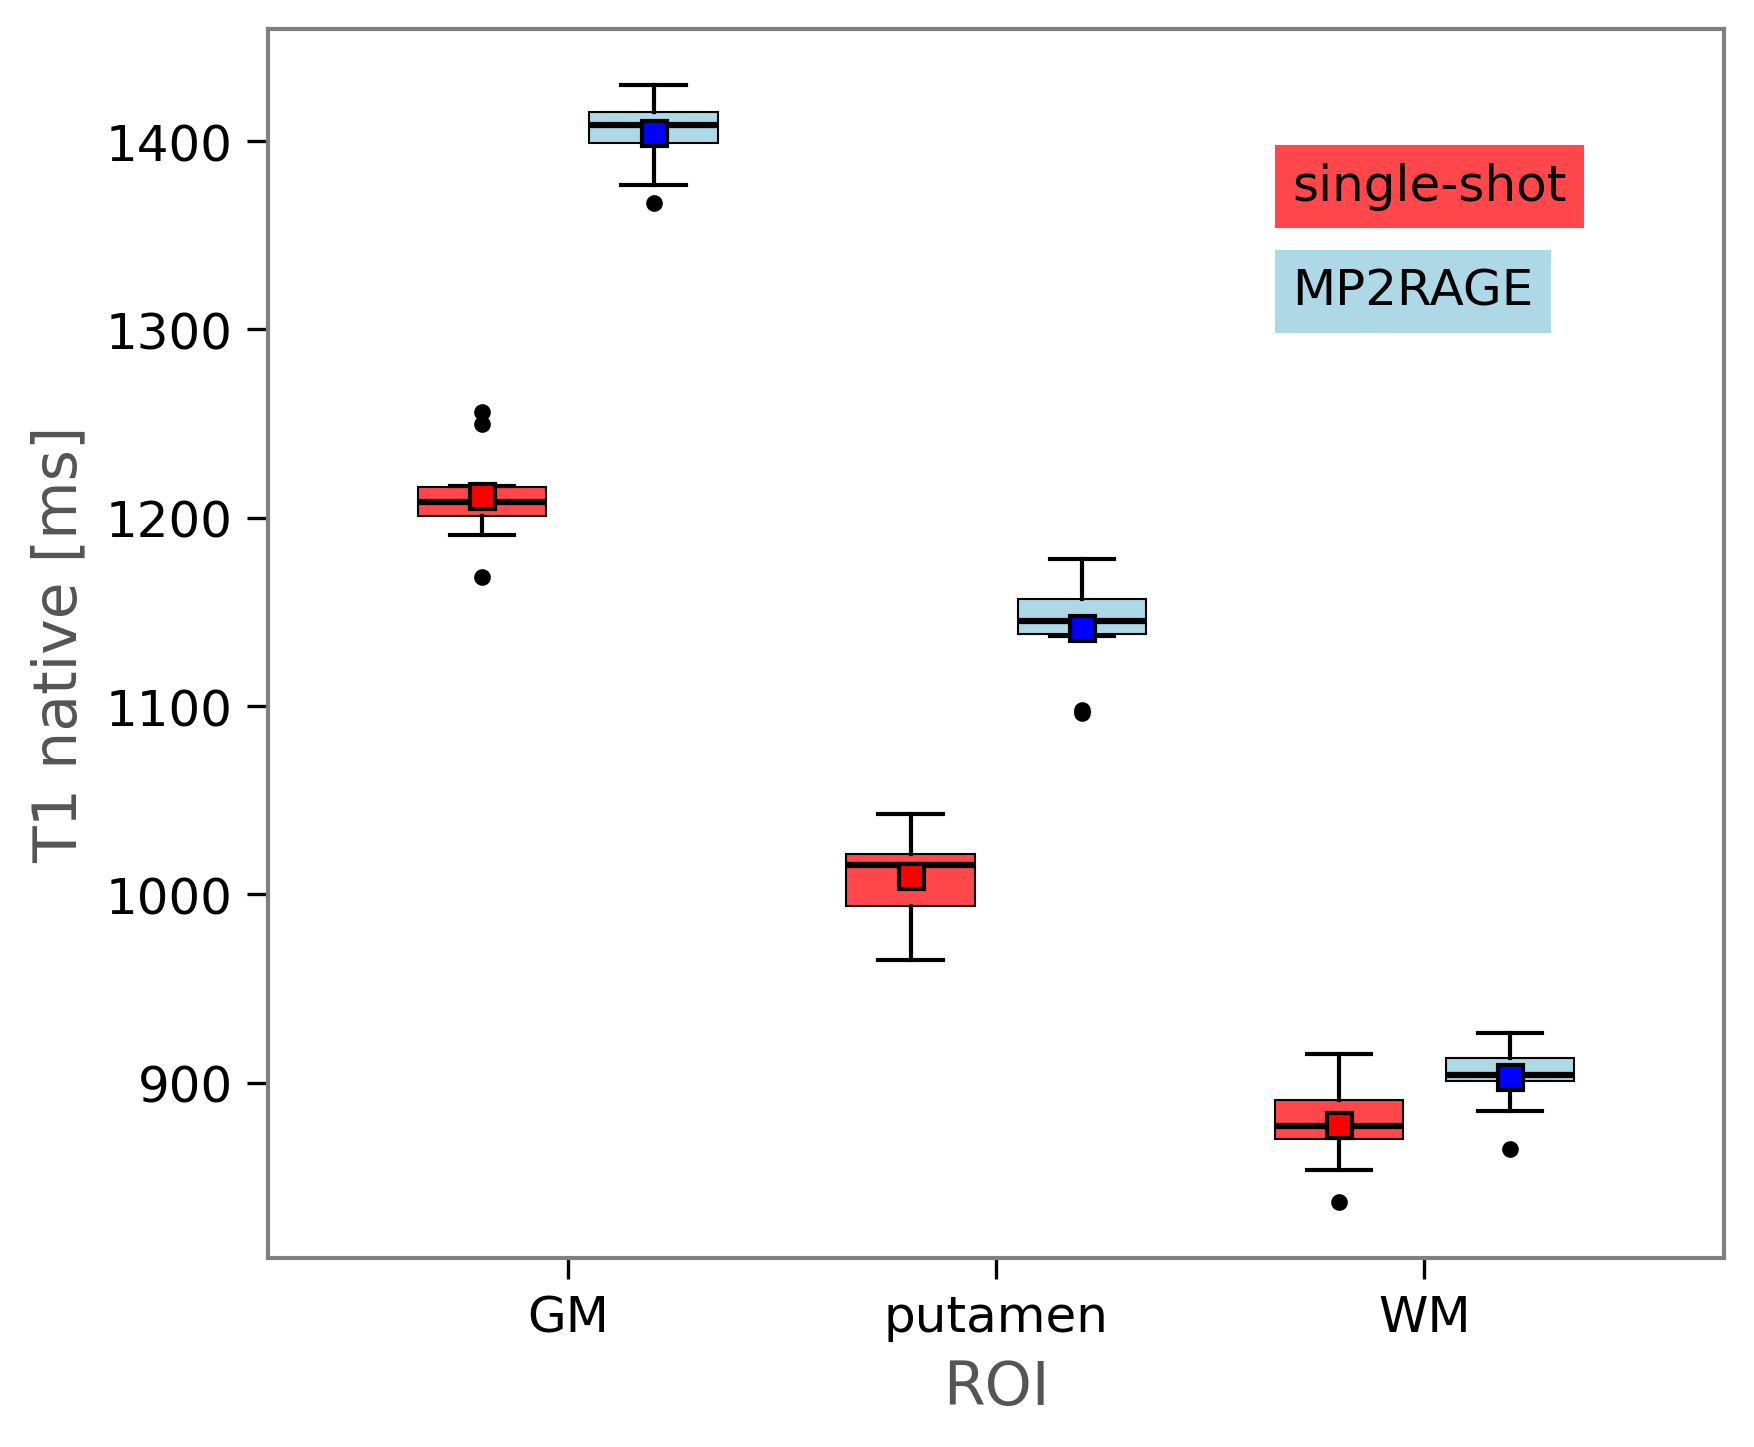
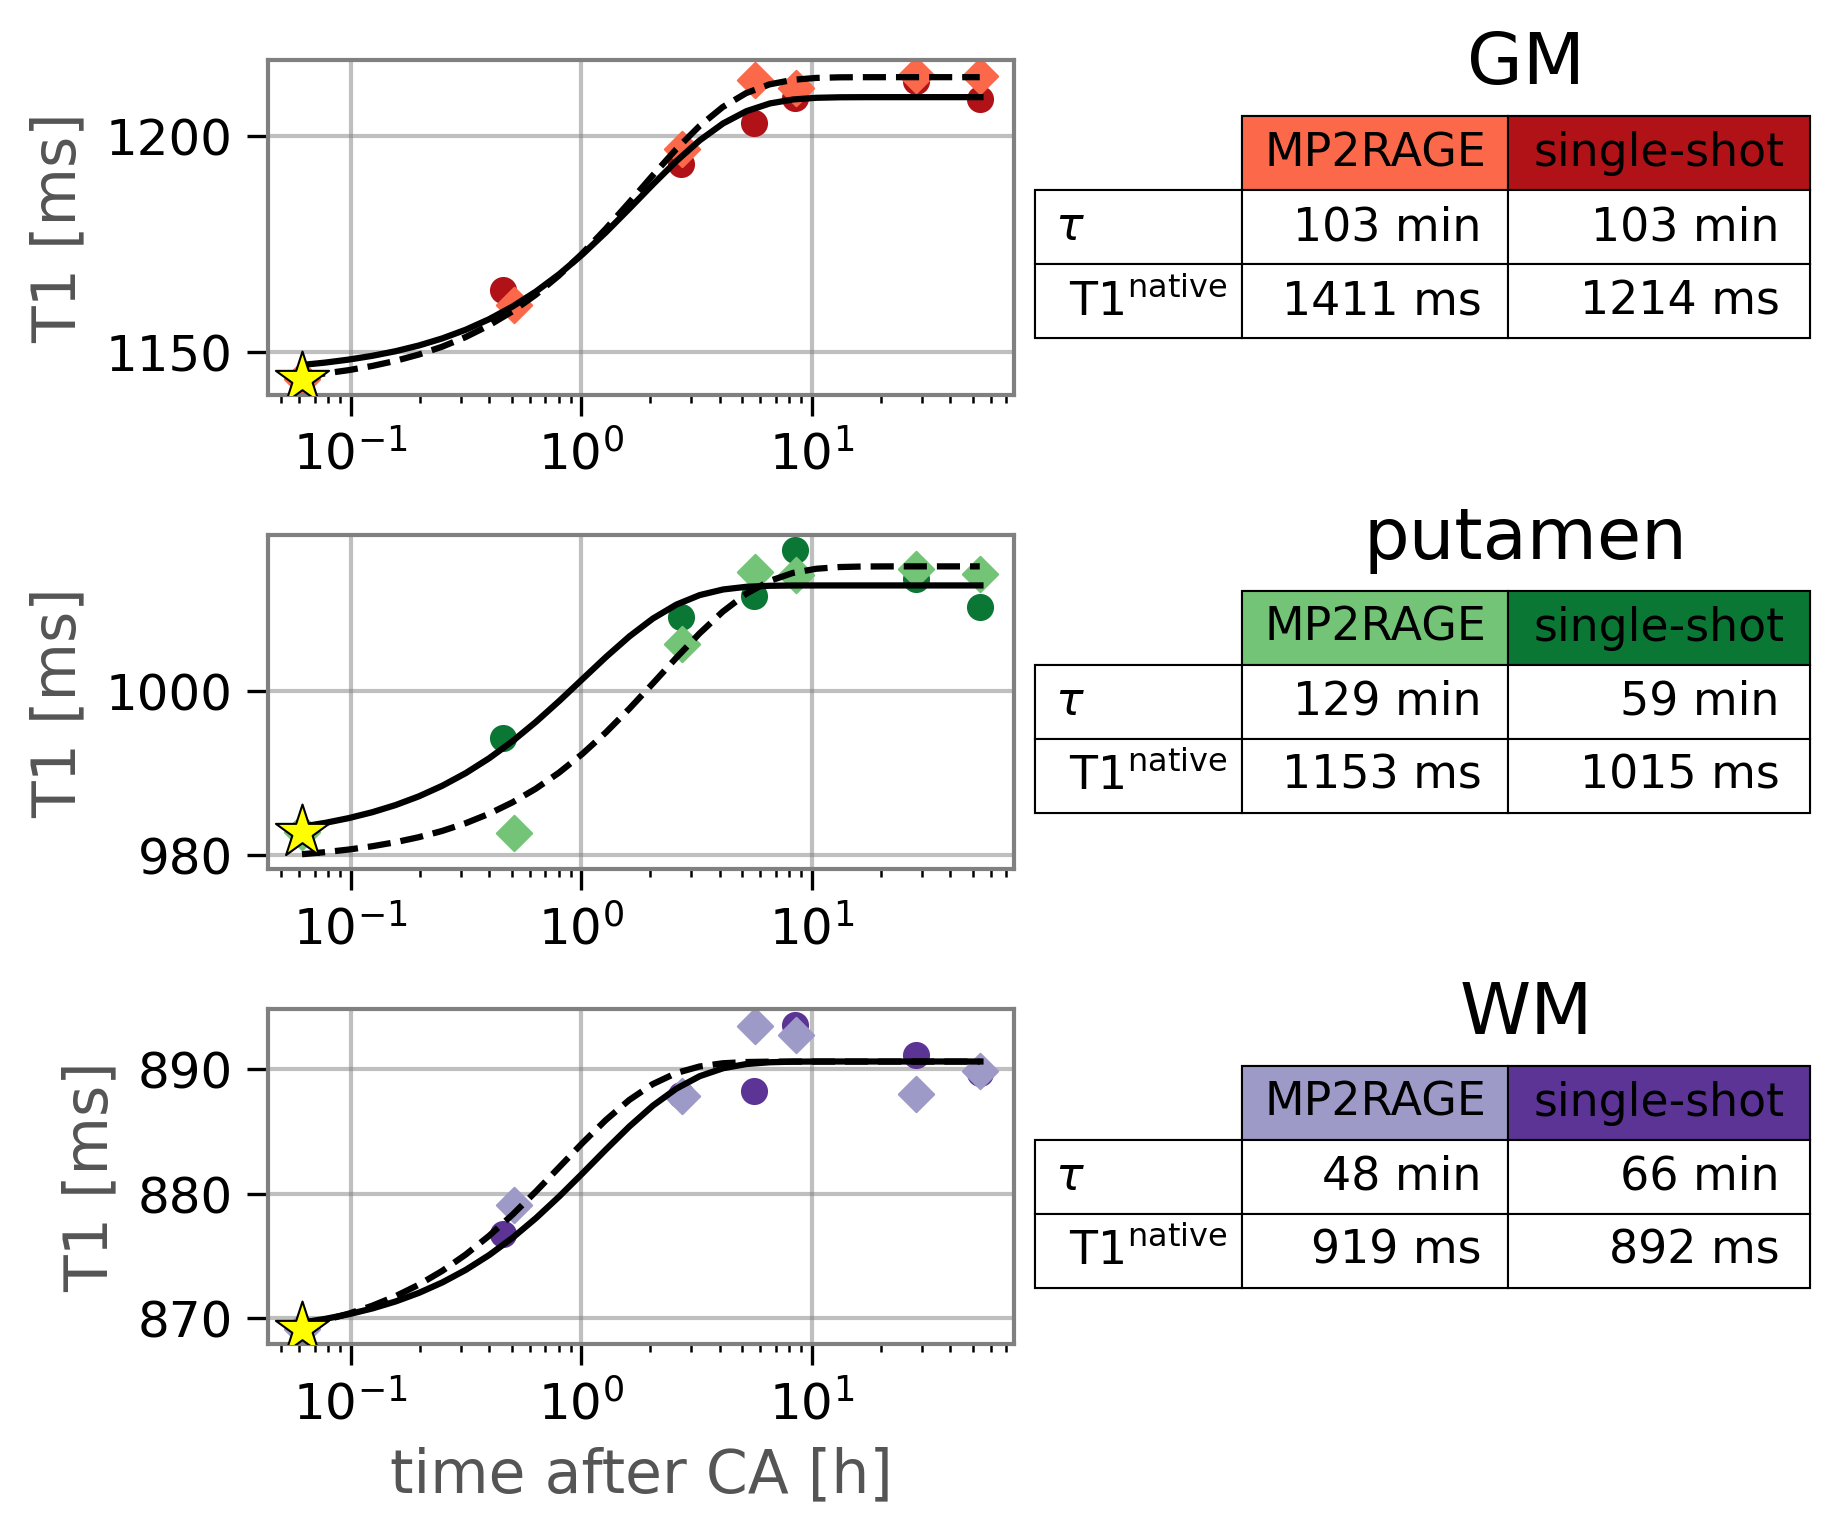
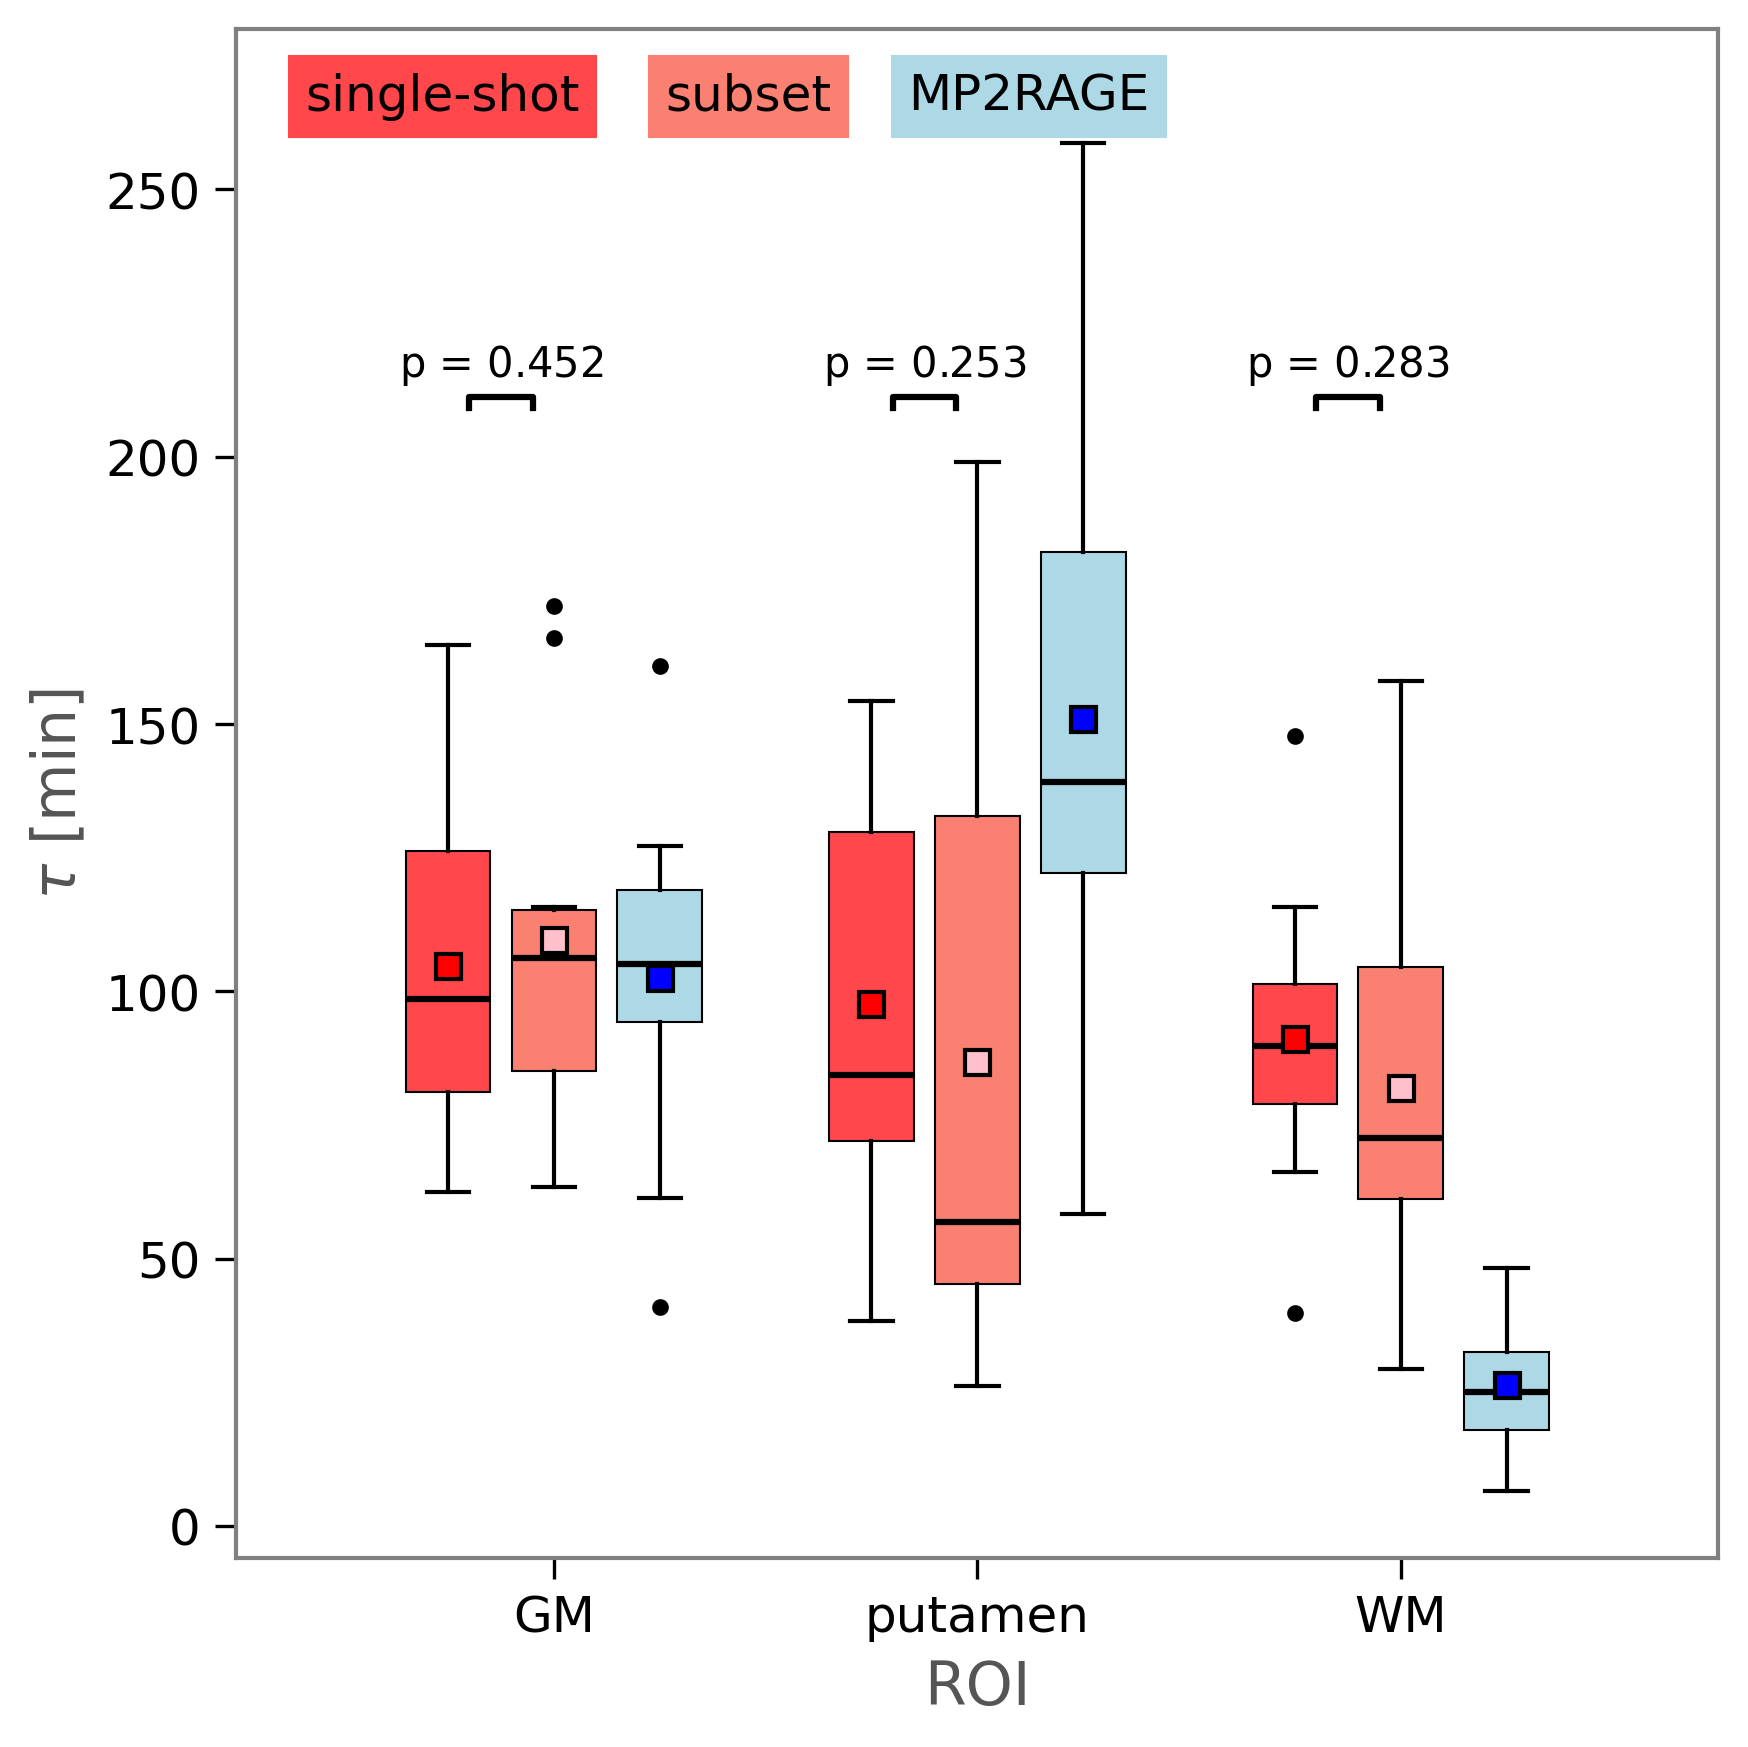
First, we fitted the model to region-averaged datasets of time-T1 values (Trust Region Reflective13) and extracted two characteristic metrics; clearance time $$$\tau$$$ and maximal T1 difference max ΔT1. Fig.2 demonstrates this procedure on a selected dataset (top) and shows group statistics of the extracted metrics (bottom). In particular max ΔT1 shows significant region-dependent differences, which is in good agreement with 14. Next, we compared metrics from single-shot T1 acquisitions with metrics obtained by MP2RAGE. Region-averaged native T1 values were all within reported physiological ranges15,16 for both acquisition methods (see Fig.3). Pronounced differences between single-shot- and MP2RAGE-based T1 values are most likely caused by partial volume effects due to an increased slice thickness of 3mm for single-shot T1 data as compared to isotropic MP2RAGE data. For better comparison to single-shot T1 data, we therefore adjusted MP2RAGE values by this observed difference (see Fig.4) and extended the MP2RAGE dataset by the first single-shot T1 data point post CA (yellow star). Furthermore, we reduced the number of single-shot T1 data points (subset) to match MP2RAGE data and assessed how this reduction affects the fit. In particular, we were interested in the effect on the clearance time $$$\tau$$$. Region-specific clearance times $$$\tau$$$ resulting from all three cases, specifically full single-shot T1 dataset, corresponding subset and the adjusted and extended MP2RAGE dataset, are summarized in Fig.5. Mean values between single-shot T1 subset and full dataset are not significantly different, indicating that a reduced single-shot T1 acquisition protocol can recover comparable CA clearance dynamics. Differences between single-shot T1 subset data and MP2RAGE, in particular in WM and putamen need further investigation.Conclusions
We demonstrated how fast T1 mapping can be used to gain insights regarding CA clearance in the human brain, in particular shortly after CA administration. Importantly, we showed that single-shot T1 mapping with a reduced acquisition protocol results in similar clearance times and is promising to characterize waste clearance function in the human brain. Because of the short whole brain acquisition time, especially further advanced single-shot T1 methods17 could be integrated easily into existing clinical protocols.Acknowledgements
This work was supported by research grants from the Else-Kröner-Fresenius Foundation and the Deutsche Forschungsgemeinschaft (DFG) under Germany’s Excellence Strategy—EXC 2067.
P.D. and M.B. contributed equally.
References
- Iliff JJ, Wang M, Liao Y, Plogg BA, Peng W, Gundersen GA, et al. A paravascular pathway facilitates CSF flow through the brain parenchyma and the clearance of interstitial solutes, including amyloid β. Science translational medicine. 2012;4(147):147ra111-147ra111.
- Patel TK, Habimana-Griffin L, Gao X, Xu B, Achilefu S, Alitalo K, et al. Dural lymphatics regulate clearance of extracellular tau from the CNS. Mol Neurodegeneration. 2019 Dec;14(1):11.
- Lundgaard I, Lu ML, Yang E, Peng W, Mestre H, Hitomi E, et al. Glymphatic clearance controls state-dependent changes in brain lactate concentration. J Cereb Blood Flow Metab. 2017 Jun;37(6):2112–24.
- Stefanis L. α-Synuclein in Parkinson’s Disease. Cold Spring Harb Perspect Med. 2012 Jan 2;2(2):a009399.
- Zhang S, Uecker M, Frahm J. T1 mapping in real time: Single inversion-recovery radial FLASH with nonlinear inverse reconstruction. In: Annual Meeting ISMRM, Salt Lake City. Citeseer; 2013.
- Marques JP, Kober T, Krueger G, van der Zwaag W, Van de Moortele PF, Gruetter R. MP2RAGE, a self bias-field corrected sequence for improved segmentation and T1-mapping at high field. NeuroImage. 2010 Jan 15;49(2):1271–81.
- Fischl B. FreeSurfer. Neuroimage. 2012;62(2):774–81.
- Tofts PS. Modeling tracer kinetics in dynamic Gd-DTPA MR imaging. J Magn Reson Imaging. 1997 Jan;7(1):91–101.
- Ohno K, Pettigrew KD, Rapoport SI. Lower limits of cerebrovascular permeability to nonelectrolytes in the conscious rat. American Journal of Physiology-Heart and Circulatory Physiology. 1978;235(3):H299–307.
- Brix G, Semmler W, Port R, Schad LR, Layer G, Lorenz WJ. Pharmacokinetic Parameters in CNS Gd-DTPA Enhanced MR Imaging. Journal of Computer Assisted Tomography. 1991 Jul;15(4):621.
- Hoffmann U, Brix G, Knopp MV, Heβ T, Lorenz WJ. Pharmacokinetic mapping of the breast: a new method for dynamic MR mammography. Magnetic resonance in medicine. 1995;33(4):506–14.
- Aime S, Caravan P. Biodistribution of gadolinium-based contrast agents, including gadolinium deposition. J Magn Reson Imaging. 2009 Dec;30(6):1259–67.
- Branch MA, Coleman TF, Li Y. A Subspace, Interior, and Conjugate Gradient Method for Large-Scale Bound-Constrained Minimization Problems. SIAM J Sci Comput. 1999 Jan;21(1):1–23.
- Lee S, Yoo RE, Choi SH, Oh SH, Ji S, Lee J, et al. Contrast-enhanced MRI T1 Mapping for Quantitative Evaluation of Putative Dynamic Glymphatic Activity in the Human Brain in Sleep-Wake States. Radiology. 2021 Sep;300(3):661–8.
- Wansapura JP, Holland SK, Dunn RS, Ball WS. NMR relaxation times in the human brain at 3.0 tesla. J Magn Reson Imaging. 1999 Apr;9(4):531–8.
- Lu H, Nagae-Poetscher LM, Golay X, Lin D, Pomper M, van Zijl PCM. Routine clinical brain MRI sequences for use at 3.0 Tesla. Journal of Magnetic Resonance Imaging. 2005;22(1):13–22.
- Wang X, Rosenzweig S, Scholand N, Holme HCM, Uecker M. Model‐based reconstruction for simultaneous multi‐slice mapping using single‐shot inversion‐recovery radial FLASH. Magnetic Resonance in Med. 2021 Mar;85(3):1258–71.
- Benjamini Y, Yekutieli D. The Control of the False Discovery Rate in Multiple Testing under Dependency. The Annals of Statistics. 2001;29(4):1165–88.
Figures