3208
Influence of Contrast-Related MRI Pulse Parameters on Signal Enhancement by Gadolinium-Based Contrast Agent in Post-Contrast MRI Sequences1Gangnam Severance Hospital, Yonsei University College of Medicine, Seoul, Korea, Republic of, 2Ewha Womans University Seoul Hospital, Seoul, Korea, Republic of
Synopsis
Keywords: Contrast Agents, Contrast Agent
Motivation: The correlations between signal enhancement by gadolinium (Gd) complexes and pulse sequences or parameters are not well elucidated.
Goal(s): To investigate the influence of repetition time (TR), echo time (TE), inversion time (TI) and flip angle (FA) on signal intensity corresponding to Gd concentration.
Approach: Phantom containing various Gd concentration solutions was scanned using pulse sequences with various TR, TE, TI and FA.
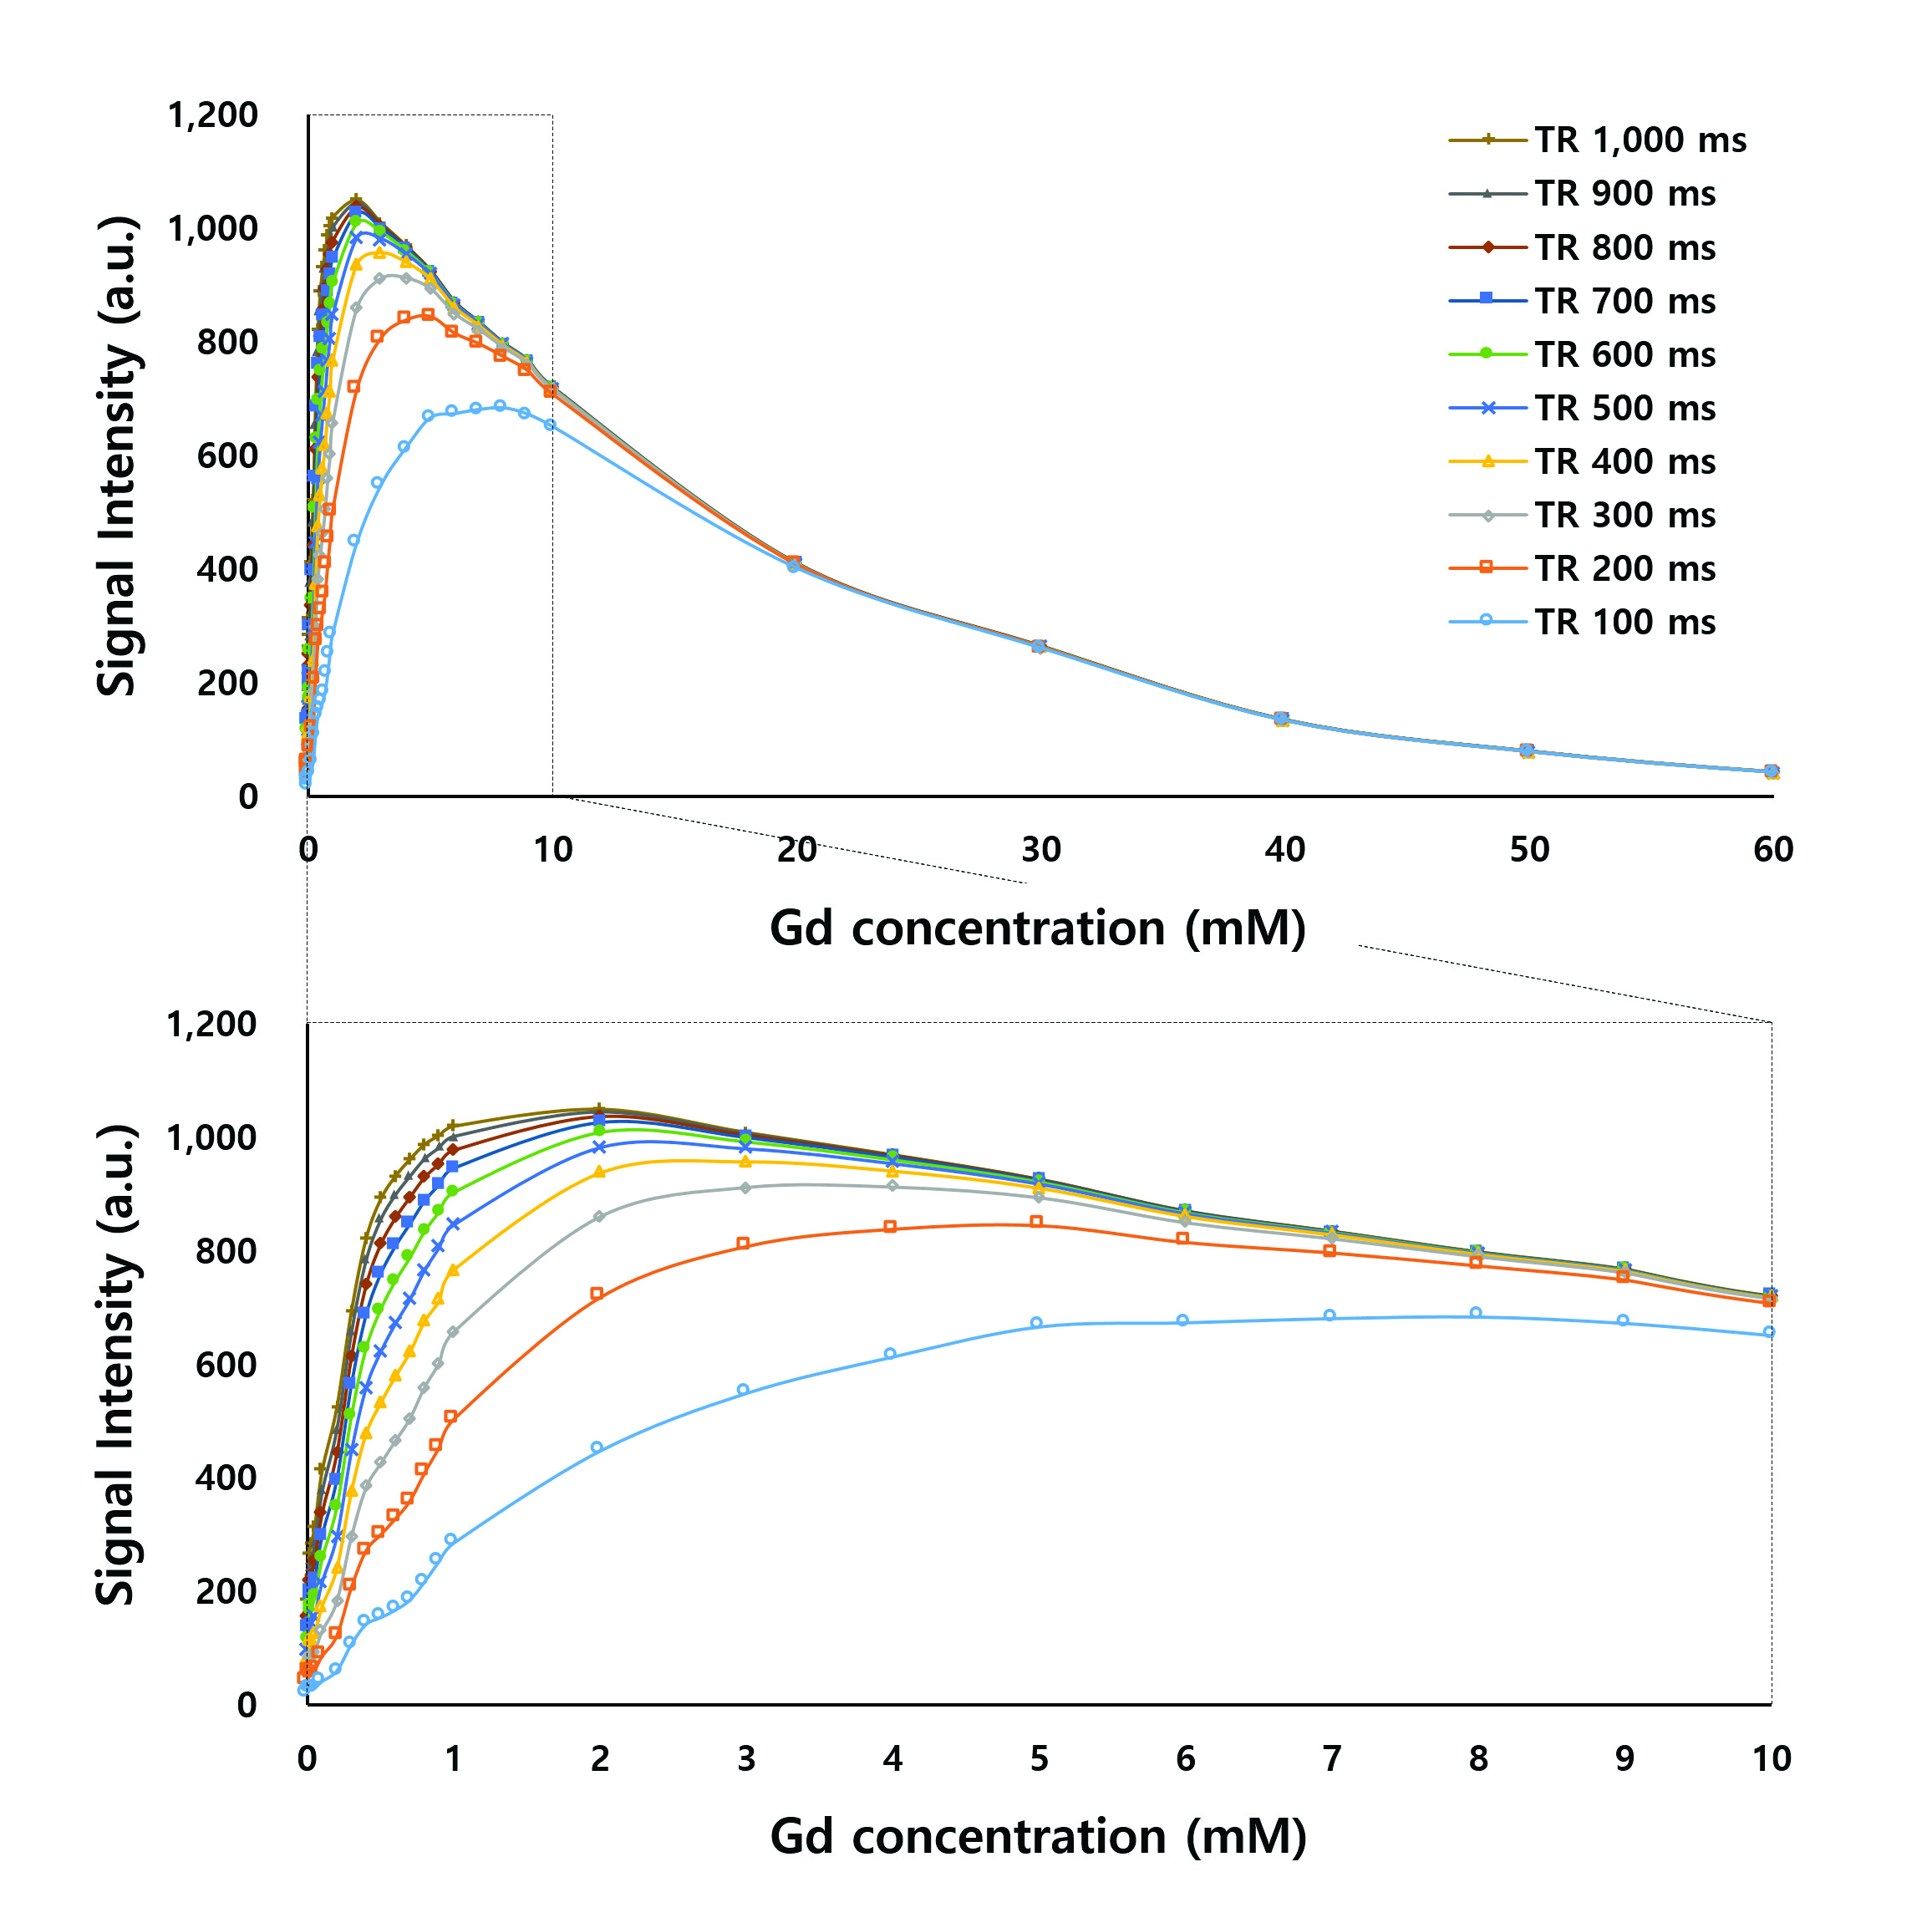
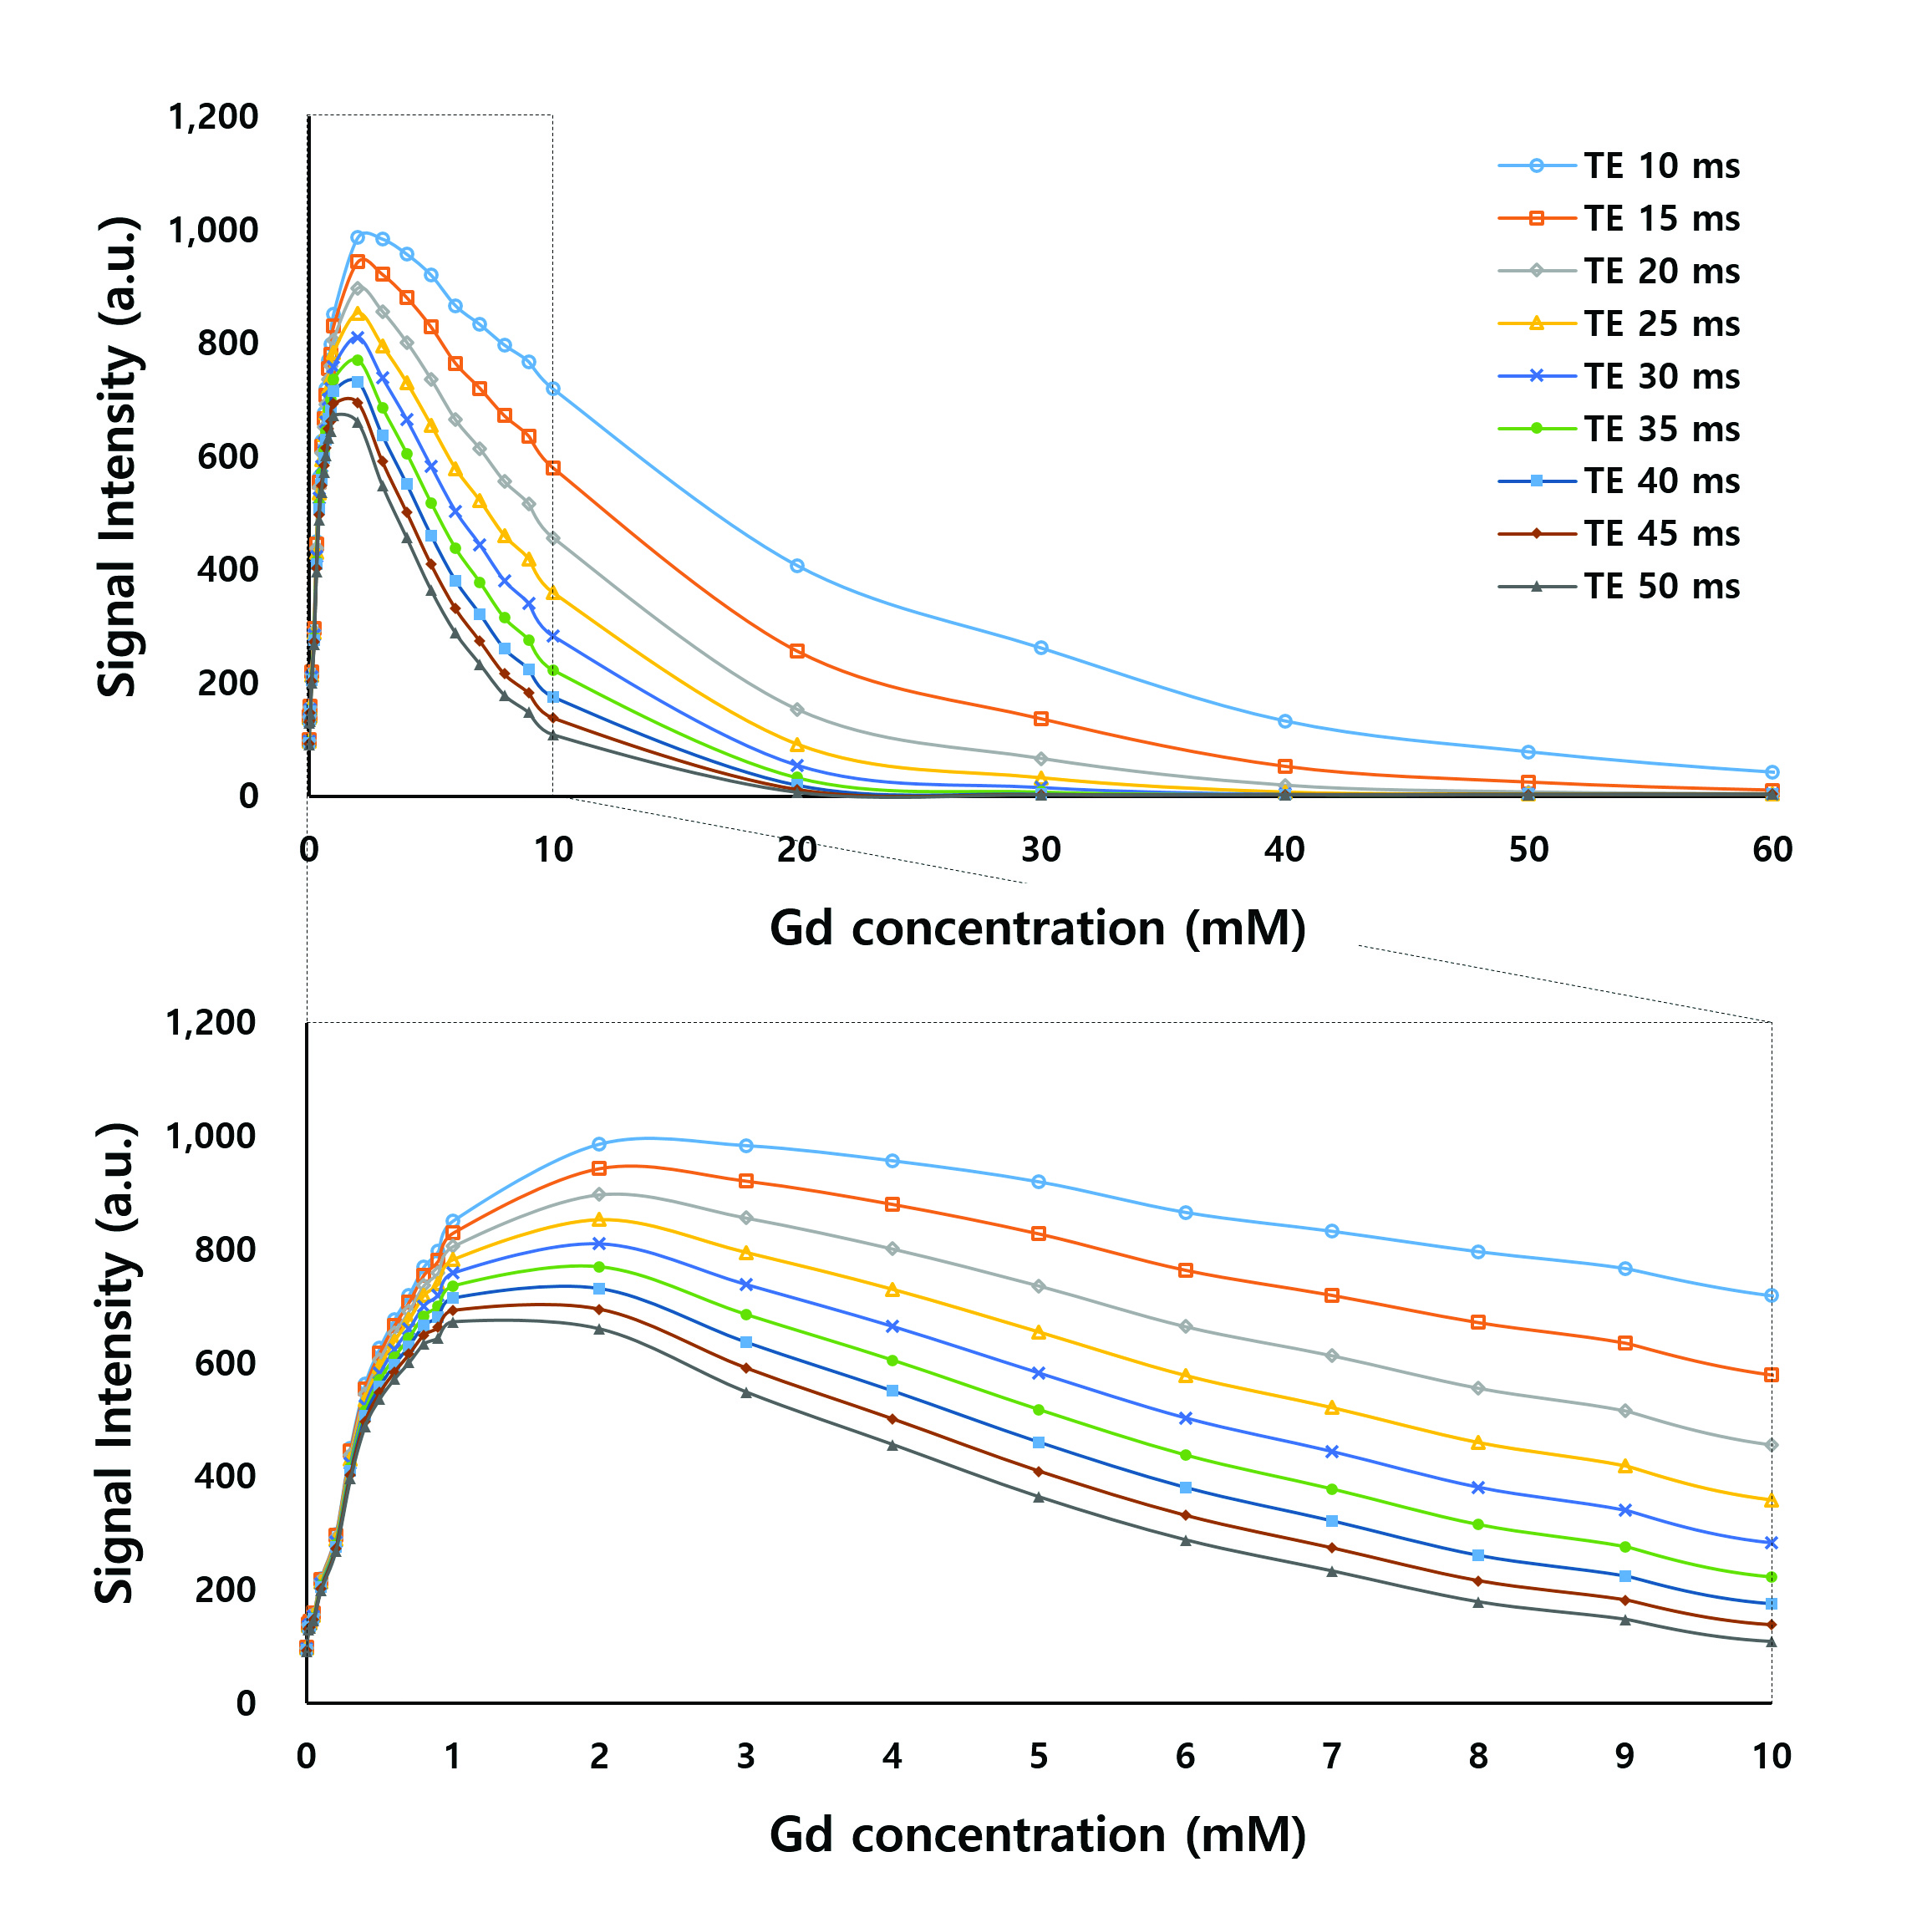
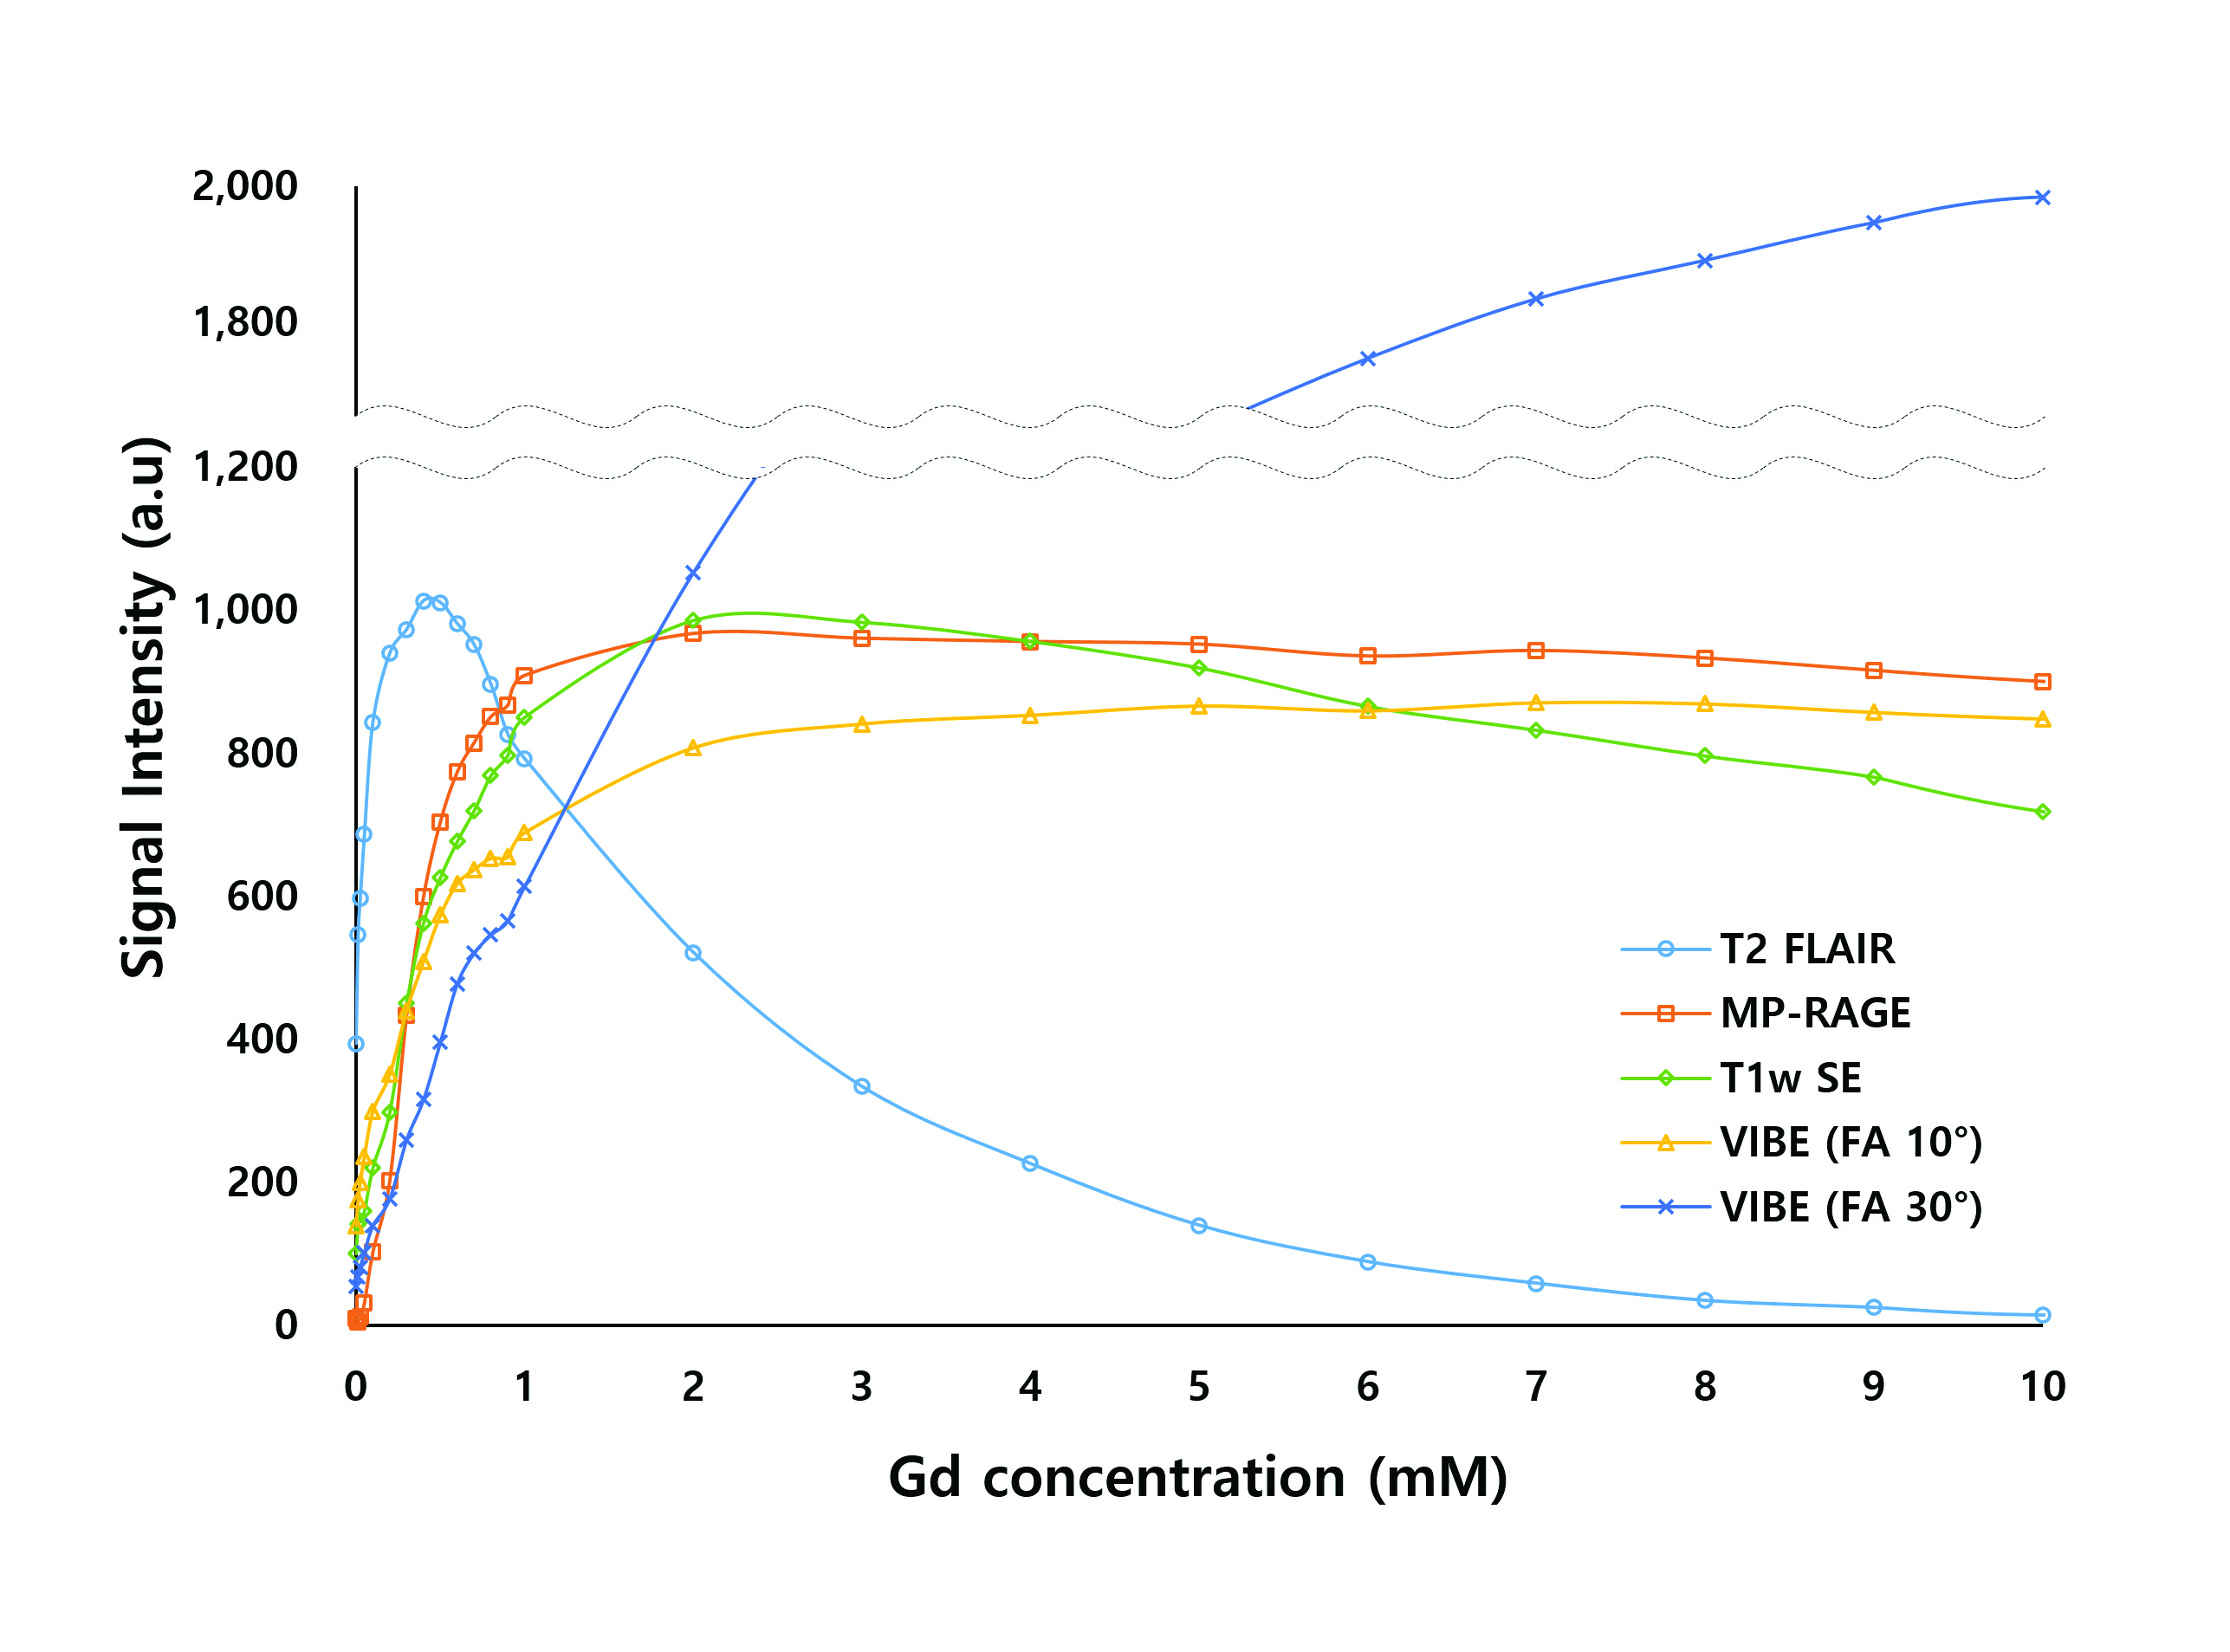
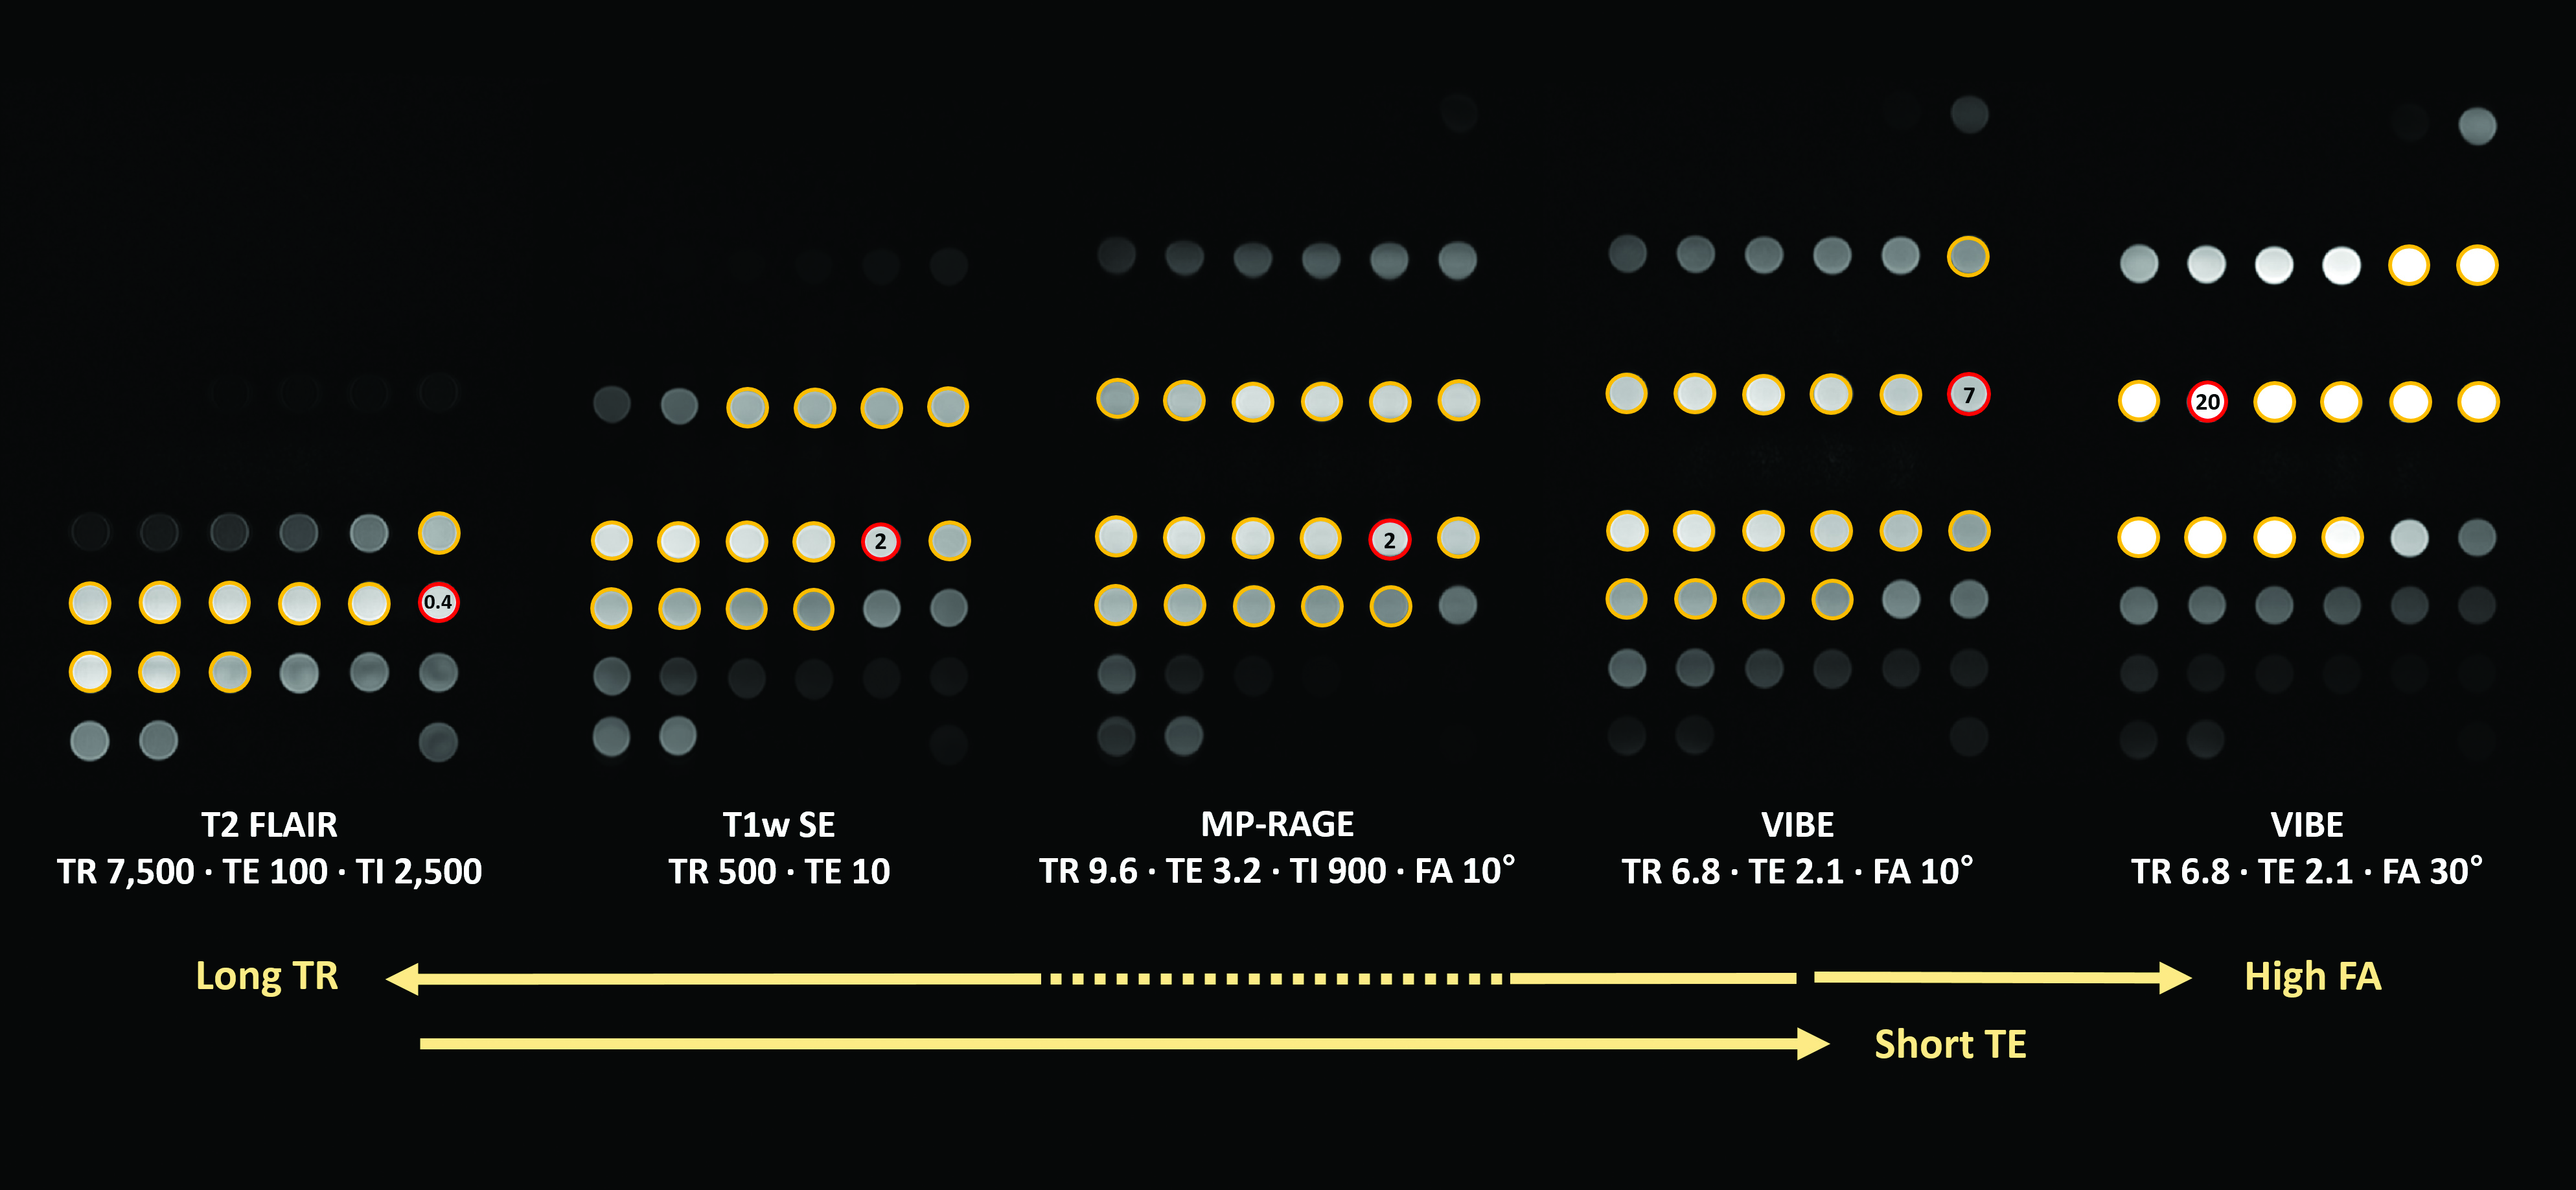
Results: Pulse sequences with longer TR and shorter TE increased signal intensity in lower and higher Gd concentrations, respectively. Application of longer TI and higher FA increased signal intensity at lower and higher Gd concentrations, respectively.
Impact: Pulse sequences with long TR, long TI or low FA can improve SE in human tumor tissue with Gd concentrations less than 2 mM, while high FA is appropriate in high Gd concentration environments such as MR angiography.
Purpose: To investigate the influence of repetition time (TR), echo time (TE), inversion time (TI), and flip angle (FA) on signal intensity (SI) corresponding to gadolinium (Gd) concentration, and to determine how these parameters should be adjusted to maximize signal enhancement over a target range of Gd concentration in each post-contrast sequence.
Methods: The phantom with 38 vials containing gadoterate meglumine solutions in various concentrations from 0.0125 mM to 500 mM was scanned by two 3.0T MRI scanners using following sequences: conventional spin echo (SE) with various TRs (from 100 ms to 1,000 ms), TEs (from 10 ms to 50 ms), T2-weighted fluid-attenuated inversion recovery (T2 FLAIR), 3D ultrafast spoiled gradient echo (3D SPGR) with and without magnetization preparation, and 3D volume interpolated SPGR with various FAs (from 10° to 50°). Peak SI (PSI), Gd concentration showing PSI (GdC-PSI), and Gd concentration range showing the effective signal enhancement (GdCR-EE) were determined on SI versus Gd concentration (SI-GdC) curve of each imaging. Computed simulation was performed to validate the results from the phantom scans. Pearson’s correlation analysis was used to evaluate the associations between the measured and calculated values and sequentially increasing pulse parameters of TR, TE, and FA.
Results: SE with longer TR yielded lower GdC-PSI (p = 0.004, R2 = 0.659), suggesting the SI can be further enhanced in relatively low Gd concentration range when longer TR is applied. SE with shorter TE yielded increased GdCR-EE (p = 0.001, R2 = 0.821), suggesting that SI can be maintained over a wider range of Gd concentration when shorter TE is applied. T2 FLAIR with long TR and long TE yielded very low GdC-PSI (0.4 mM) and very narrow GdCR-EE (0.061-1.31 mM). MP-RAGE decreased signal enhancement at relatively low Gd concentrations due to invasion recovery. Application of higher FA in 3D SPGR was more effective at higher Gd concentrations.
Conclusion: Post-contrast MRI sequences exhibited different SI corresponding to Gd concentration according to TR, TE and FA. Pulse sequences with long TR, long TI or low FA can improve SE in human tumor tissue with Gd concentrations less than 2 mM, while high FA is appropriate in high Gd concentration environments such as MR angiography.
Acknowledgements
No acknowledgement found.References
1. Shahbazi-Gahrouei D, Williams M, Allen BJ. In vitro study of relationship between signal intensity and gadolinium-DTPA concentration at high magnetic field strength. Australas Radiol 2001;45:298-304.
2. Nazarpoor M, Poureisa M, Daghighi MH. Comparison of maximum signal intensity of contrast agent on t1-weighted images using spin echo, fast spin echo and inversion recovery sequences. Iran J Radiol 2012;10:27-32.
3. Jeong HK, Lee KH, Kim MH, Kim SH, Kim MG, Kim HC. Signal Intensity of Contrast Enhancement according to TE in 3.0T MRI T1 Imaging. Applied Sciences 2018;8:1138.
Figures