3206
Exploring Regional Homogeneity and Functional Connectivity Changes following Contrast Agent Injection: A Pilot Resting-State fMRI Study1Department of Diagnostic Radiology and Nuclear Medicine, University of Maryland Baltimore, Baltimore, MD, United States, 2Center for Advanced Imaging Research, University of Maryland Baltimore, Baltimore, MD, United States
Synopsis
Keywords: Contrast Agents, Contrast Agent, Regional Homogeneity, Functional Connectivity
Motivation: Contrast agents are widely used to increase the contrast difference between normal and abnormal tissues. Existing literature primarily focuses on the structural and perfusion effects of CAs, leaving a knowledge gap regarding their potential functional repercussions.
Goal(s): We aimed to explore the potential impact of CA administration on brain function.
Approach: We applied a combination of regional homogeneity, ROI-to-ROI, and seed-to-voxel FC analyses to rs-fMRI data from five participants before and after CA injection.
Results: Our ReHo analysis showed no significant changes of local connectivity pattern, while ROI-to-ROI and seed-to-voxel FC analyses did yield significant FC changes at network level after CA administration.
Impact: Even though the small sample size, our findings may raise an intriguing possibility that CA may indeed have the potential to influence brain function, particularly when examined at a network level.
Introduction
Magnetic resonance imaging (MRI) contrast agents (CA) are widely used to increase the contrast difference between normal and abnormal tissues [1]. Existing literature primarily focuses on the structural and perfusion effects of contrast agents, leaving a knowledge gap regarding their potential effect to brain functional measurements with resting state fMRI (rs-fMRI). This study aims to address this gap by examining the changes in regional homogeneity (ReHo), ROI-to-ROI and seed-to-voxel functional connectivity (FC) in human brain before and after the administration of CA.Methods
Subjects: Five subjects (age of 34.80 ± 16.39 years, 4 Female/1 Male, and 20.60 ± 6.07 years of education) were included in this study.MRI Data Acquisition: All the MRI scans were performed on a Siemens Prisma 3T MRI scanner (Siemens, Erlangen, Germany). Contrast agent Gadavist was administered with typical dose (0.1 mmol/kg of body weight) at a rate of approximately 3 mL/second. The rs-fMRI data were acquired before and 12 mins after CA injection using a 2D multi-band EPI sequence with TR/TE = 943/30 ms, resolution = 3.0 × 3.0 × 3.0 mm3, slice-acceleration factor = 4, and 500 volumes. The 3D MPRAGE T1w images were acquired with TR/TE = 4000/3.37 ms, TI = 1400 ms, resolution = 1.0 ×1.0 × 1.0 mm3.
MRI Data Preprocessing and Denoising: The rs-fMRI images were preprocessed and denoised using CONN Toolbox 22a [5], including realignment, slice-timing correction, outlier identification, direct normalization into standard MNI152 template space with resolution of 2x2x2 mm3, and spatial smoothing with 6mm FWHM Gaussian kernel. The T1w images were segmented into GM, WM and CSF. The aCompcor was used for denoising with signal confounders derived from WM and CSF, motion parameters, and the identified outlier scans. Additionally, a band-pass filter (0.008 Hz < f <0.09 Hz) was applied. Finally, a quality-control procedure was performed.
ReHo Analysis: We computed ReHo maps by assessing Kendall's coefficient of concordance (KCC) for each voxel and its 27 neighboring voxels for each subject.
ROI-to-ROI FC Analysis: We utilized 32 network-based ROIs from the CONN toolbox. Pairwise FC was calculated using Pearson correlation and normalized with Fisher-Z transformation. To compare FC changes before and after CA injection, two methods were used: ROIs within the FC matrix were organized either according to the a priori order/groups in CONN networks or through automatic sorting using hierarchical clustering based on ROI-to-ROI anatomical proximity or functional similarity metrics.
ROI-to-Voxel FC Analysis: We selected the posterior cingulate gyrus (PCC) within the Default Mode Network (DMN) as the seed ROI. FC between the seed and the entire brain was computed for each participant.
Statistical Analysis: Group analysis comparing before and after CA injection was performed using a pair-wised T-test with an uncorrected p-value threshold of <0.005 and a cluster-wise FDR p-value <0.05 for multiple comparisons correction.
Results
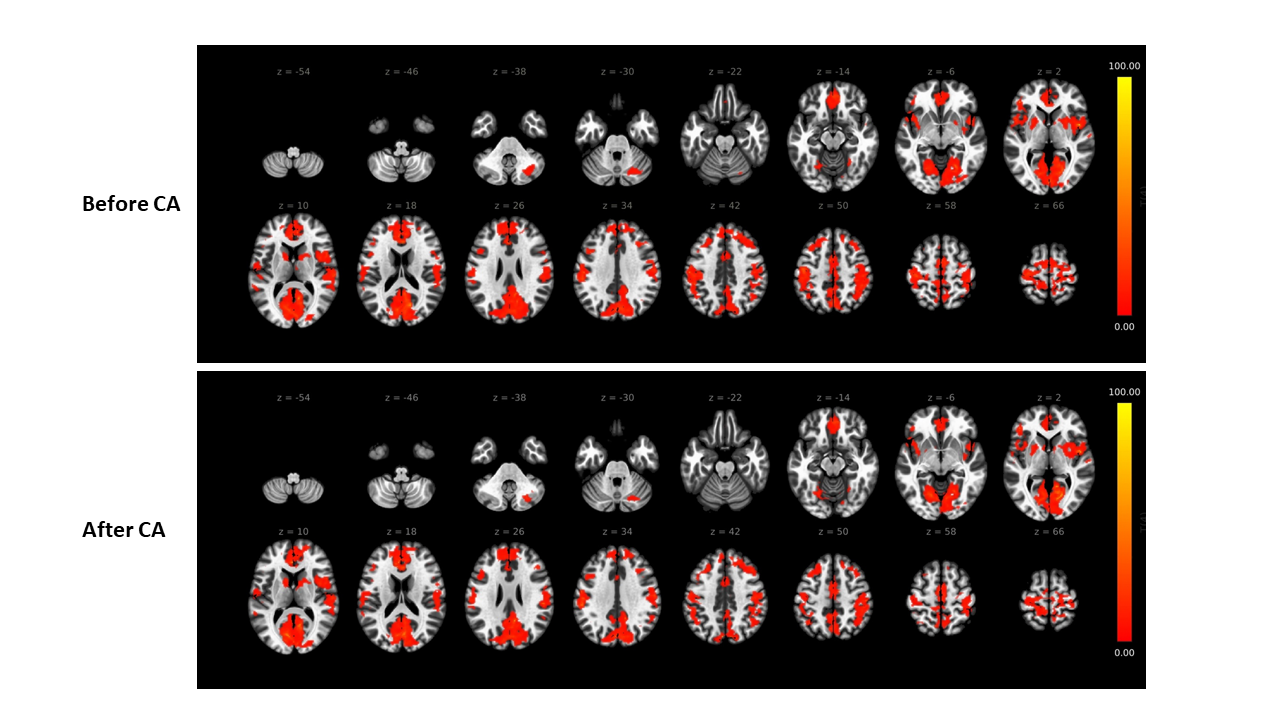
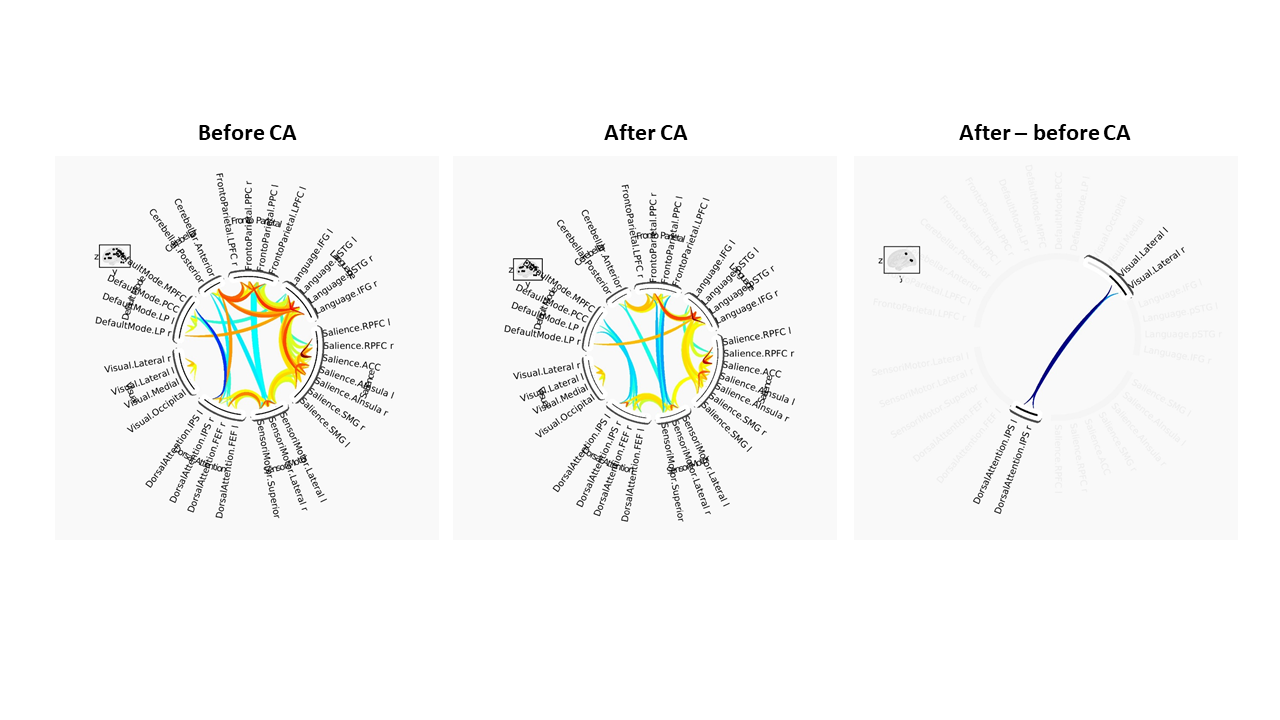
Figure 1 displays the ReHo maps before and after the injection of Gd contrast agent. No significant differences in ReHo were observed.In Figure 2, the results of ROI-to-ROI FC analysis are presented. When the ROIs in the FC matrix were sorted based on a priori CONN networks order/groups, no significant differences were found. However, when ROIs were sorted using hierarchical clustering procedures, we observed reduced FC specifically between the Intraparietal Sulcus (IPS) region of the Dorsal Attention network and the lateral part of the Visual Network.
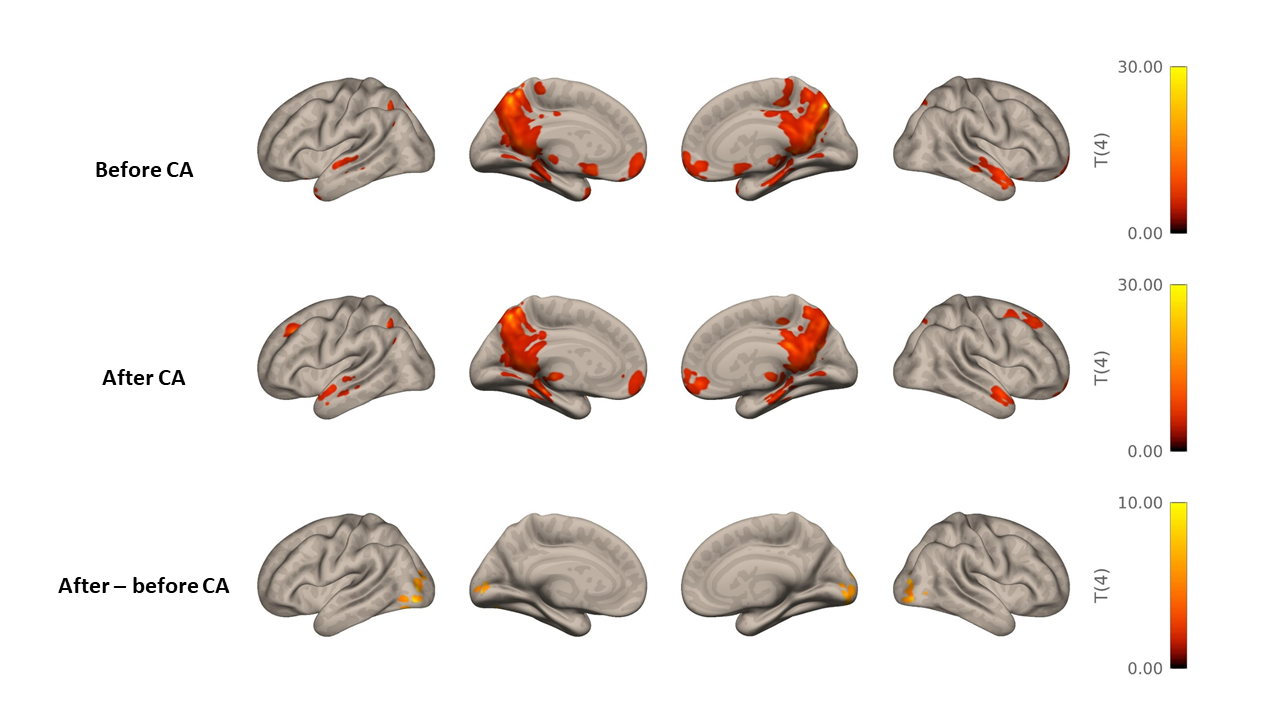
In Figure 3, the results of the analysis focusing on the Default Mode Network (DMN) posterior cingulate cortex (PCC) to whole brain functional connectivity are presented. Our analysis revealed a significant reduction in FC between the DMN PCC and the inferior posterior occipital cortex.
Discussion
In this study, we aimed to explore the potential impact of contrast agent (CA) administration on brain function using a combination of ReHo, ROI-to-ROI FC, and seed-to-voxel FC analysis. The absence of significant changes in ReHo suggests that the contrast agent may have a limited impact on the local connectivity patterns of the brain. In contrast, our ROI-to-ROI and seed-to-voxel FC analyses did yield significant differences in brain function pre- and post-CA injection. These findings indicate that when considering the broader network-level interactions of the brain, there are discernible alterations induced by CA.Even though the small sample size, our findings may raise an intriguing possibility that CA may indeed have the potential to influence brain function, particularly when examined at a network level. The precise mechanisms underlying these effects remain to be elucidated, and future studies could increase sample size and delve into the pharmacological and physiological changes induced by contrast agents in the brain.
Acknowledgements
The study was conducted at University of Maryland School of Medicine Center for Innovative Biomedical Resources, Translational Research in Imaging @ Maryland (CTRIM) – Baltimore, Maryland. The study was supported by NIH grant 5R01NS105503.References
1. Xiao, Y.D., et al., MRI contrast agents: Classification and application (Review). Int J Mol Med, 2016. 38(5): p. 1319-1326.
2. Sorensen, A.G., et al., Contrast agents in functional MR imaging. J Magn Reson Imaging, 1997. 7(1): p. 47-55.
Figures