3202
Assessing Regional Lung Function with Chemical Shift Imaging - Chemical Shift Saturation Recovery (CSI-CSSR) Using Hyperpolarized Xenon-1291University of Pennsylvania, Philadelphia, PA, United States
Synopsis
Keywords: Hyperpolarized MR (Gas), Hyperpolarized MR (Gas)
Motivation: Chemical shift saturation recovery (CSSR) MR spectroscopy using hyperpolarized xenon-129 (HXe) is sensitive to abnormal lung function but lacks regionality.
Goal(s): Add regional information to CSSR MR spectroscopy with variable echo time (TE) chemical shift imaging (CSI).
Approach: Comparison of CSI-CSSR to global CSSR measurements in the lungs of a healthy and an irradiated rat.
Results: CSI-CSSR yields results comparable to whole-lung CSSR spectroscopy but with added regionality.
Impact: CSI-CSSR allows the regional quantification of apparent alveolar septal wall thickness, T2*, and resonance frequency shifts. This approach greatly enhances the sensitivity for the detection of abnormal xenon gas-exchange processes in heterogeneous lung disease.
Purpose
Chemical shift saturation recovery (CSSR) MR spectroscopy, utilizing hyperpolarized xenon-129 (HXe), exhibits sensitivity to abnormal lung function1-9. Typically, measurements involve selective saturation of xenon magnetization dissolved in lung parenchyma at around 200 ppm using a narrow-bandwidth 90° radio frequency (RF) pulse. Subsequent signal recovery is quantified via spectral acquisitions after varied delay times, allowing the extraction of peak characteristics, including T2* relaxation times and resonance center frequencies. Theoretical gas exchange models10,11 are applied to signal regrowth for apparent alveolar septal wall thickness (aSWT) calculations. However, CSSR's global metrics pose limitations for heterogeneous lung disease assessment. This study explores the integration of CSSR with both fixed and variable echo time chemical shift imaging (CSI) to enhance local evaluation, testing the combined approach in a rat model of radiation-induced lung injury (RILI) alongside a healthy control.Methods
A male Sprague-Dawley rat was subjected to 20 Gy single-fraction irradiation targeting the right lung using a small-animal radiotherapy device (SARRP, Xstrahl), followed by a 6-week incubation to promote RILI development. To expose the right lung, we placed a custom lead shield with a cut-out over the animal during irradiation. Six weeks post-irradiation, both the treated rat and an age-matched healthy control were anesthetized, intubated, and ventilated with a homemade respirator, alternating between air (non-imaging periods) and a hyperpolarized xenon (HXe) gas mixture (21% O2, 79% N2/HXe) during imaging. The imaging was conducted on a 3 T Bruker Biospec MRI system using HXe gas polarized by a XeBox-E10 optical pumping system (Xemed LLC, NH). Our protocols were approved by the Institutional Animal Care and Use Committee of the University of Pennsylvania.Custom MR pulse sequences captured the data. After four xenon wash-in breaths, we induced a 5-second end-inspiratory breath-hold, during which a 90° Gaussian RF pulse (0.913 ms duration) at 205 ppm saturated the dissolved xenon. A variable delay (Δτ from 1.15 to approximately 300 ms) preceded a 90° RF excitation pulse of the same frequency and 0.4 ms duration. For global CSSR measurements, we recorded a free induction decay (50 kHz receiver bandwidth, 31.56 ms sampling duration), averaging eight acquisitions. The 2D coronal CSI projections (16×16 matrix, 50×50 mm2 field of view, 1578 sampling points, 0.35 ms TE) were obtained by following the excitation pulse with phase-encoding gradients and a 31.56 ms sampling period. In the control rat we also investigated a variable TE acquisition with the TE ranging from 0.2 ms at k-space center to 0.35 ms at the k-space corners. Post-Fourier transformation, we fitted the spectra with Lorentzian line shapes and integrated the areas under the gas phase (GP, 0 ppm), membrane (Mem, 197 ppm), and red blood cell (RBC, 211 ppm) peaks to calculate the apparent alveolar septal wall thickness (aSWT), employing the Patz et al. analytical uptake model10.
Results and Discussion
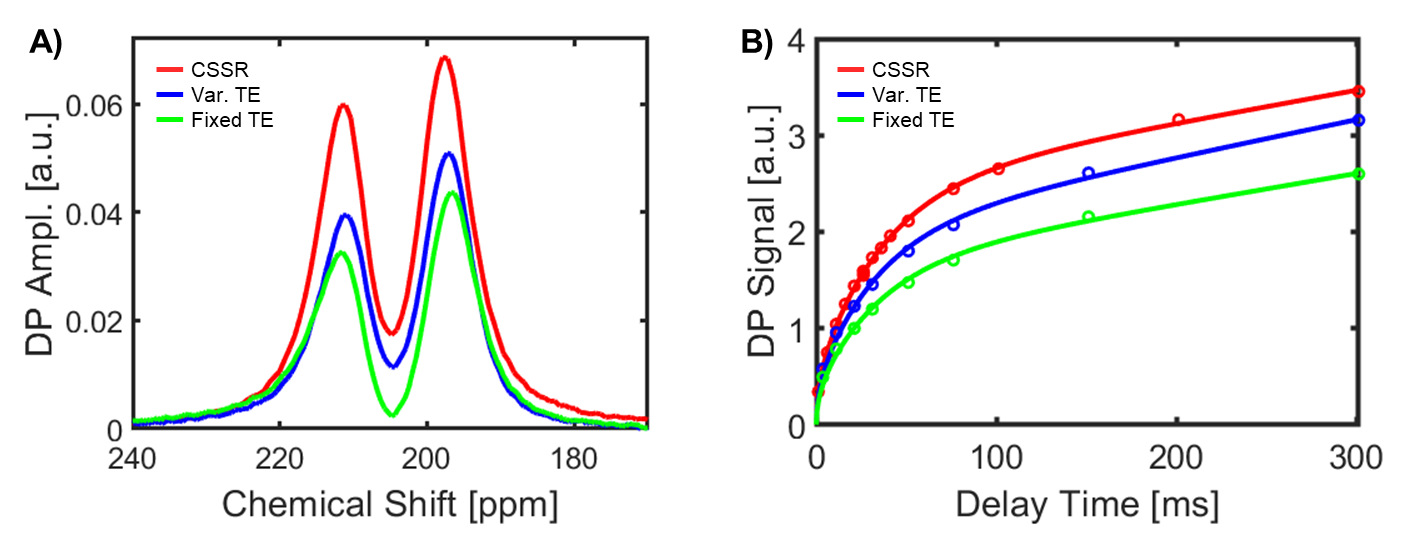
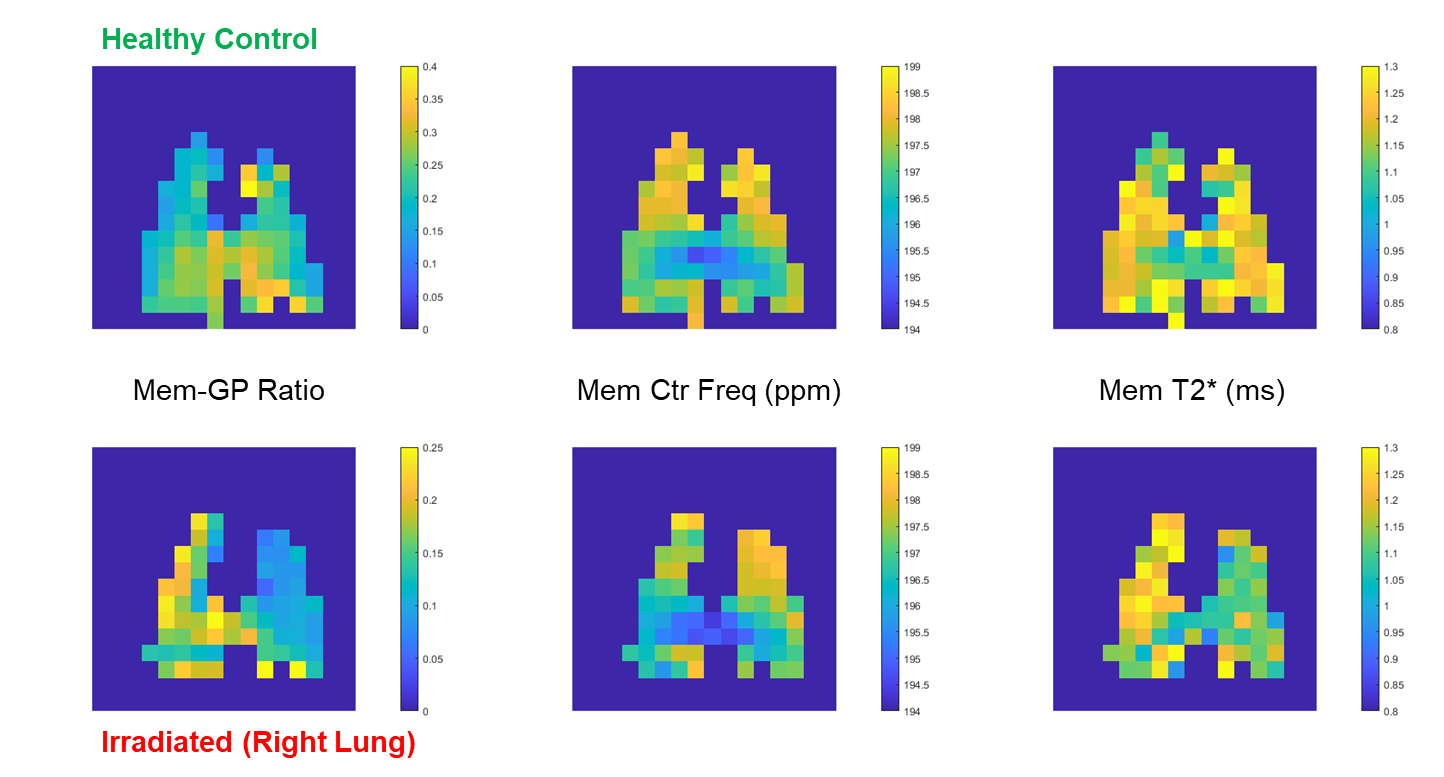
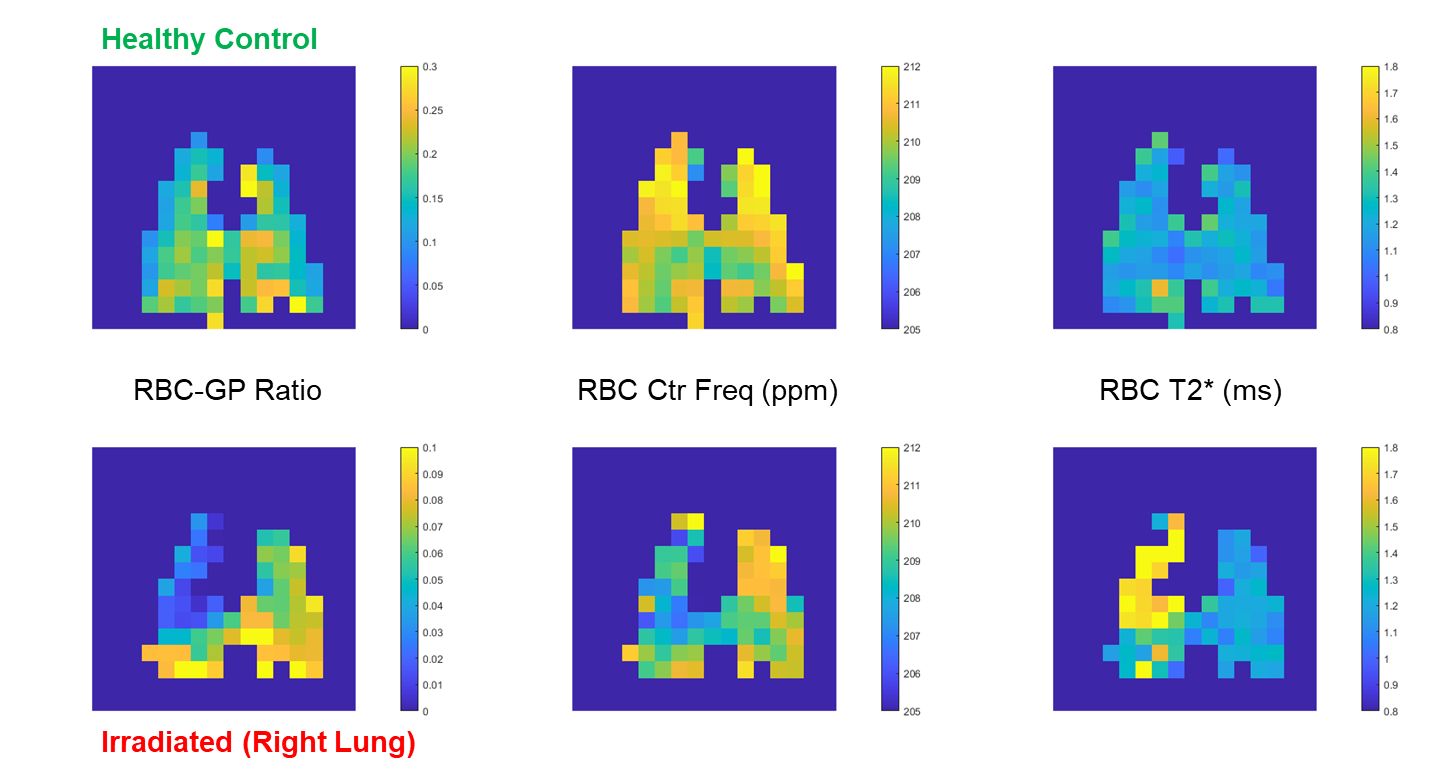
Figure 1 illustrates the dissolved-phase spectra (Figure 1A) and signal recovery curves (Figure 1B) for the control rat using both the global CSSR and the fixed and variable TE CSI sequences, with averages taken across all pixels. Qualitatively, the signal from the variable TE measurement exhibited a 15-20% increase compared to the fixed TE. Notably, signal intensity from the CSSR acquisition was over twice as high, which can be attributed to reduced T2* relaxation effects. The apparent alveolar septal wall thickness (aSWT) calculated for the CSSR method was 10.7 µm, compared to 10.9 µm for the variable TE and 11.1 µm for the fixed TE. In the irradiated rat, the aSWT was markedly increased to 60.6 µm in the right apex, the region most affected by radiation, while remaining at 10 µm in other areas. The CSSR measurement yielded a global average of 25.4 µm. Figure 2 compares coronal maps showing the membrane-to-gas-phase ratio, the center frequency of the membrane, and the T2* values of the membrane for both control and irradiated subjects. Figure 3 presents corresponding maps for the red blood cell (RBC) signal, underscoring the pronounced sensitivity of these metrics to radiation-induced damage, as evidenced by changes in aSWT.Conclusion
Our preliminary study demonstrates the efficacy of combining CSSR MR spectroscopy with CSI techniques to assess spatially-resolved lung function and structure. The enhanced regional sensitivity of multiple metrics that can be extracted supports the use of HXe CSI-CSSR as a promising tool in the evaluation of heterogeneous lung diseases.Acknowledgements
Supported by NIH grant R01 HL142258.References
[1] Ruppert et al. NMR of hyperpolarized 129Xe in the canine chest: spectral dynamics during a breath-hold. NMR Biomed 2000;13:220-228.
[2] Butler et al. Measuring surface-area-to-volume ratios in soft porous materials using laser-polarized xenon interphase exchange nuclear magnetic resonance. J Phys Condens Matter 2002;14:L297-L304.
[3] Qing et al. Assessment of lung function in asthma and COPD using hyperpolarized 129Xe chemical shift saturation recovery spectroscopy and dissolved-phase MRI. NMR in Biomed 2014;27(12):1490-1501.
[4] Zhong et al. Simultaneous assessment of both lung morphometry and gas exchange function within a single breath‐hold by hyperpolarized 129Xe MRI. NMR in Biomed 2017; 30(8).
[5] Doganay et al. Quantification of regional early stage gas exchange changes using hyperpolarized 129Xe MRI in a rat model of radiation-induced lung injury. Med Phys 2016;43(5):2410-2420.
[6] Kern et al. Regional investigation of lung function and microstructure 129Xe chemical shift saturation recovery parameters by localized and dissolved‐phase imaging: A reproducibility study. MRM 2019; 81(1):13-24.
[7] Ruppert et al. Using Hyperpolarized Xenon-129 MRI to Quantify Early-Stage Lung Disease in Smokers. Acad Radiol 2019; 26(3):355-366.
[8] Kern et al. Mapping of regional lung microstructural parameters using 129 Xe dissolved‐phase MRI in healthy volunteers hyperpolarized and patients with chronic obstructive pulmonary disease. MRM 2018; 81(4):2360-2373.
[9] Zanette et al. Physiological gas exchange mapping of hyperpolarized 129Xe using spiral-IDEAL and MOXE in a model of regional radiation-induced lung injury. Med Phys 2018;45(2):803-816.
[10] Patz et al. Diffusion of hyperpolarized 129Xe in the lung: a simplified model of 129Xe septal uptake and experimental results. New J Physics 2011;13:015009.
[11] Chang. MOXE: A Model of Gas Exchange for Hyperpolarized 129Xe Magnetic Resonance of the Lung. MRM 2013;69:884-890.
Figures