3192
Repeatability of Cardiopulmonary Oscillations Imaged with 129Xe MRI1Medical Physics, Duke University, Durham, NC, United States, 2Duke University, Durham, NC, United States, 3Radiology, Duke University, Durham, NC, United States
Synopsis
Keywords: Hyperpolarized MR (Gas), Hyperpolarized MR (Gas)
Motivation: Keyhole-based 129Xe MR imaging of cardiopulmonary oscillations is a promising technique, but repeatability has not been studied.
Goal(s): To evaluate the repeatability of RBC oscillation amplitude metrics derived from 129Xe MRI across multiple time points and correlate these with dynamic spectroscopy measurements.
Approach: A cohort of 21 participants underwent 129Xe gas exchange MRI and MRS scans using consortium protocols. Repeatability was assessed using Bland-Altman analysis, with Spearman correlation for cross-modality comparison
Results: The study found repeatability to be high for mean oscillation amplitude but moderate for the binning-derived metrics. Image-derived mean oscillation amplitude correlated strongly to that derived from MRS.
Impact: Analysis of 129Xe MRI cardiopulmonary oscillation metrics show moderate repeatability across same-session scans.
Introduction
Hyperpolarized 129Xe MR imaging and spectroscopy have shown promising advancements toward non-invasive evaluation of pulmonary function[1]. These techniques not only illuminate the distribution of xenon in the ventilated airspaces but also provide insights into its uptake in interstitial membrane tissues and subsequent transfer to capillary red blood cells (RBCs). Moreover, the cardiogenic oscillations in the RBC signal measured by spectroscopy offer a novel biomarker for microvascular flow impairment from pulmonary vascular dysfunction, potentially distinguishing between pre- and post-capillary PH[2]. Such differentiation is critical, as it guides the need for right heart catheterization—the invasive gold standard for PH diagnosis[3]. Building on these findings, new keyhole approaches to reconstructing 129Xe gas exchange MRI now further enable spatially resolved mapping of RBC oscillations [4]. However, the determining the repeatability of the associated imaging metrics has not yet been studied. Such measures are essential in establishing their utility for quantitative characterization and monitoring of disease[5]. Thus, this study aims to establish the repeatability of RBC oscillation amplitude imaging metrics.Methods
Image Acquisition and Processing: A cohort of n=27 participants with idiopathic pulmonary fibrosis was retrospectively analyzed. Each subject underwent two 129Xe gas exchange MRI and two dynamic spectroscopy scans within a one-hour period according to consortium protocols[6]. After the baseline visit, participants then initiated antifibrotic medication and were later scanned at the 3-month and 6-month time points. Imaging data were processed using a custom-developed software pipeline designed to reconstruct and quantify RBC oscillations using a linear binning method. This categorizes the continuous spectrum of RBC oscillation amplitudes into discrete, evenly spaced intervals for simplified analysis and visualization. Only participants with an RBC image SNR >3 were considered for analysis, leaving a final n=21 participants to be included.Repeatability Analysis and Statistical Validation: To assess the consistency of our imaging metrics, Bland-Altman analysis focused exclusively on the two baseline scans, providing a controlled comparison free from treatment effects. This analysis evaluated the agreement between four oscillation-derived metrics: the global mean amplitude percentage, the defect percentage, the combined defect and low percentage, and the high percentage. For all four, the coefficient of repeatability (CR) and intraclass correlation coefficient (ICC) were calculated. The mean oscillation amplitudes derived from imaging vs dynamic spectroscopy were compared via Spearman correlation analysis.
Results
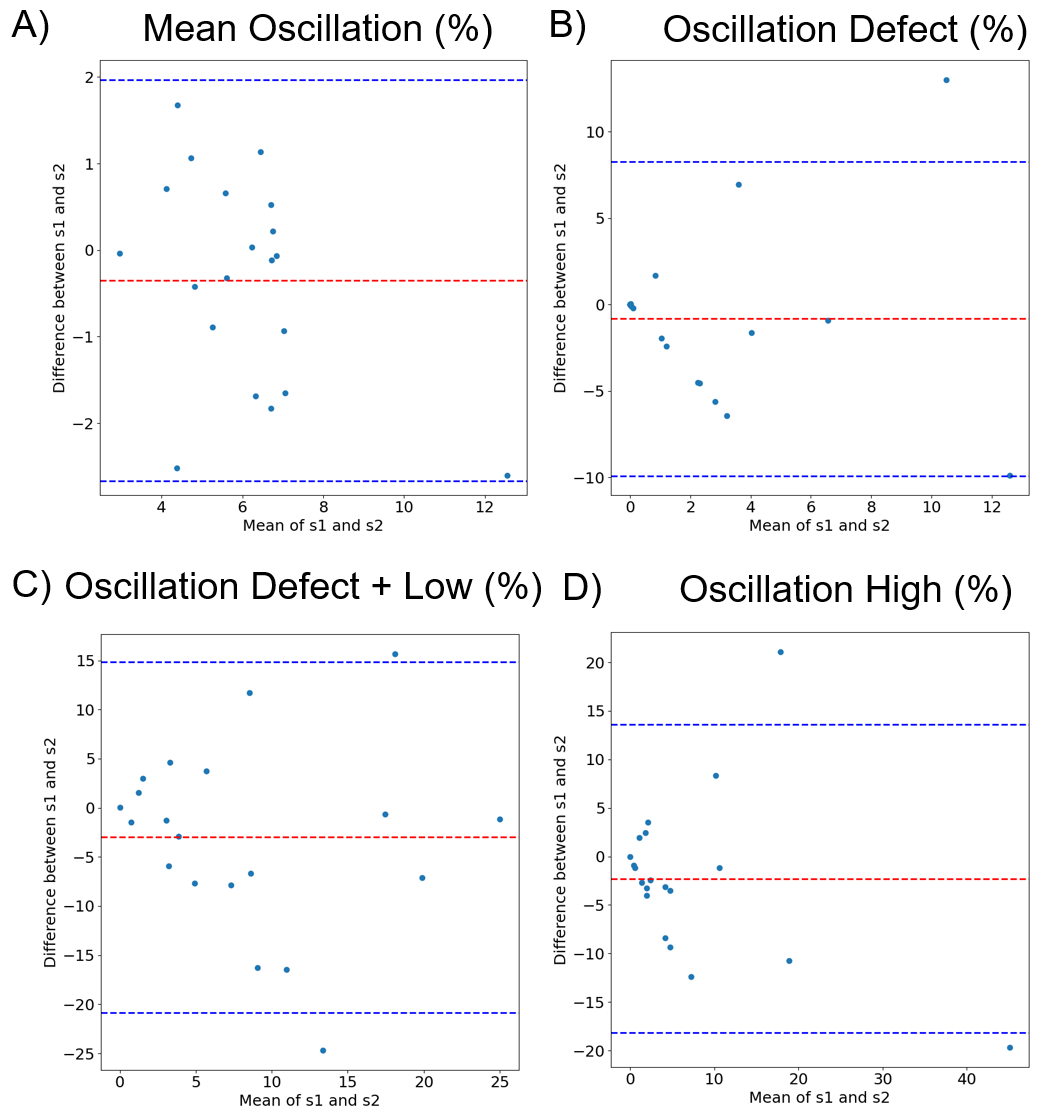
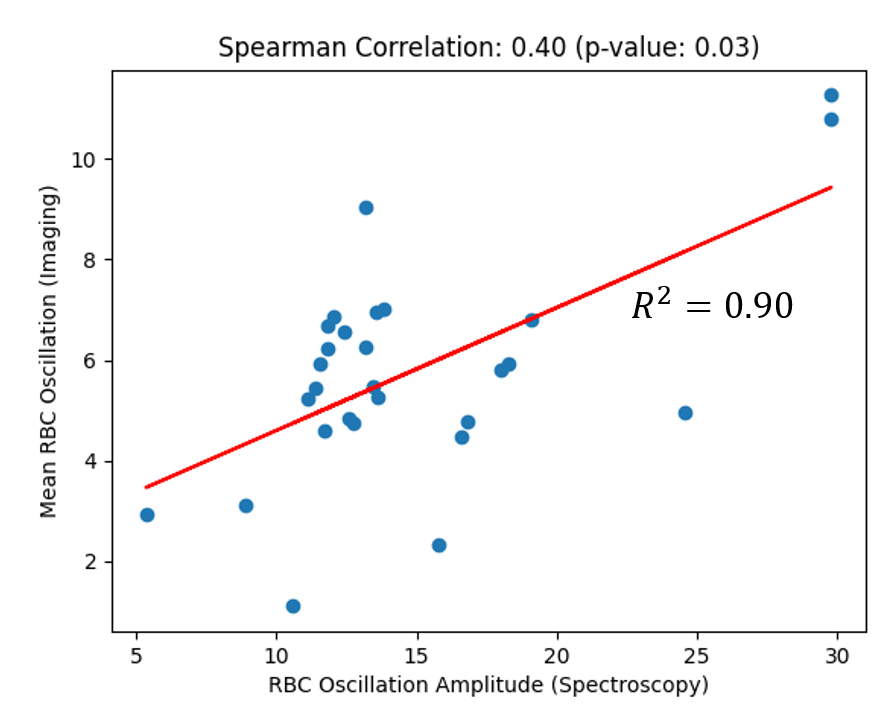
Figure 1 demonstrates an example of a participant exhibiting a large oscillation high percentage consistently across the two baseline, 3-month, and 6-month scans. Bland-Altman analysis indicated a mean difference close to zero for the baseline scans, suggesting no systematic bias between the repeated measures. The CR for the mean oscillation amplitude percentage, defect percentage, combined defect and low percentage, and high percentage were 2.3, 9.1, 17.8, and 15.8, respectively (Figure 2, 3). While there was high consistency for the mean oscillation percentage (ICC=0.93), the consistency was moderate for the high percentage and defect + low percentage (ICC=0.39, 0.27 respectively) and poor for the defect percentage (ICC=0.09).Global mean oscillation amplitude from imaging correlated with peak-to-peak oscillation amplitude derived from dynamic spectroscopy with a correlation coefficient of 0.40 (p= 0.03). The coefficient of determination (R2) was found to be 0.90 (Figure 4).
Discussion
The high repeatability of the mean oscillation amplitude percentage across multiple time points is promising. Similarly, its correlation to the peak-to-peak oscillation amplitude derived from dynamic spectroscopy further reinforces the validity of these techniques in capturing consistent RBC oscillation amplitudes. However, the low repeatability observed for the oscillation defect percentage suggests this metric must be evaluated carefully. This inconsistency may be attributed to the inherent variability in disease pathology or to technical factors such as SNR or radial undersampling limitations. To that end, the defect + low oscillation percentage and high percentage were found to be more repeatable. In addition, the moderate correlation coefficient suggests a positive linear relationship between imaging-derived and spectroscopy-derived oscillation amplitudes, while the high coefficient of determination indicates that imaging measurements reliably predict spectroscopy outcomes.To address current limitations, future work could focus on enhancing the robustness of the oscillation defect measurement. One potential avenue is the application of compressed sensing and deep learning techniques, which can improve image quality in undersampled scenarios relative to keyhole imaging techniques. Another is to apply flip-angle TR equivalence to reduce TR by using the “fast” 1-point Dixon imaging approach to acquire more projections.
Acknowledgements
R01HL105643, R01HL153872, NSF GRFP DGE-2139754References
1. Weatherley, N.D., et al., Hyperpolarised xenon magnetic resonance spectroscopy for the longitudinal assessment of changes in gas diffusion in IPF. Thorax, 2019. 74(5): p. 500-502.
2. Bier, E.A., et al., Noninvasive diagnosis of pulmonary hypertension with hyperpolarised (129)Xe magnetic resonance imaging and spectroscopy. ERJ Open Res, 2022. 8(2).
3. Hoeper, M.M., et al., Complications of right heart catheterization procedures in patients with pulmonary hypertension in experienced centers. J Am Coll Cardiol, 2006. 48(12): p. 2546-52.
4. Niedbalski, P.J., et al., Mapping cardiopulmonary dynamics within the microvasculature of the lungs using dissolved (129)Xe MRI. J Appl Physiol (1985), 2020. 129(2): p. 218-229.
5. Hahn, A.D., et al., Repeatability of regional pulmonary functional metrics of Hyperpolarized (129) Xe dissolved-phase MRI. J Magn Reson Imaging, 2019. 50(4): p. 1182-1190.
6. Niedbalski, P.J., et al., Protocols for multi-site trials using hyperpolarized (129) Xe MRI for imaging of ventilation, alveolar-airspace size, and gas exchange: A position paper from the (129) Xe MRI clinical trials consortium. Magn Reson Med, 2021. 86(6): p. 2966-2986.
Figures
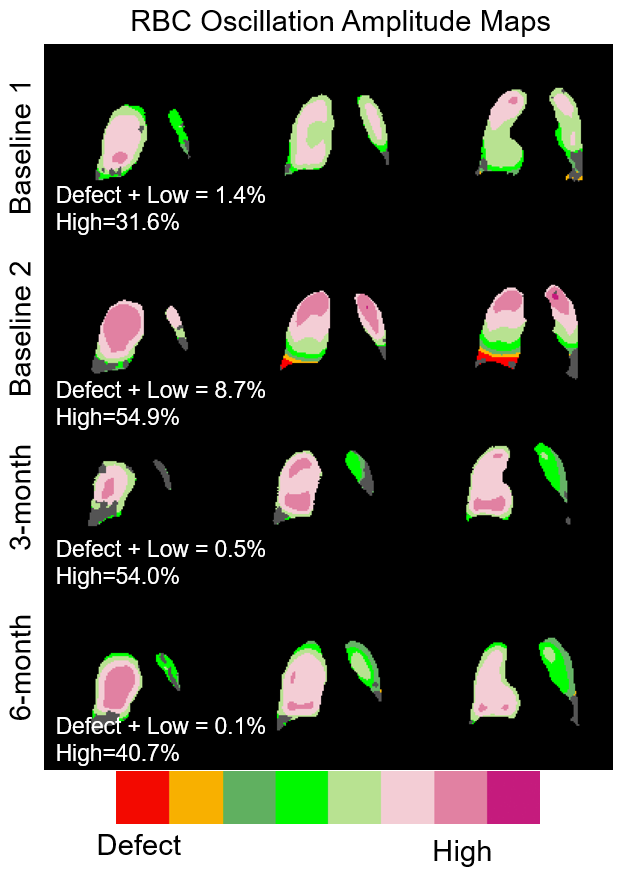
Figure 1: Representative oscillation imaging maps at three different slices of a participant with IPF scanned twice at baseline, 3-months, and 6-month timepoints (top to bottom). The maps consistently show high oscillations in the right lung.
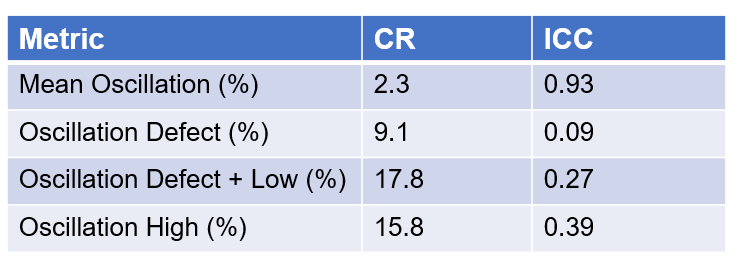
Figure 2: Bland Altman plots indicating repeatability of the a) global mean oscillation percentage, b) oscillation defect percentage c) combined defect + low percentage, and d) high oscillation percentage.