3183
Combining T1 and T2* contrast in dynamic Oxygen-Enhanced MRI (dOE-MRI) to assess Tumour Hypoxia.1Department of Physics & Astronomy, University of British Columbia, Vancouver, BC, Canada, 2Department of Physics, TU Dortmund University, Dortmund, Germany, 3Radiation Biology Unit, British Columbia Cancer Research Centre, Vancouver, BC, Canada, 4Department of Computer Science, Mathematics, Physics and Statistics, University of British Columbia, Kelowna, BC, Canada
Synopsis
Keywords: Oxygenation, Tumor
Motivation: There is a need for non-invasive imaging markers for tumor oxygenation to develop hypoxia-targeted treatment.
Goal(s): Extend dynamic oxygen-enhanced MRI to incorporate T1 and T2* contrast, enhancing our ability to assess tumor tissue oxygenation more effectively.
Approach: Independent Component Analysis maps were used to analyze the signal intensity change in T1 and T2* weighted images for pancreatic PDX tumour models in 26 mice, scanned at 7T.
Results: The results showed a significant correlation between ΔT1 and ΔT2* in two PDX tumor models, but not in another model. This discrepancy is attributed to differences in tissue oxygenation inherent to the PDX tumor models studied.
Impact: This research demonstrates the potential of dynamic oxygen-enhanced MRI to differentiate tissue oxygenation in pancreatic PDX tumor models. It highlights the complexity of the relationship between T1 and T2* signal changes induced by a cyclic gas breathing challenge.
Introduction
Hypoxic tumors with low oxygen levels can exhibit radiotherapy resistance and are associated with poor prognosis. Challenges arise in the clinical evaluation of tumor hypoxia due to the inherent invasiveness of biopsy procedures and the limitations imposed by the cost and accessibility of non-invasive positron emission tomography (PET) imaging techniques.Dynamic oxygen-enhanced MRI (dOE-MRI) can identify hypoxic regions within a tumour xenograft model implanted in mice using the T1 signal change caused by an oxygen gas breathing challenge2.
While T1 shows the influence of dissolved oxygen in plasma and tissue, T2* can show the influence of hemoglobin in the blood. The inclusion of both parameters gives further insight into tumour tissue oxygenation.
Different research groups have explored the correlation between T1 and T2* signal intensity changes in response to a gas breathing challenge. Their results range from a linear relationship observed by Remmelle4 to a mirrored L-shape reported by Burrell5. However, Little et al.6 and Cao-Pham et al.7 discovered a more complicated relationship than the L-shape, while Zhao et al.8 found a linear relationship in some tumor types but not in others.
Here we propose a multi-parametric approach that combines T1 and T2* signal intensity change after a change in breathing air for voxel-by-voxel and slice wise average. The correlation of the signal intensity changes or the lack of allows differentiation between different tumour xenograft models, possibly related to their different levels in tumour tissue oxygenation.
Methods
Twenty-six mice were scanned on a 7T Bruker BioSpec 70/30 scanner at the University of British Columbia MRI Research Center, each bearing one of three pancreatic PDX tumour models (Pancreas Centre BC). A 2D Multi-Gradient Echo sequence was used to obtain T1- and T2*-weighted images. The oxygen gas breathing challenge consisted of sequential two-minute segments over three cycles.Signal time courses were analyzed using Independent Component Analysis (ICA). The best component was determined using the Automated-Component-Selection-Algorithm10. The resulting ICA maps represent voxel contributions to signal intensity changes and were compared to pimonidazole-stained histology images.
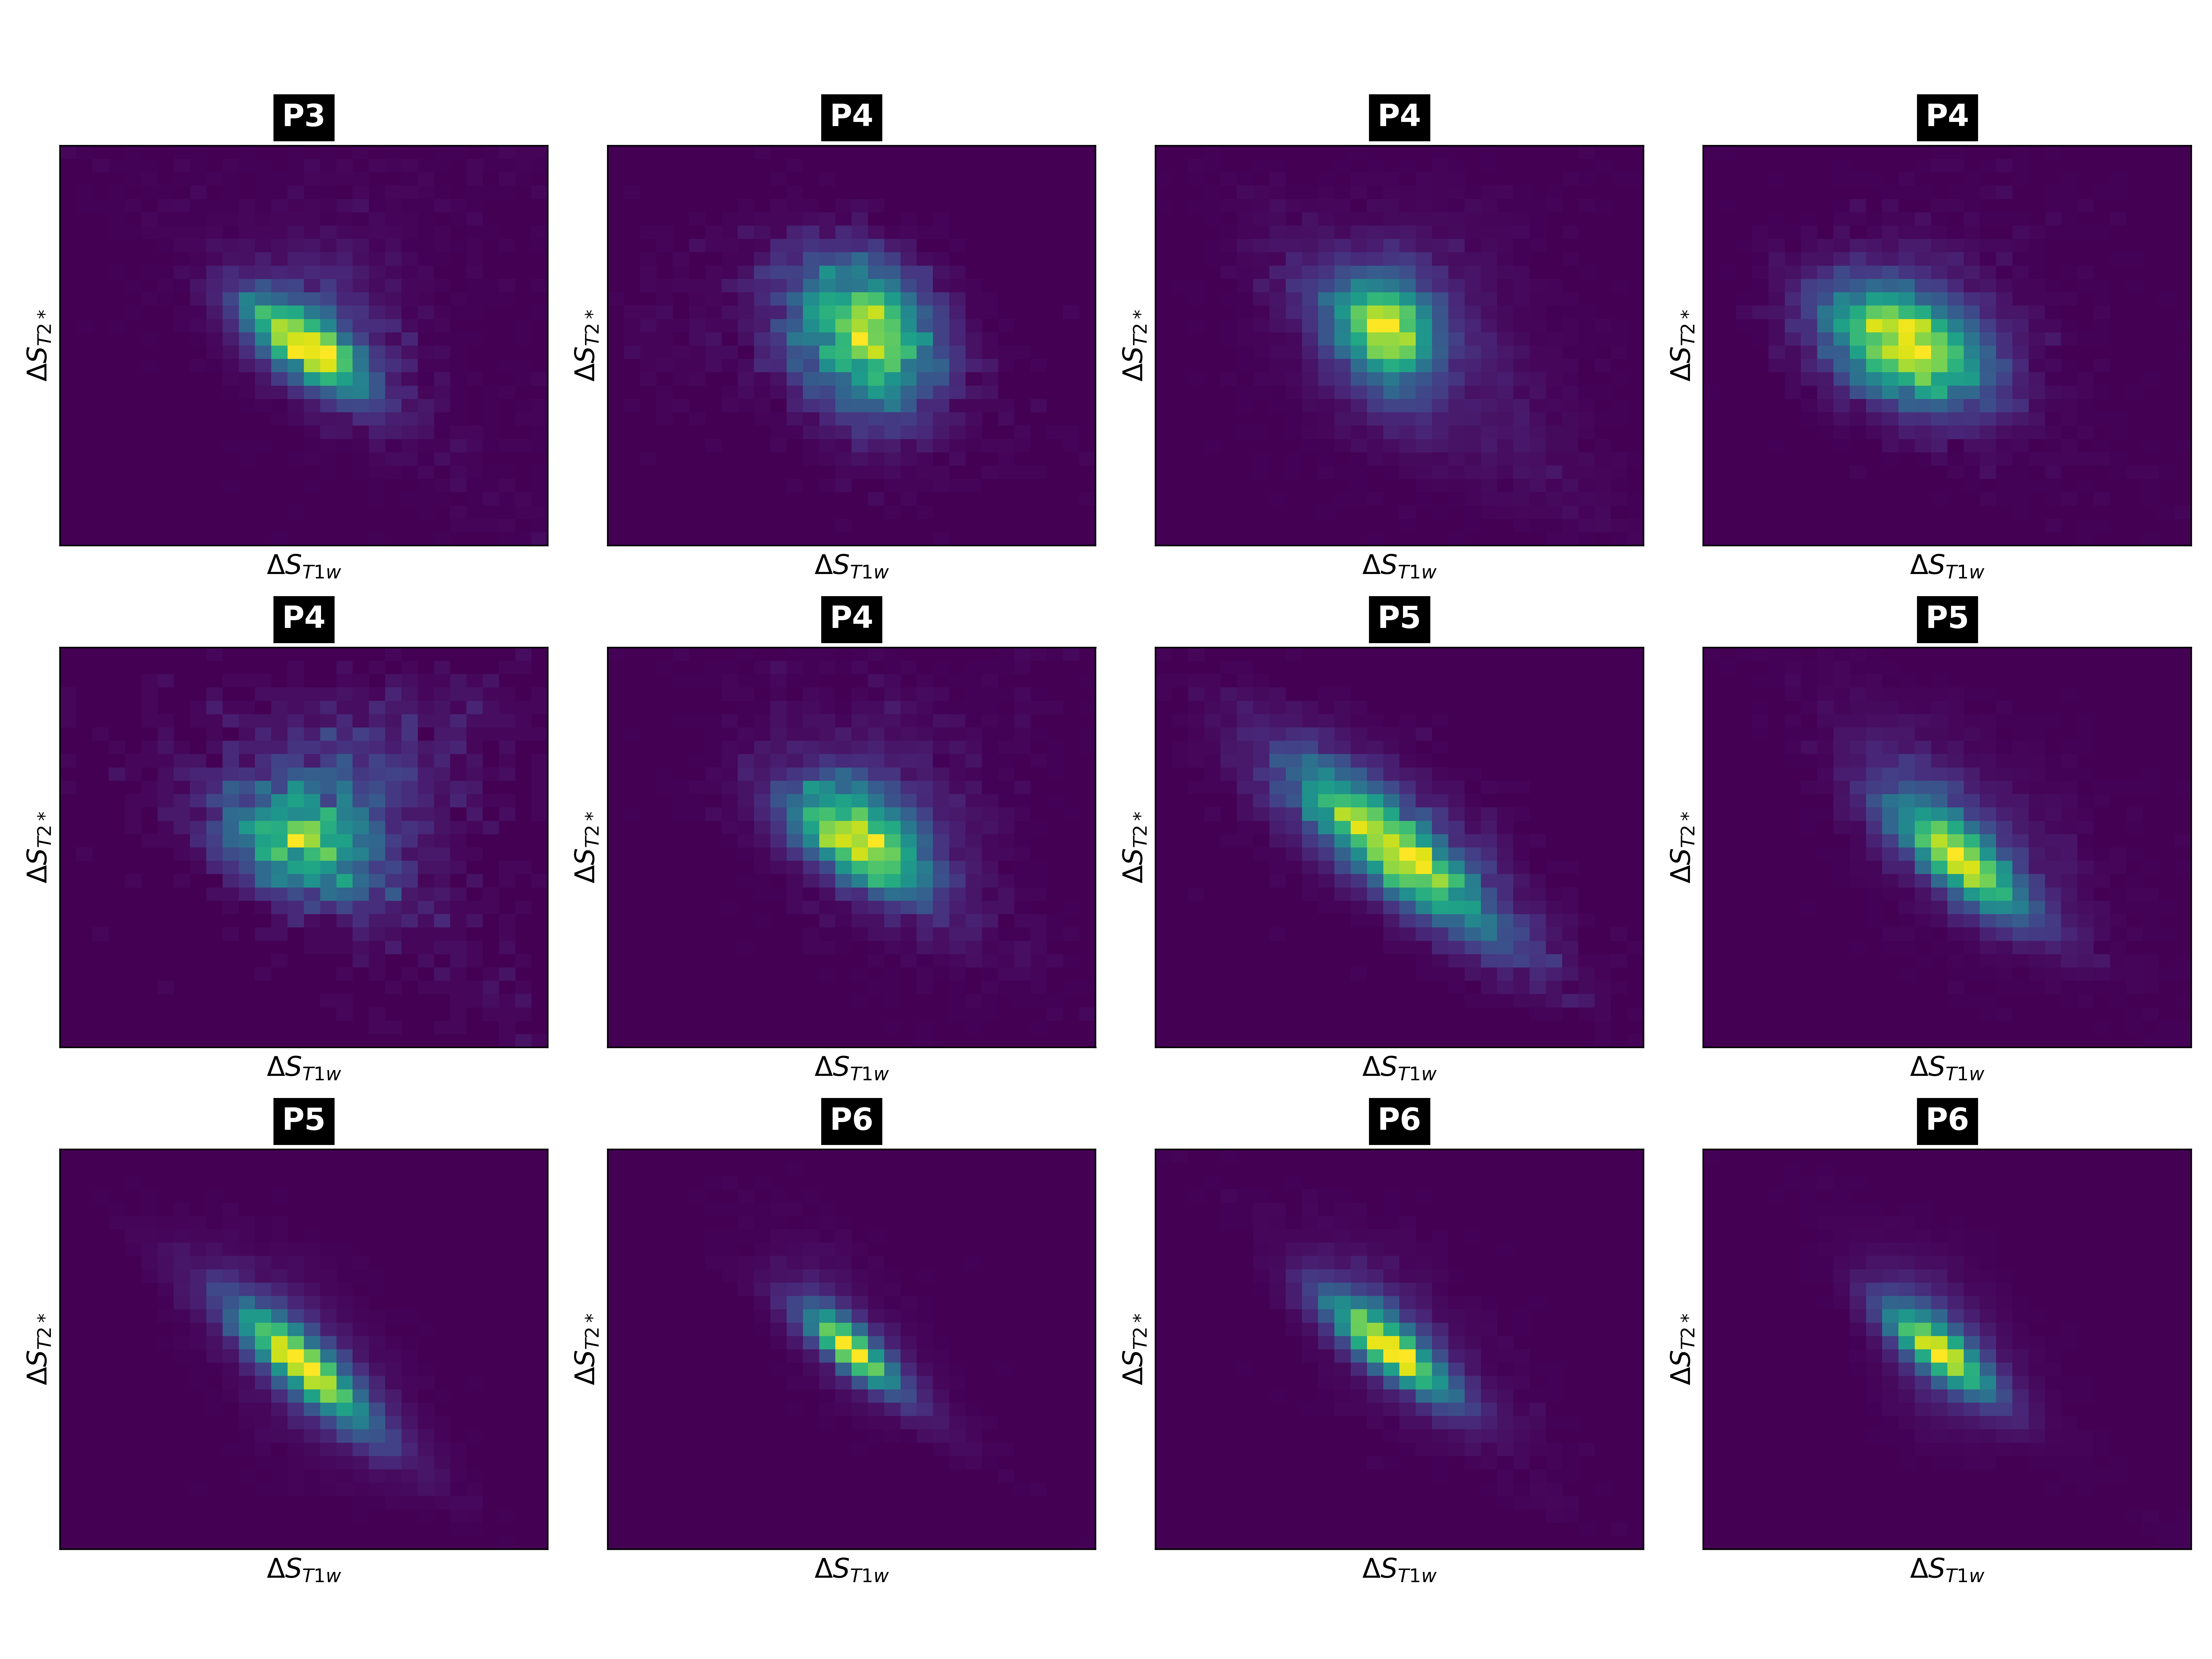
In addition, we plotted the changes in T1 and T2* signal intensity for each individual voxel as well as for the slice averages and compared the results for the different PDX models.
Results
Visual comparison of the maps reveals a positive response from the well-oxygenated tumor rim, aligning with histology images. T1 and T2* signal intensities largely agree in regions with substantial positive or negative changes. However, some pixels exhibit polarity changes between the two parameters, while in others, one parameter responds strongly to the oxygen challenge while the other remains unresponsive.We analyzed the relationship between T1 and T2* signal changes. Two of the PDX models exhibit strong linear correlations, while the third PDX model lacks correlation.
Discussion & Conclusion
In this study we investigated the relationship of signal intensity change in T1 and T2* weighted images following a cyclic gas breathing challenge using dynamic oxygen-enhanced MRI.While there was strong correlation between 𝛥T1 and 𝛥T2* in two PDX tumour models, another model did not display those properties. Our findings suggest that in tumors containing a significant proportion of oxygenated tissue, there is no significant change in transverse relaxation because of the high levels of oxygen saturation in the hemoglobin. The absence of a T2* change results in a lack of correlation, aligning with the theoretical model proposed by Cao-Pham et al.7 and measured by O’Connor et al.11.
Regions that show linear changes in T1 and T2* signal intensity are indicative of mild hypoxia. An increase in inhaled oxygen decreases deoxygenated hemoglobin and increases dissolved oxygen in plasma. As a result, the transverse relaxation time is prolonged and affects the longitudinal relaxation time, leading to a linear correlation. These results are in agreement with those of Zhao et al.8.
We note that the 𝑇1- and 𝑇2*-weighted images may still depend on both relaxation times, as it is challenging to completely exclude their mutual influence. This may lead to a linear trend.
A multiparametric analysis approach in dOE-MRI confirms previous research findings suggesting that variations in tissue oxygenation leads to different relationships between T1 and T2* signal intensity changes during gas breathing. Nevertheless, the changes in relaxation times and their correlation appear to be complicated and are influenced by various physiological factors that can be difficult to account for. By integrating a multiparametric approach, we can gain a deeper understanding of oxygen saturation in living tumor tissue.
Acknowledgements
We gratefully acknowledge the support of the Cancer Research Society Charlotte Légaré Memorial Fund as well as the NSERC Discovery Grant.
References
1. Harris AL. Hypoxia--a key regulatory factor in tumour growth. Nat Rev Cancer. 2002;2(1):38-47. doi:10.1038/nrc704
2. Moosvi F, Baker JHE, Yung A, Kozlowski P, Minchinton AI, Reinsberg SA. Fast and sensitive dynamic oxygen-enhanced MRI with a cycling gas challenge and independent component analysis. Magn Reson Med. 2019;81(4):2514-2525. doi:10.1002/mrm.27584
3. Yang DM, Arai TJ, Campbell JW 3rd, Gerberich JL, Zhou H, Mason RP. Oxygen-sensitive MRI assessment of tumor response to hypoxic gas breathing challenge. NMR Biomed. 2019;32(7):e4101. doi:10.1002/nbm.4101
4. Remmele S, Sprinkart AM, Müller A, et al. Dynamic and simultaneous MR measurement of R1 and R2* changes during respiratory challenges for the assessment of blood and tissue oxygenation. Magn Reson Med. 2013;70(1):136-146. doi:10.1002/mrm.24458
5. Burrell JS, Walker-Samuel S, Baker LC, et al. Exploring ΔR(2) * and ΔR(1) as imaging biomarkers of tumor oxygenation. J Magn Reson Imaging. 2013;38(2):429-434. doi:10.1002/jmri.23987
6. Little RA, Jamin Y, Boult JKR, et al. Mapping Hypoxia in Renal Carcinoma with Oxygen-enhanced MRI: Comparison with Intrinsic Susceptibility MRI and Pathology. Radiology. 2018;288(3):739-747. doi:10.1148/radiol.2018171531
7. Cao-Pham TT, Tran LB, Colliez F, et al. Monitoring Tumor Response to Carbogen Breathing by Oxygen-Sensitive Magnetic Resonance Parameters to Predict the Outcome of Radiation Therapy: A Preclinical Study. Int J Radiat Oncol Biol Phys. 2016;96(1):149-160. doi:10.1016/j.ijrobp.2016.04.029
8. Zhao D, Pacheco-Torres J, Hallac RR, et al. Dynamic oxygen challenge evaluated by NMR T1 and T2*--insights into tumor oxygenation. NMR Biomed. 2015;28(8):937-947. doi:10.1002/nbm.3325
9. Pedregosa, F. et al. Scikit-learn: Machine Learning in Python. Journal of Machine Learning Research 12(85): 2825−2830 (2011).
10. Hofmann A, et al. Automating Component Selection in Independent Component Analysis (ICA) in dynamic Oxygen-Enhanced MRI (dOE-MRI). Proc. ISMRM 2023, 3401.
11. James P.B. O’Connor et al. “Comparison of normal tissue R1 and R2* modulation by oxygen and carbogen.” In: Magnetic Resonance in Medicine 61.1 (2009), pp. 75–83. doi: https://doi.org/10.1002/mrm.21815
Figures
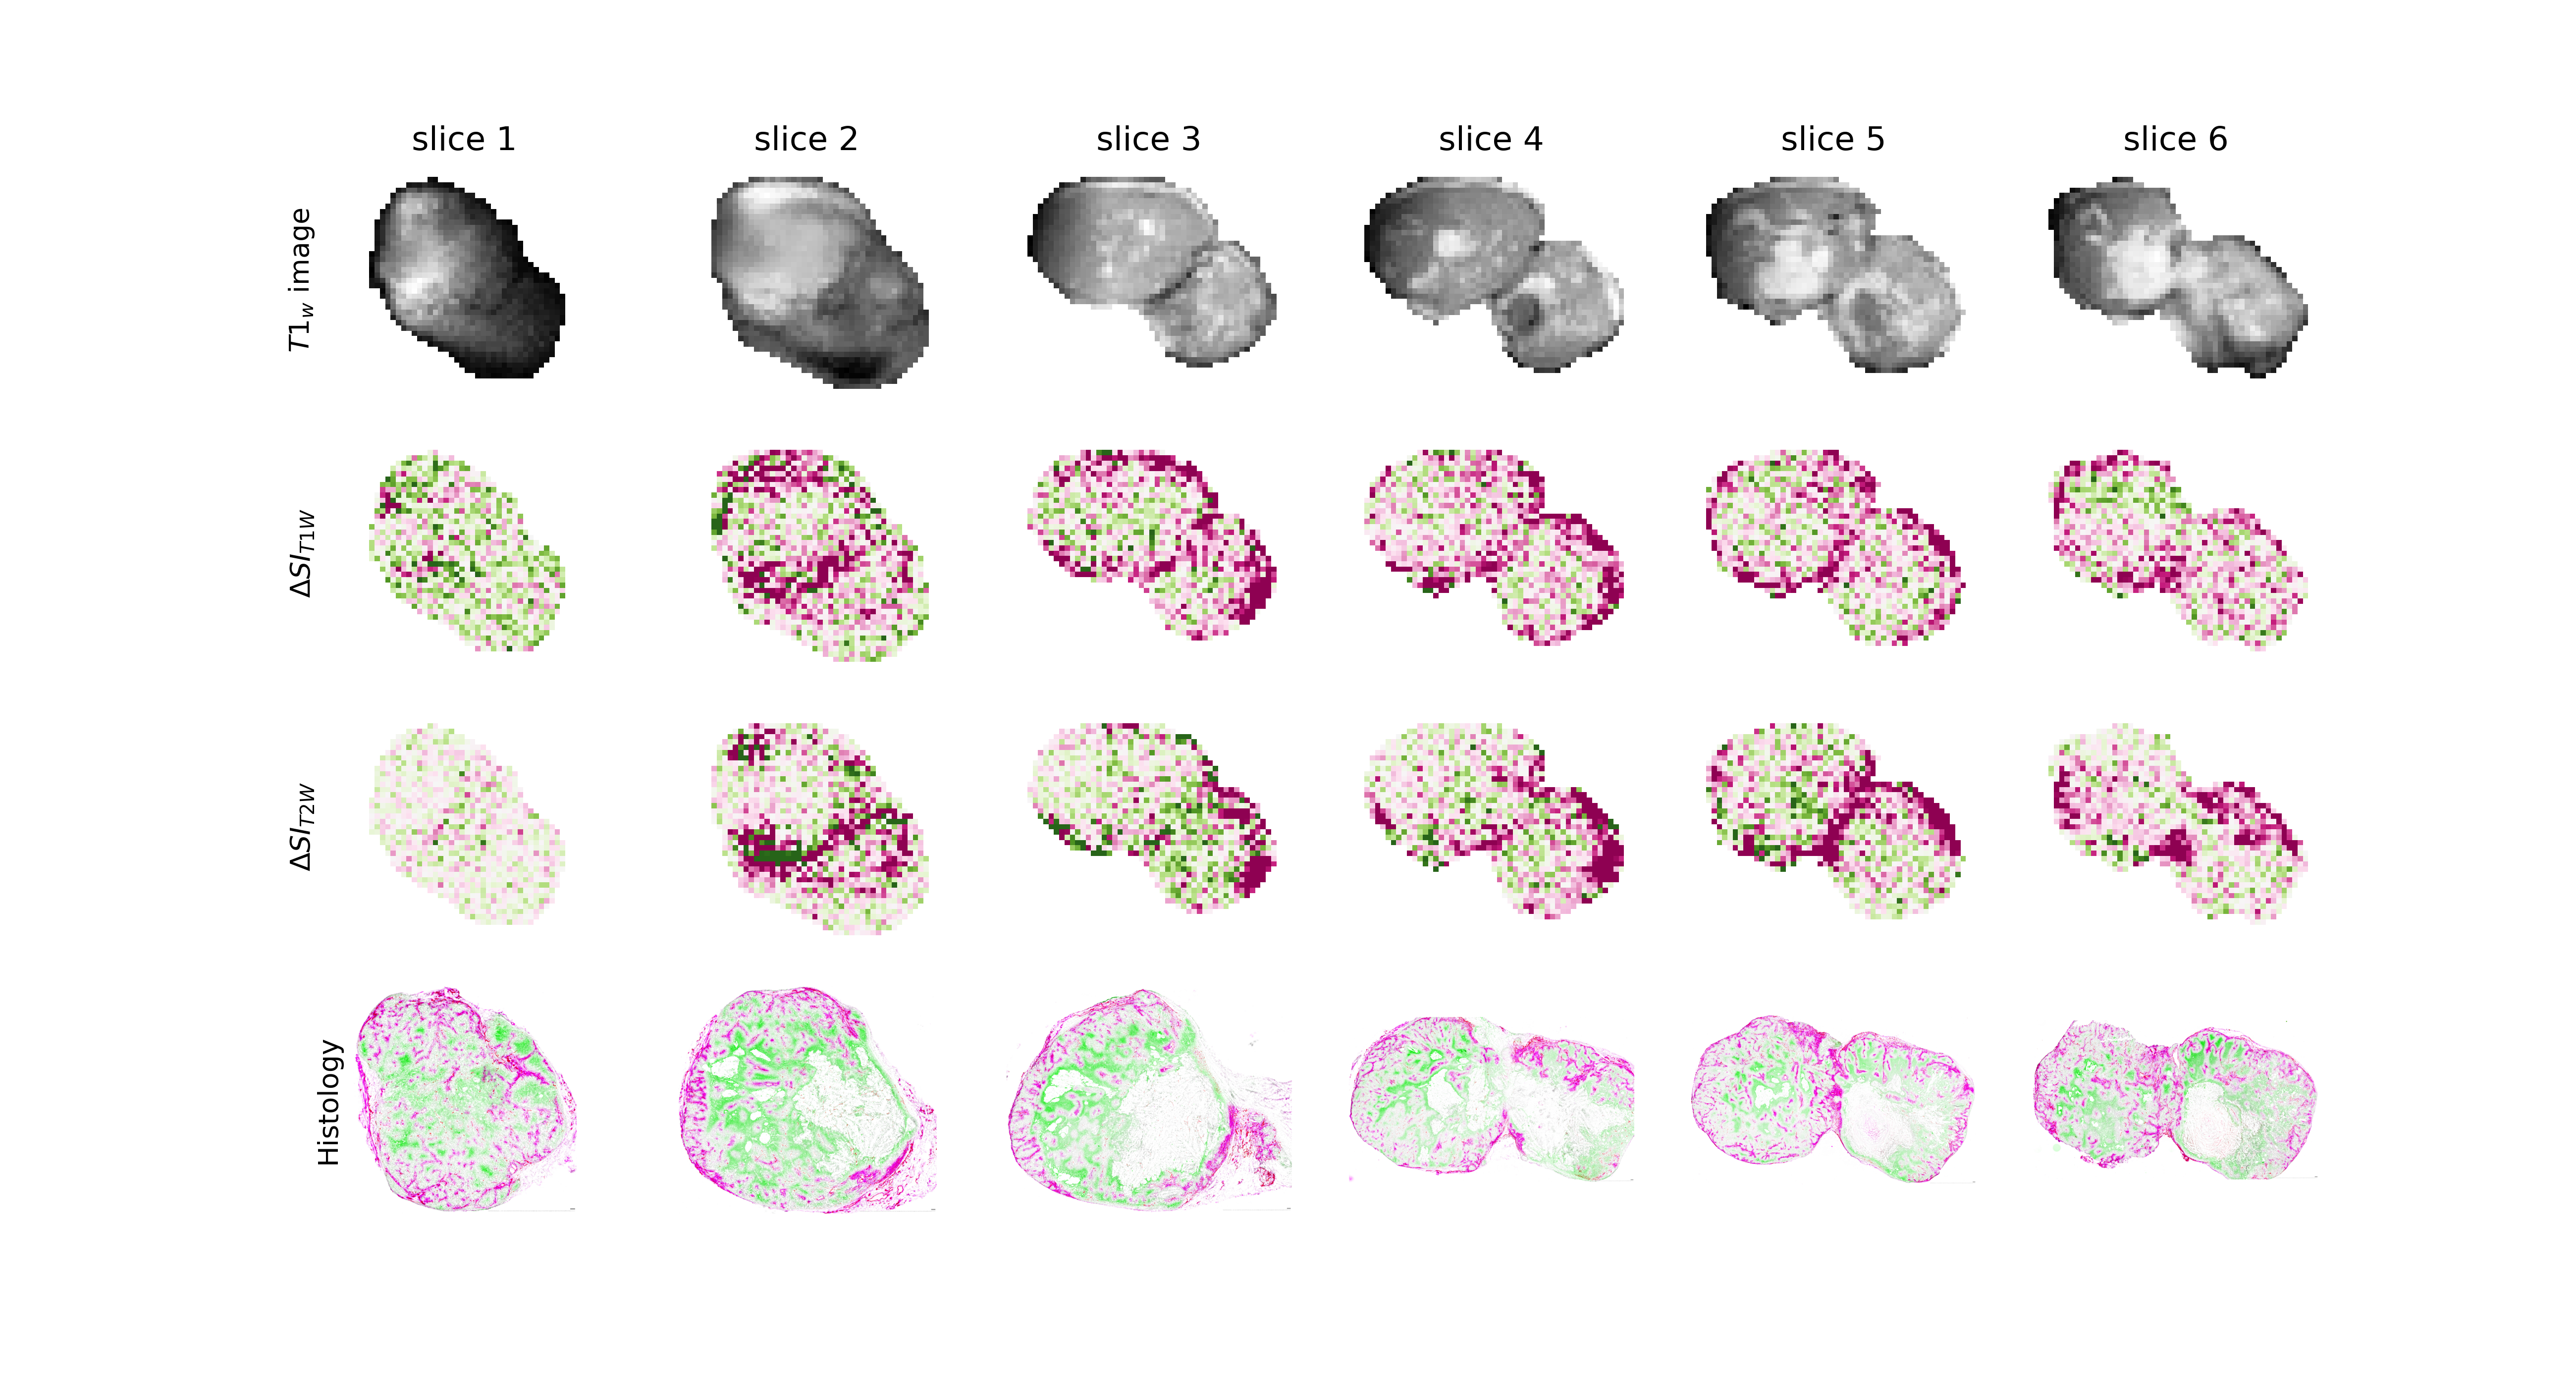
Figure 1: Independent component Analysis maps for Signal intensity change in T1 and T2* weighted image following gas breathing challenge, compared to Pimonidazole stained histology images and T1 weighted anatomical scan.
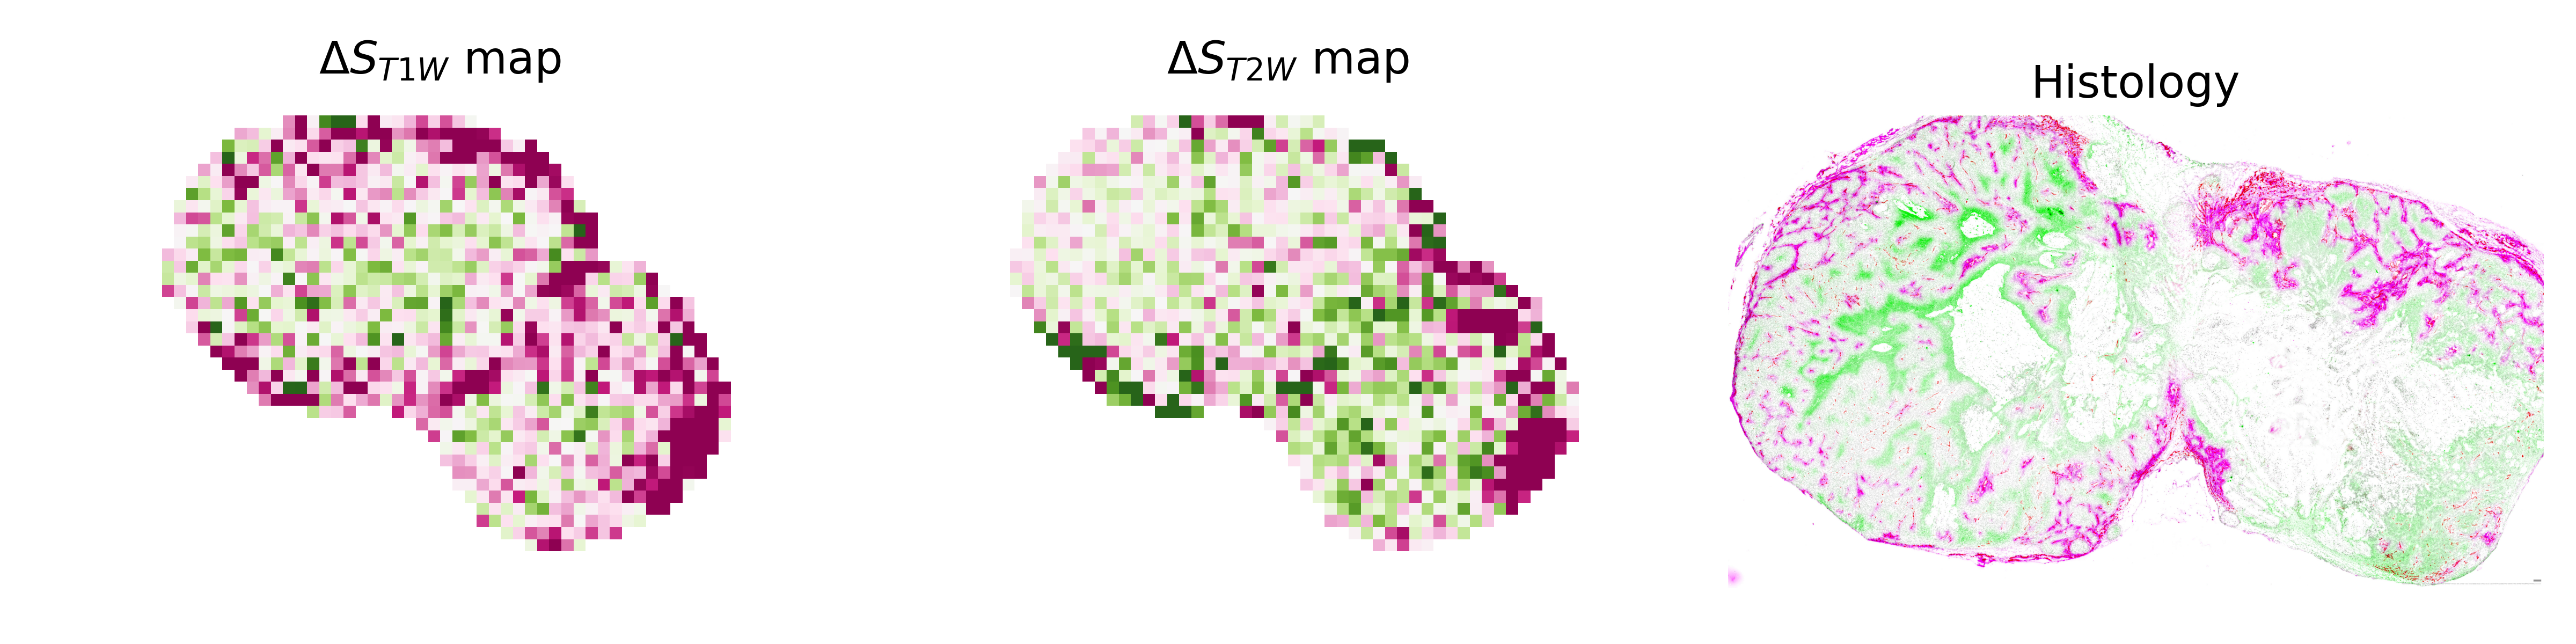
Figure 2: Single slice ICA map for signal change in T1 and T2* weighed image compared with a matched histology image showing pimonidazole staining of hypoxia (green) and vascular patency imaged via an intravenously injected fluorescent dye (magenta).
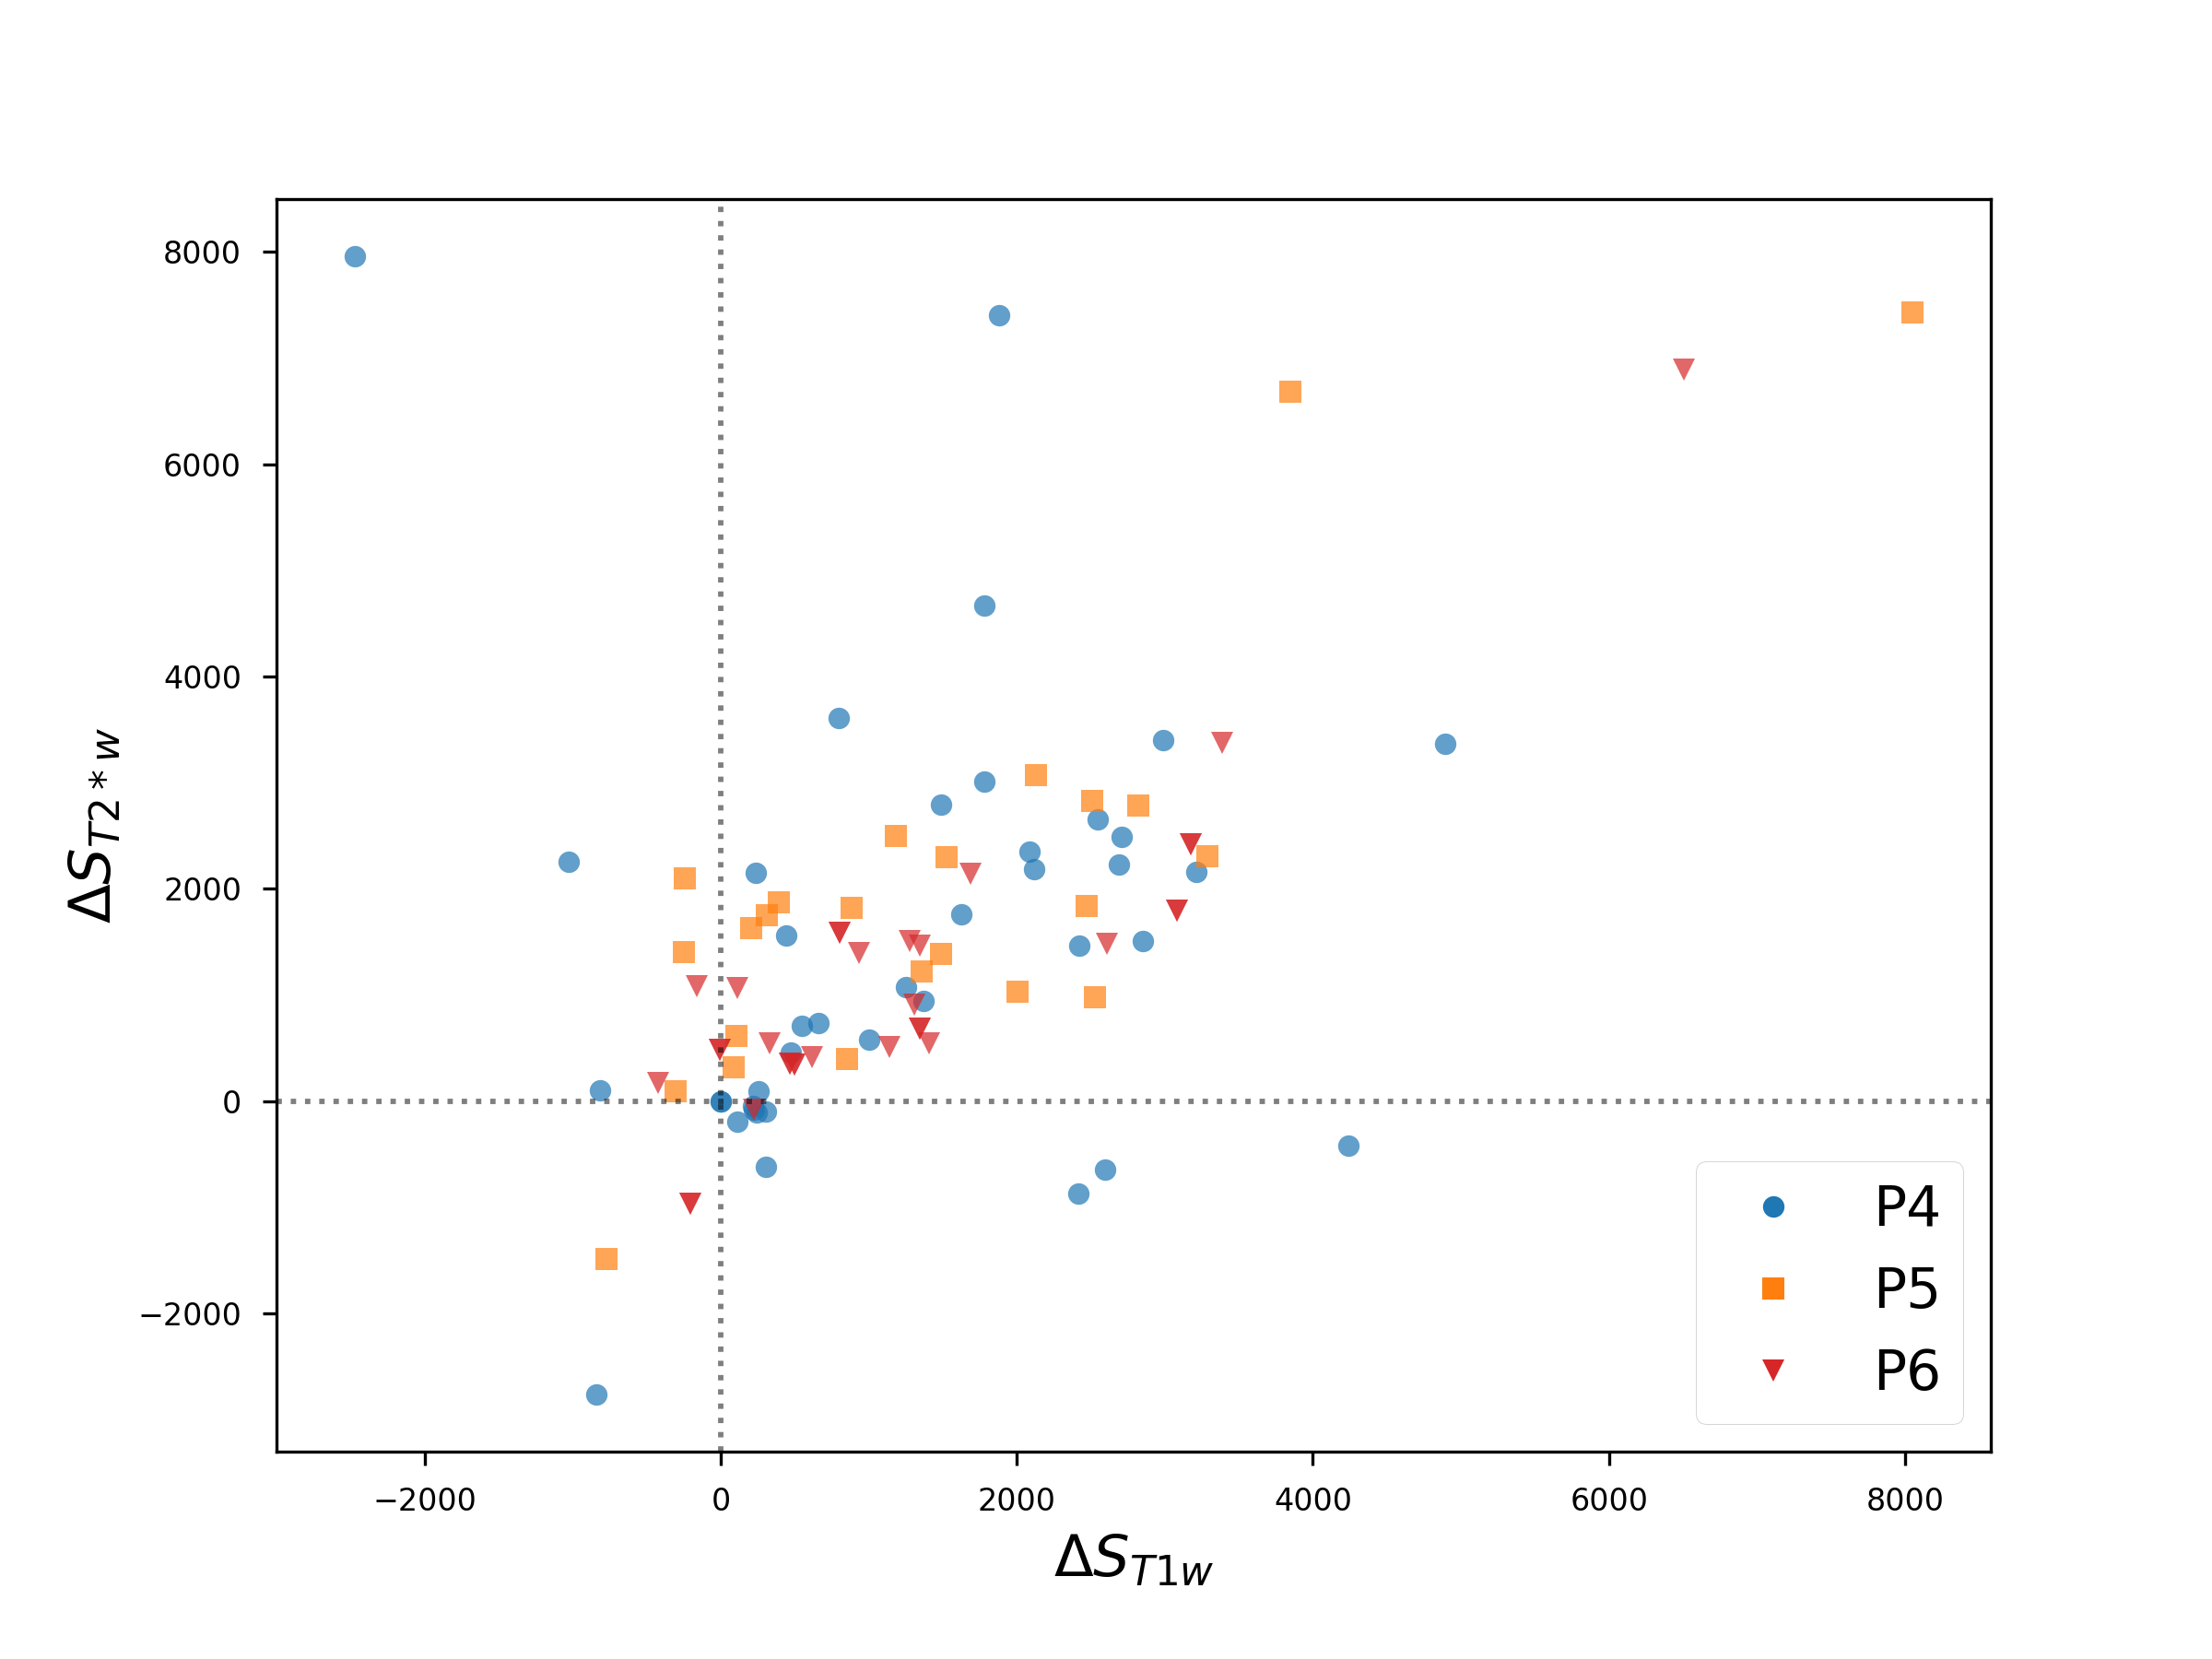
Figure 3: Comparing slice-averaged ICA values for the different PDX tumour types labeled P4, P5 and P6. Correlating the signal intensity change in the highly T2* weighted image with the signal intensity change in the highly T1 weighted image.