3181
A deep neural network for Oxygen Extraction Fraction (OEF) mapping based on No Training1Department of Biomedical Engineering, University at Buffalo, Buffalo, NY, United States
Synopsis
Keywords: Oxygenation, Oxygenation, Contrast Mechanism
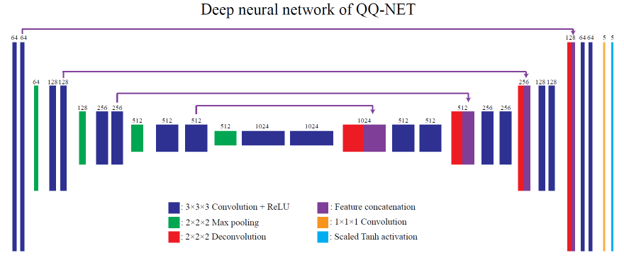
Motivation: Quantitative mapping of oxygen extraction fraction (OEF) is critical to evaluate brain tissue viability and function in neurologic disorders. A recent deep learning-based OEF technique, namely QQ-NET, provided OEF maps sensitive to disease-related abnormalities. However, QQ-NET suffers from training data dependency and requires extensive amount of training data.
Goal(s): Our goal is to resolve the training data dependency issue.
Approach: We developed a novel deep learning scheme, namely QQ-NTD, which minimizes the biophysics model fidelity on each single dataset.
Results: The proposed QQ-NTD provided a more accurate OEF than QQ-NET.
Impact: With no need for extensive training and independence from input imaging parameters, our novel deep learning approach, QQ-NTD, can be used readily used to obtain OEF maps in clinical setting.
Introduction
Quantitative mapping of oxygen extraction fraction (OEF) provides critical insights about the brain’s response to changes in oxygen supply and demand across various neurologic disorders including stroke1, 2. Recently, a combined model of quantitative susceptibility mapping 3-6and quantitative blood oxygen level dependent magnitude 7-9(QSM+qBOLD=QQ)3, 10-12 a deep neural network QQ-NET has been developed to map OEF. This QQ accounts for the OEF effect on both magnitude (using qBOLD) and phase (using QSM) of a widely available multi-echo gradient echo (mGRE) data. Furthermore, a deep learning-based QQ approach, QQ-NET, was introduced and provided reliable OEF maps that show decreased OEF in chronic stroke lesions12. However, QQ-NET relies on an extensive combination of parameters in the training dataset, necessitating a lengthy training (approximately 5 days). Moreover, it requires a re-training to test data with different imaging parameters, e.g., different echo times (TEs). In this study, we propose a novel deep learning approach, QQ-NTD, which minimizes model fidelity loss in a single dataset, thereby removing the need for the extensive training and re-training.Method
The QQ model combines the QSM-based and qBOLD-based OEF mapping methods to estimate$$$ OEF=1-Y⁄Y_a$$$ with venous oxygenation ($$$ Y$$$ ) and arterial oxygenation ($$$ Y_{a}=0.98$$$) 10. The QSM-based model separates voxel-wise susceptibility into the contribution of deoxy-hemoglobin in venous blood, i.e., OEF effect, and non-blood neural tissue susceptibility ( $$$\chi_{n}$$$).$$F_{QSM}(Y,v,\chi_{n})=\left[\frac{\chi_{ba}}{\alpha}+\psi_{Hb}\cdot\Delta\chi_{Hb}\cdot\left(-Y+\frac{1-\left(1-\alpha\right)\cdot Y_{a}}{\alpha}\right)\right]\cdot v + \left(1-\frac{v}{\alpha}\right)\cdot \chi_{n}$$
where$$$ \chi_{ba}=-108.3$$$ ppb the fully oxygenated blood susceptibility assuming tissue hematocrit Hct =0.3576,$$$\alpha=0.77$$$ the ratio between the venous blood volume ($$$v$$$ ) and total blood volume13, $$$\psi_{Hb}= 0.0909$$$ the hemoglobin volume fraction with Hct=0.3514-17, $$$\Delta\chi_{Hb}=12522$$$ the susceptibility difference between deoxy- and oxyhemoglobin18, 19. The qBOLD model describes the OEF effect on the mGRE magnitude10:
$$ F_{qBOLD}\left(S_{0},R_{2}Y,v,\chi_{n},t_{j}\right)=S_0\cdot e^{-R_2\cdot t_{j}}\cdot F_{BOLD}\left(Y,v,\chi_{n},t_{j}\right)\cdot G(t_{j})$$
where $$$S_{0}$$$ is signal intensity at $$$ t=0$$$ ,$$$ R_{2}$$$ is the transverse relaxation rate,$$$ F_{BOLD}\left(Y,v,\chi_{n},t\right)=exp\left[-v\cdot f_{s}\left(\delta\omega\cdot t\right)\right]$$$ 9 where$$$ f_{s}$$$is the signal decay by the presence of the blood vessel network20 and $$$ \delta\omega$$$ is the characteristic frequency due to the susceptibility difference between deoxygenated blood and the surrounding tissue: $$$ \delta \omega\left(Y,\chi_{n}\right)=\frac{1}{3}\cdot \gamma \cdot B_{0}\cdot \left[\psi_{Hb}\cdot \Delta \chi_{Hb}\cdot \left(1-Y\right) + \chi_{ba}-\chi_{n}\right]$$$ with $$$ \gamma=267.51$$$ rad s-1T-1 the gyromagnetic ratio, and $$$ B_{0}$$$ the main magnetic field strength. $$$ G(t_{j})$$$ is the macroscopic field inhomogeneity contribution to mGRE signal decay 10.
Deep neural network for QQ with no training (QQ-NTD)
A recent study shows that deep neural network (DNN) weights for solving model inversion can be updated using a single test dataset21. Inspired by this idea, we updated the DNN weights ($$$\theta^*$$$) for our QQ model to minimize the model fidelity $$$E_{model}$$$ in a single dataset , which is a concatenated set of mGRE magnitude ($$$ S_{mag}$$$) and QSM.
$$ E_{model}= ||S_{mag}-F_{qBOLD}(\psi(S;\theta^*))|| + ||QSM - F_{QSM}(\psi(S;\theta^*))||$$
The results network weights ($$$ \theta^*$$$) are specific to the dataset $$$S$$$, and the resulting output ($$$ \psi(S;\theta^*$$$) are the five parameters of QQ ($$$ S_{0},R_{2},Y,v,\chi_{n}$$$). Unlike conventional deep learning training, no training is required in this scheme (no-training DNN or NTD).
Validation
We compared QQ-NTD with the previous QQ-NET12 in a simulated stroke brain dataset using 3D mGRE imaging parameters (0.47x0.47x2.0 mm3 voxel size, TE1/ΔTE/TE8 = 4.5/5/39.5 ms).
Results
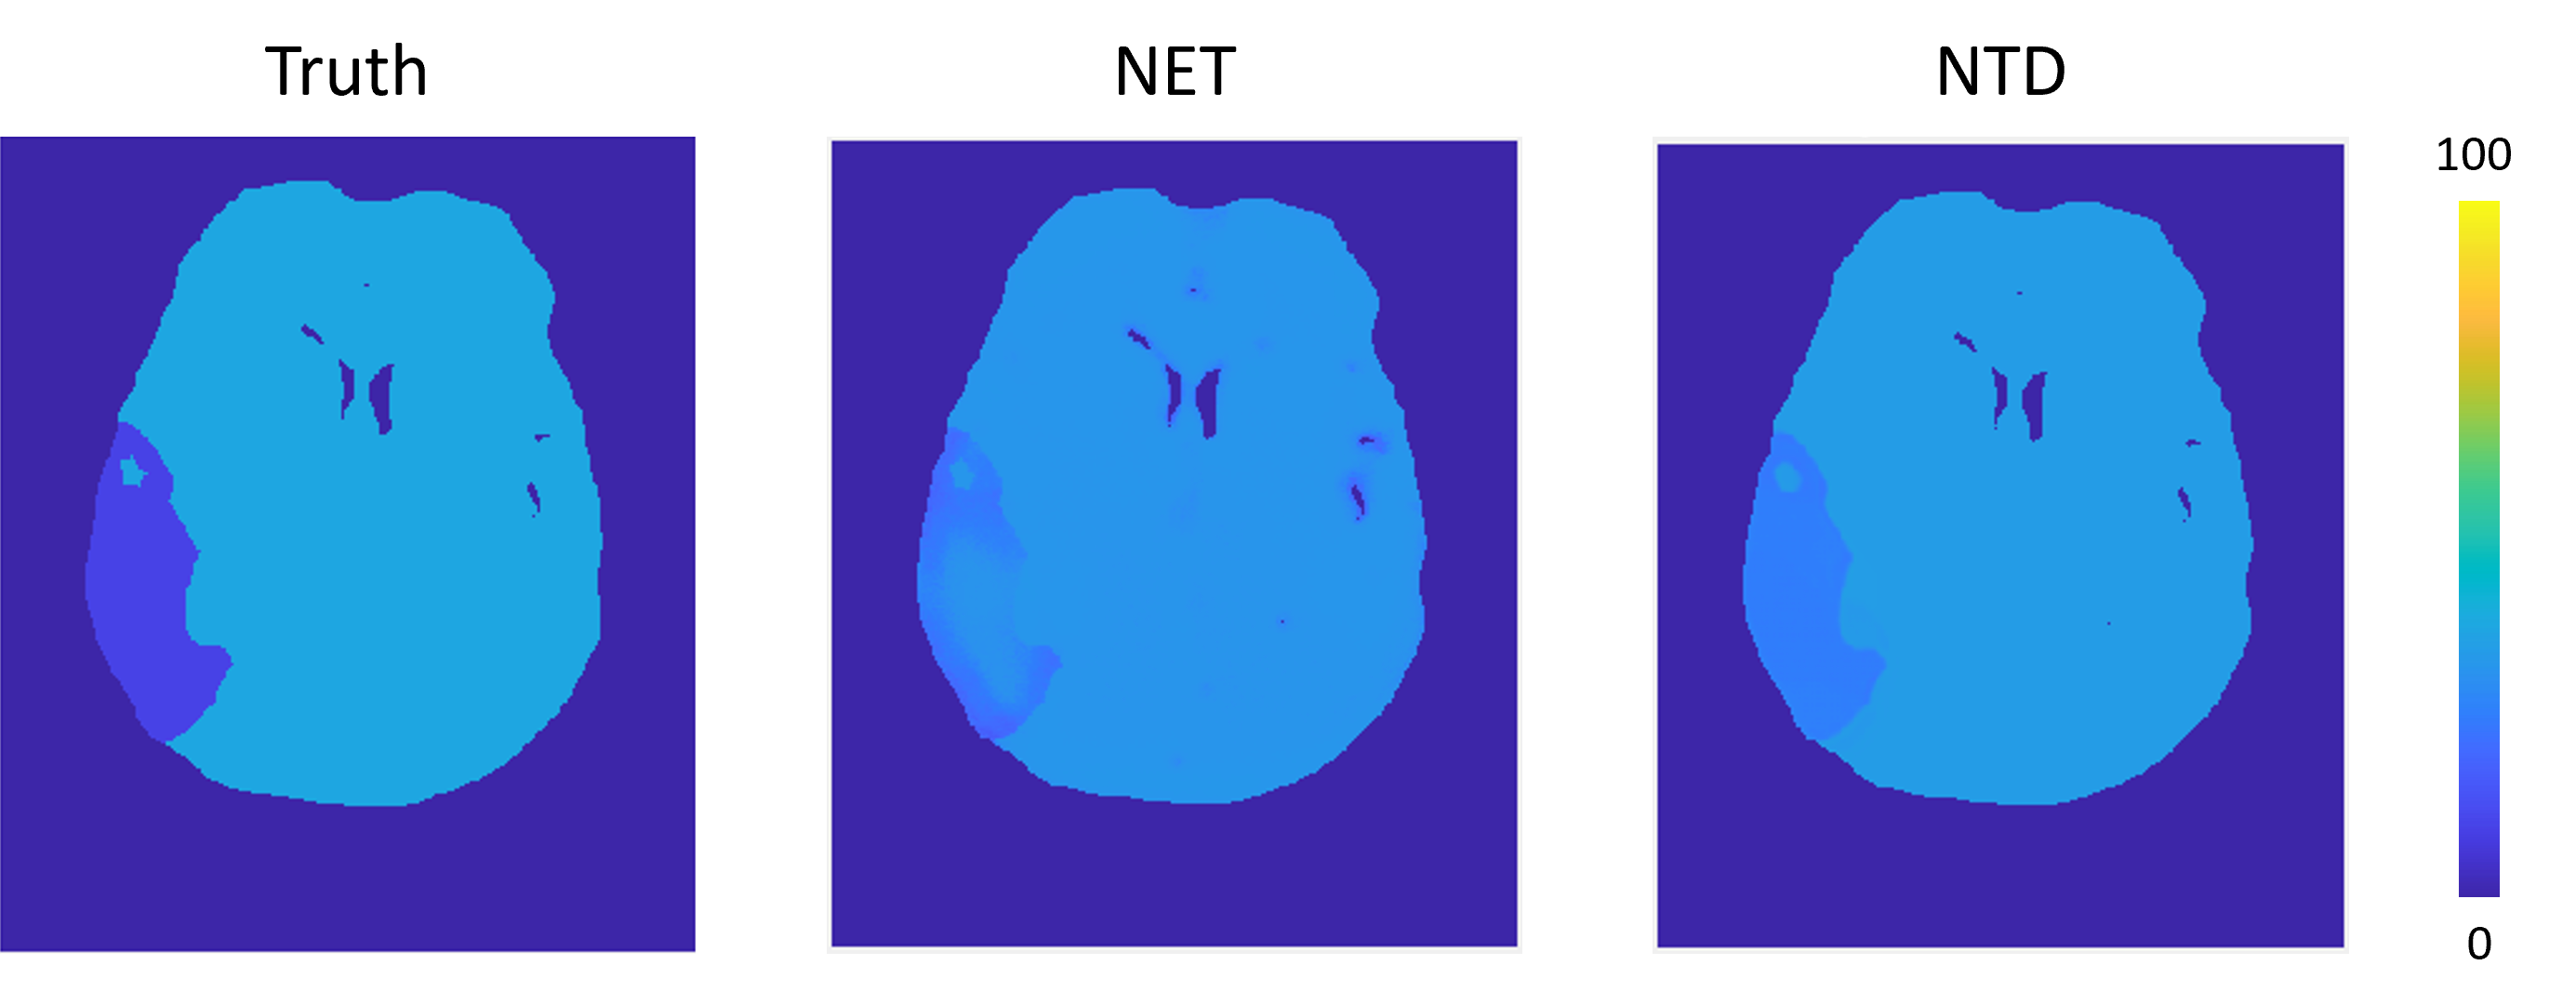
QQ-NTD showed more accurate OEF compared to QQ-NET in simulation, e.g., a smaller mean error in whole brain (-0.01 vs -0.03) and lesion (0.176 vs. 0.189) (Figure 2). Moreover, QQ-NTD better depicted low lesion OEF, showing improved spatial overlap of low OEF regions compared to the ground truth, a dice score 0.66 vs. 0.97 (Figure).Discussion
This study demonstrates the feasibility of NTD approach for QQ-based OEF mapping. The new approach led to improved OEF accuracy in simulation (Figure 2), in both presumably healthy tissue and abnormal low OEF lesion. This suggests that NTD approach may learn the underlying biophysics model of QQ by minimizing the model fidelity term. Unlike the conventional deep learning approaches, including QQ-NET, the proposed QQ-NTD does not require 1) training on extensive datasets and 2) re-training when there are differences in imaging parameters between training and test data. With improved sensitivity to OEF abnormality and a significantly faster and simplified training scheme (e.g., QQ-NTD vs QQ-NET, 2 days vs. 4~ days), QQ-NTD has high potential for clinical use in investigating tissue variability in neurologic disorders.Acknowledgements
No acknowledgement found.References
1. Derdeyn CP, Videen TO, Yundt KD, et al. Variability of cerebral blood volume and oxygen extraction: stages of cerebral haemodynamic impairment revisited. Brain 2002; 125: 595-607. DOI: 10.1093/brain/awf047.
2. Gupta A, Chazen JL, Hartman M, et al. Cerebrovascular reserve and stroke risk in patients with carotid stenosis or occlusion: a systematic review and meta-analysis. Stroke 2012; 43: 2884-2891. DOI: 10.1161/STROKEAHA.112.663716.
3. Cho J, Spincemaille P, Nguyen TD, et al. Temporal clustering, tissue composition, and total variation for mapping oxygen extraction fraction using QSM and quantitative BOLD. Magn Reson Med 2021; 86: 2635-2646. 20210610. DOI: 10.1002/mrm.28875.
4. Ma Y, Mazerolle EL, Cho J, et al. Quantification of brain oxygen extraction fraction using QSM and a hyperoxic challenge. Magn Reson Med 2020; 84: 3271-3285. 20200630. DOI: 10.1002/mrm.28390.
5. Ma Y, Sun H, Cho J, et al. Cerebral OEF quantification: A comparison study between quantitative susceptibility mapping and dual-gas calibrated BOLD imaging. Magn Reson Med 2020; 83: 68-82. 20190802. DOI: 10.1002/mrm.27907.
6. Zhang J, Zhou D, Nguyen TD, et al. Cerebral metabolic rate of oxygen (CMRO(2) ) mapping with hyperventilation challenge using quantitative susceptibility mapping (QSM). Magn Reson Med 2017; 77: 1762-1773. 20160427. DOI: 10.1002/mrm.26253.
7. He X, Zhu M and Yablonskiy DA. Validation of oxygen extraction fraction measurement by qBOLD technique. Magn Reson Med 2008; 60: 882-888. DOI: 10.1002/mrm.21719.
8. He X and Yablonskiy DA. Quantitative BOLD: mapping of human cerebral deoxygenated blood volume and oxygen extraction fraction: default state. Magn Reson Med 2007; 57: 115-126. DOI: 10.1002/mrm.21108.
9. Yablonskiy DA, Sukstanskii AL and He X. Blood oxygenation level-dependent (BOLD)-based techniques for the quantification of brain hemodynamic and metabolic properties - theoretical models and experimental approaches. NMR Biomed 2013; 26: 963-986. 20120828. DOI: 10.1002/nbm.2839.
10. Cho J, Kee Y, Spincemaille P, et al. Cerebral metabolic rate of oxygen (CMRO(2) ) mapping by combining quantitative susceptibility mapping (QSM) and quantitative blood oxygenation level-dependent imaging (qBOLD). Magn Reson Med 2018; 80: 1595-1604. 20180307. DOI: 10.1002/mrm.27135.
11. Cho J, Zhang S, Kee Y, et al. Cluster analysis of time evolution (CAT) for quantitative susceptibility mapping (QSM) and quantitative blood oxygen level-dependent magnitude (qBOLD)-based oxygen extraction fraction (OEF) and cerebral metabolic rate of oxygen (CMRO(2) ) mapping. Magn Reson Med 2020; 83: 844-857. 20190910. DOI: 10.1002/mrm.27967.
12. Cho J, Zhang J, Spincemaille P, et al. QQ-NET - using deep learning to solve quantitative susceptibility mapping and quantitative blood oxygen level dependent magnitude (QSM+qBOLD or QQ) based oxygen extraction fraction (OEF) mapping. Magn Reson Med 2022; 87: 1583-1594. 20211031. DOI: 10.1002/mrm.29057.
13. An H and Lin W. Cerebral venous and arterial blood volumes can be estimated separately in humans using magnetic resonance imaging. Magn Reson Med 2002; 48: 583-588. DOI: 10.1002/mrm.10257.
14. Zhang J, Cho J, Zhou D, et al. Quantitative susceptibility mapping-based cerebral metabolic rate of oxygen mapping with minimum local variance. Magn Reson Med 2018; 79: 172-179. 20170310. DOI: 10.1002/mrm.26657.
15. Sakai F, Nakazawa K, Tazaki Y, et al. Regional cerebral blood volume and hematocrit measured in normal human volunteers by single-photon emission computed tomography. J Cereb Blood Flow Metab 1985; 5: 207-213. DOI: 10.1038/jcbfm.1985.27.
16. Savicki JP, Lang G and Ikeda-Saito M. Magnetic susceptibility of oxy- and carbonmonoxyhemoglobins. Proc Natl Acad Sci U S A 1984; 81: 5417-5419. DOI: 10.1073/pnas.81.17.5417.
17. Hoffman R. Hematology: Basic Principles and Practice. Churchill Livingstone, 2005.
18. Spees WM, Yablonskiy DA, Oswood MC, et al. Water proton MR properties of human blood at 1.5 Tesla: magnetic susceptibility, T(1), T(2), T*(2), and non-Lorentzian signal behavior. Magn Reson Med 2001; 45: 533-542. DOI: 10.1002/mrm.1072.
19. Zhang J, Liu T, Gupta A, et al. Quantitative mapping of cerebral metabolic rate of oxygen (CMRO2 ) using quantitative susceptibility mapping (QSM). Magn Reson Med 2015; 74: 945-952. 20140926. DOI: 10.1002/mrm.25463.
20. Ulrich X and Yablonskiy DA. Separation of cellular and BOLD contributions to T2* signal relaxation. Magn Reson Med 2016; 75: 606-615. 20150310. DOI: 10.1002/mrm.25610.
21. Jafari R, Spincemaille P, Zhang J, et al. Deep neural network for water/fat separation: Supervised training, unsupervised training, and no training. Magn Reson Med 2021; 85: 2263-2277. 20201026. DOI: 10.1002/mrm.28546.
Figures