3180
Reducing the Impact of Anesthesia on Glucosamine Uptake in the Mouse Brain1School of Chemistry, Tel-Aviv University, Tel Aviv, Israel
Synopsis
Keywords: Molecular Imaging, CEST & MT, Glucosamine, MRI, CEST, Metabolism, Brain
Motivation: Anesthetic drugs vary in their capacity to interfere with homeostatic mechanisms responsible for glucose metabolism in the brain, thus pose a possible constraint in the study design.
Goal(s): To evaluate the preferred anesthesia protocol for preclinical imaging of glucosamine metabolism in healthy mice brains.
Approach: The effects of different anesthetics procedures on brain glucosamine metabolism were investigated using the CEST MRI method.
Results: Mice injected with glucosamine and anesthetized with 1.5% isoflurane exhibited a low and insignificant increase in MTRasym signals in the cortex, whereas mice given 0.8% isoflurane combined with midazolam demonstrated a significant increase in MTRasym signals in the cortex.
Impact: Combining low levels of isoflurane with midazolam anesthesia, enables increased glucosamine CEST MRI signal, indicating enhanced glucosamine uptake through the BBB. These findings offer valuable insights for optimizing glucosamine metabolic imaging, which can be extended to other glucose analogs.
INTRODUCTION
Small animal in vivo MRI studies often require the use of general anesthesia to minimize the motion artifacts and the stress experienced by animals during imaging1,2. Numerous studies have shown that various anesthetic drugs can significantly affect brain glucose metabolism in mice3, ultimately influencing imaging results4-7. Inhalation of Isoflurane is commonly used in MRI examinations due to its higher safety margin, rapid induction and recovery, and better control over the depth and duration of anesthesia compared to injectable anesthetics. Recent studies reported that the combination of isoflurane with anesthetics drugs at levels of about half their mono-anesthetic dosages enables them to maintain similar functional connectivity as in the awake rodents, and they are considerably superior to either of the mono-anesthetic protocol alone2,8. Here, we present the initial findings concerning the impact of different anesthetic regimes on glucosamine (GlcN) uptake in mice brains, as assessed by Chemical Exchange Saturation Transfer (CEST) MRI. GlcN, a non-toxic food supplement, has the ability to cross the blood-brain barrier (BBB)9,10 ,allowing MRI to be a valuable tool for investigating its uptake and metabolism in the brain.METHODS
Animals preparationAll experiments with animal models were conducted in compliance with Israel National Research Council (NRC) guidelines and were approved by the Tel Aviv University Institutional Animal Care and Use Committee (IACUC) (TAU-MD-IL-2303-116-2). Female ICR mice (3-month-old) were purchased from ENVIGO RMS (Israel).
Two independent sets of studies were performed:
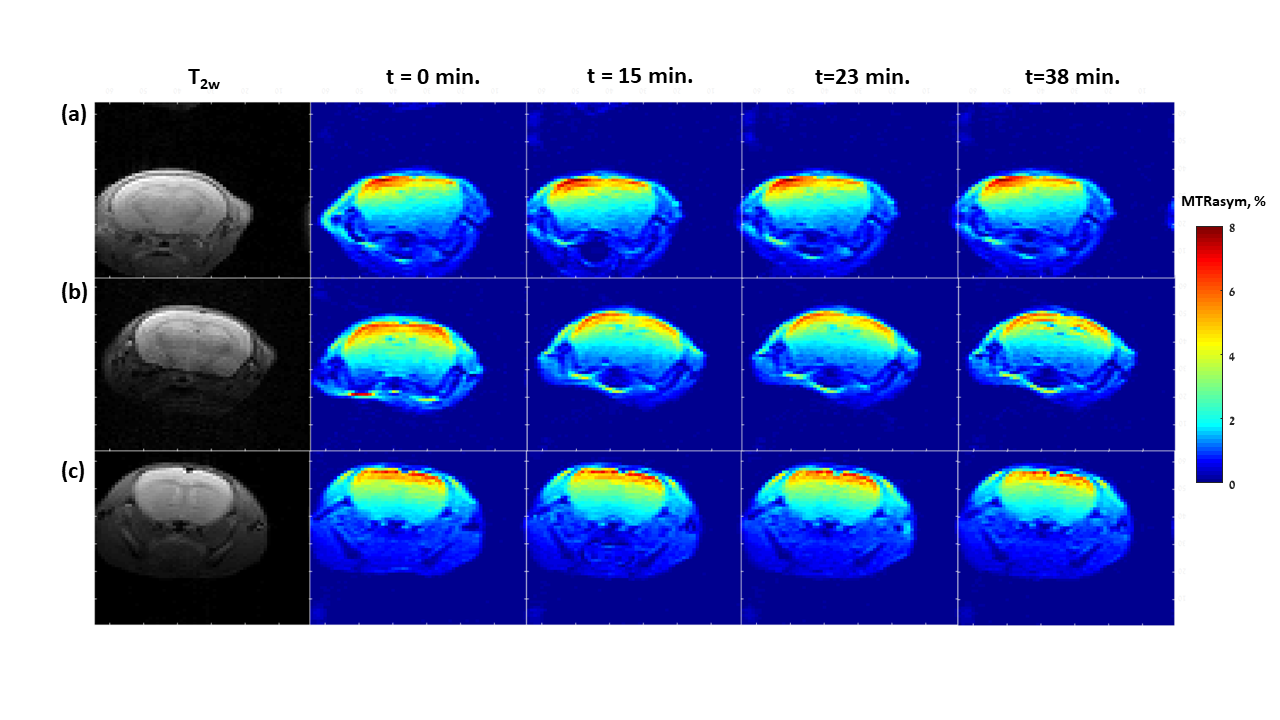
Group 1: (N=6). Isoflurane (Sigma-Aldrich, Israel) was inhaled sequentially with a concentration of 1.5% in a 20% O2/80% air mixture for each mouse.
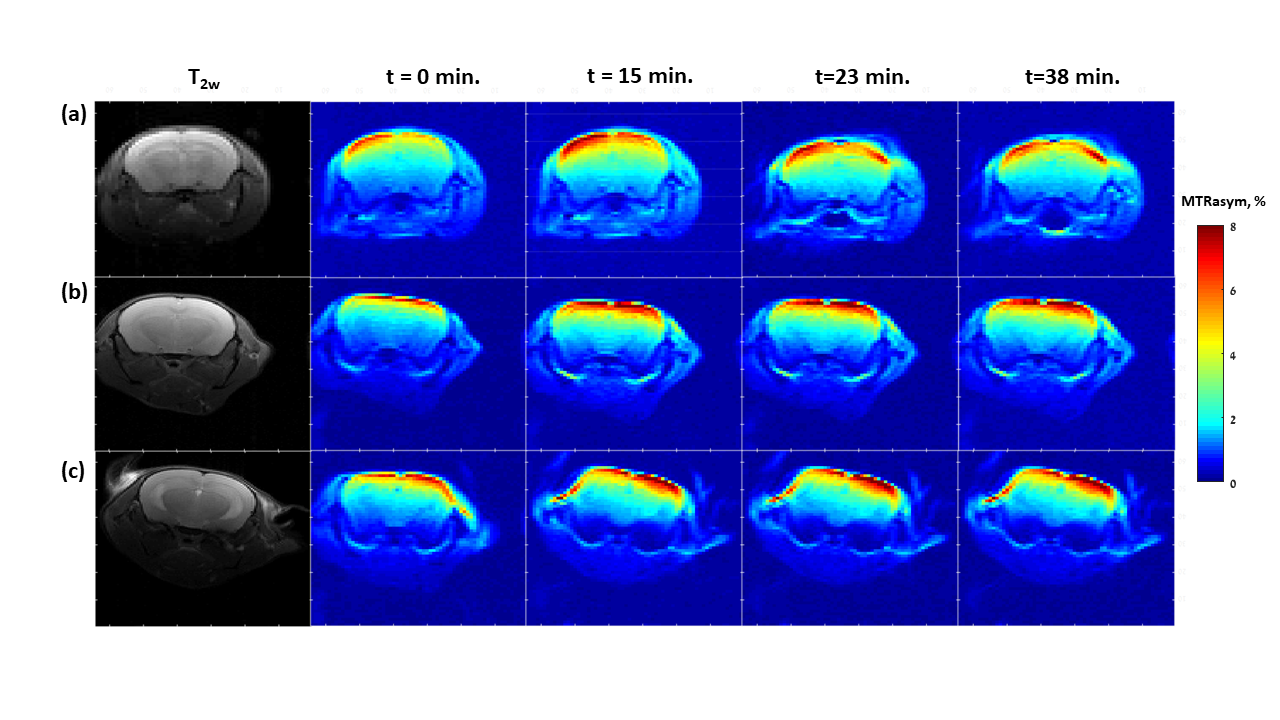
Group 2: (N=6). Isoflurane was inhaled sequentially with a concentration of 0.8% in a 20% O2/80% air mixture for each mouse. Each animal received Midazolam (2 mg/kg, SC; Kalcex, Slovakia) dissolved in saline.
CEST MRI scans were performed before and after intravenous injection of GlcN sulfate dissolved in saline (2.5 g/kg, IV, Sigma-Aldrich, Israel), following at least 4 hours of fasting with water access. Animals’ body temperature and respiration rate were monitored.
CEST MRI
Imaging was performed using a preclinical 7T scanner with quadrature coil (Bruker, Germany), implementing a CW sequence with a SE-EPI readout11,12, with saturation pulse power (B1) of 2.5 μT, saturation pulse duration of 2.5 s, and saturation frequency offsets of ±7 ppm with paired alternately 0.25 ppm increments. FOV =19 × 19 mm2, matrix = 64 × 64 pixels, slice thickness = 1 mm. Each Z spectra lasts 7:44 min (TE/TR = 20/8000 ms). A B0 map was acquired for field inhomogeneity correction13.
MRI data processing
Data was processed in MATLAB using custom-written scripts. Magnetization transfer ratio asymmetry (MTRasym) analysis was used for the calculation of the GlcN CEST effect at the region of interest (ROI). The main analysis was centered on frontal cortical regions as the glucose response is known for its significant in cortical areas but not in some subcortical regions14.
RESULTS
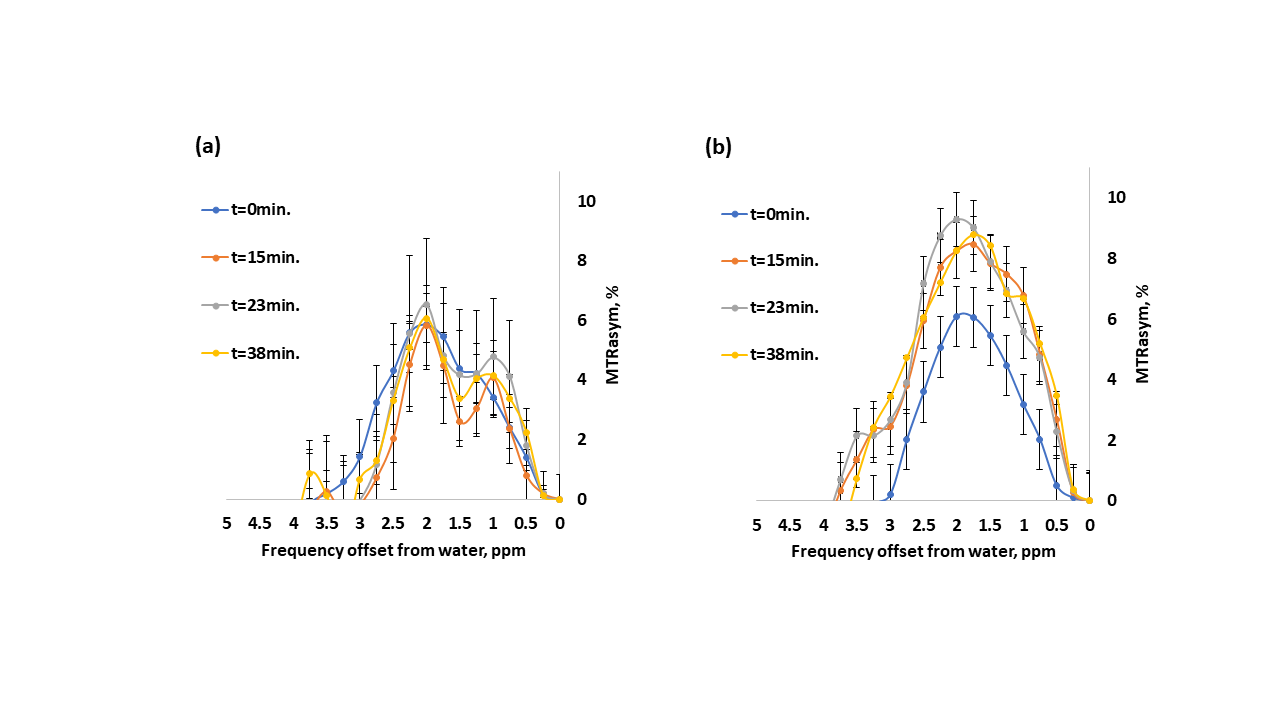
Representative dynamic MTRasym maps of healthy mice brains before and after GlcN treatment are shown in Figs.1,2. The 1.5% isoflurane-anesthetized mice did not demonstrate overall GlcN uptake in the brain (Fig.1), their MTRasym almost did not change across the entire Z spectra and even decreased with time for some frequency offsets (Figs.3a). Remarkably high GlcN uptake was observed in the brains anesthetized with isoflurane-midazolam (Fig.2), the entire Z spectra profile was enhanced following GlcN treatment (Figs.3b). Following ~40 minutes of GlcN treatment, the MTRasym effect at 1.5 ppm was 8.4 ± 1.7%, with an incremental increase due to GlcN uptake of 3.0 ± 1.21% (N=6, P= 0.0129) (Fig.3b). According to the Tukey HSD test, the means MTRasym of each examined time were significantly different vs. the baseline (t=0min.) with P=0.0182, P=0.0345, P=0.0129 for t=15min, t=23min, t=38min, respectively, (N=6).DISCUSSION
Previously published data for glucose3 and 2-deoxyglucose14,15 suggest their inadequate uptake by brain when utilizing conventional isoflurane levels (1.5% and above). This is a confounding factor in preclinical studies of glucose and its analogs metabolism in the brain. In accordance with these findings, we found in the present work that such isoflurane levels do not allow a significant accumulation of GlcN. However, we show that when combined with midazolam pretreatment, low isoflurane levels (0.8%) can be used, resulting in increased GlcN CEST signal in the cortex, indicating enhanced GlcN uptake via the BBB. This is attributable to the accumulation of GlcN and its metabolites, as previously demonstrated in breast cancer tumors16,17.CONCLUSION
An optimized anesthesia protocol was developed for GlcN CEST metabolic brain imaging in pre-clinical MRI examinations. The findings could potentially be extended to other glucose analogs in future research.Acknowledgements
The study was supported by the Israel Science Foundation (ISF).References
1.Paasonen J, Salo RA, Shatillo A, et al. Comparison of seven different anesthesia protocols for nicotine pharmacologic magnetic resonance imaging in rat. European Neuropsychopharmacology.2016;26(3):518-531.
2.Sharp PS, Shaw K, Boorman L, et al. Comparison of stimulus-evoked cerebral hemodynamics in the awake mouse and under a novel anesthetic regime. Scientific Reports. 2015;5(1).
3.Ori C, Dam M, Pizzolato G, Battistin L, Giron G. Effects of Isoflurane Anesthesia on Local Cerebral Glucose Utilization in the Rat. Anesthesiology. 1986;65(2):152-156.
4.Prando, S, Carneiro, CDG, Otsuki, DA, Sapienza, MT. Effects of ketamine/xylazine and isoflurane on rat brain glucose metabolism measured by 18F-fluorodeoxyglucose-positron emission tomography. Eur J Neurosci. 2019; 49: 51–61.
5.Chen Y, Li S, Liang X , Zhang J. Differential Alterations to the Metabolic Connectivity of the Cortical and Subcortical Regions in Rat Brain During Ketamine-Induced Unconsciousness. Anesthesia & Analgesia. 2022; 135(5):1106-1114.
6.Isabel J. Hildebrandt, Helen Su, Wolfgang A. Weber, Anesthesia and Other Considerations for in Vivo Imaging of Small Animals. ILAR Journal. 2008; 49(1):17–26.
7.Spangler-Bickell MG, de Laat B, Fulton R. et al. The effect of isoflurane on 18F-FDG uptake in the rat brain: a fully conscious dynamic PET study using motion compensation. EJNMMI Res. 2016; 6:86.
8.Grandjean J, Schroeter A, Batata I, Rudin M. Optimization of anesthesia protocol for resting-state fMRI in mice based on differential effects of anesthetics on functional connectivity patterns. Neuroimage. 2014;102:838-847.
9.Woods S, O’Brien LM, Butcher W, et al. Glucosamine-NISV delivers antibody across the blood-brain barrier: Optimization for treatment of encephalitic viruses. Journal of Controlled Release. 2020; 324:644-656.
10.Sun RC, Young LEA, Bruntz RC, et al. Brain glycogen serves as a critical glucosamine cache required for protein glycosylation. Cell Metabolism. 2021;33(7):1404-1417.
11.Sun, PZ, Lu J, Wu Y, Xiao G, Wu R. Evaluation of the dependence of CEST-EPI measurement on repetition time, RF irradiation duty cycle and imaging flip angle for enhanced pH sensitivity. Physics in Medicine & Biology. 2013;58(17):N229.
12.Cohen O, et al. CEST MR fingerprinting (CEST‐MRF) for brain tumor quantification using EPI readout and deep learning reconstruction. MRM. 2023; 89(1): 233-249.
13.Zaiß M, Schmitt B, Bachert P. Quantitative separation of CEST effect from magnetization transfer and spillover effects by Lorentzian-line-fit analysis of z-spectra. Journal of Magnetic Resonance. 2011;211(2):149-155.
14.Jin T, Mehrens H, Wang P, Kim SG. Glucose metabolism-weighted imaging with chemical exchange-sensitive MRI of 2-deoxyglucose (2DG) in brain: Sensitivity and biological sources. Neuroimage.2016;143:82-90.
15.Nasrallah FA, Pagès G, Kuchel PW, Golay X, Chuang KH. Imaging Brain Deoxyglucose Uptake and Metabolism by Glucocest MRI. Journal of Cerebral Blood Flow & Metabolism. 2013;33(8):1270-1278.
16.Rivlin M, Navon G. Glucosamine and N-acetyl glucosamine as new CEST MRI agents for molecular imaging of tumors. Scientific Reports. 2016;6(1):32648.
17.Rivlin M, Navon G. Molecular imaging of cancer by glucosamine chemical exchange saturation transfer MRI: A preclinical study. NMR in Biomedicine. 2020;34(2): e4431.
Figures