3178
Lipid-targeted echo-planar spectroscopic imaging for in-vivo quantification of lipid composition1College of Biomedical Engineering & Instrument Science, Zhejiang University, Hangzhou, China, 2Department of Endocrinology, School of Medicine Sir Run Run Shaw Hospital, Zhejiang University, Hangzhou, China, 3Chinese Academy of Sciences Hangzhou Institute of Medicine, Hangzhou, China, 4MR Collaboration, Siemens Healthcare Ltd, Shanghai, China
Synopsis
Keywords: Molecular Imaging, Metabolism, lipid composition; echo-planar spectroscopic imaging
Motivation: Investigating lipid composition in different tissues in vivo is essential. Demand exists for rapid, high-resolution chemical-shift imaging to analyze lipids.
Goal(s): We aimed to employ EPSI to simultaneously target lipid signals and suppress water, enabling precise in-vivo quantification of lipid composition in various tissues for the first time.
Approach: We implemented EPSI incorporating chemical-shift-selective adiabatic-refocusing pulses for lipid refocusing, with a full-automated pipeline for data reconstruction and lipid composition calculation.
Results: Phantom and in-vivo experiments validate the technique's effectiveness. The technique successfully differentiates various vegetable oils and lipid emulsions precisely and quantifies lipid composition with high spatial resolution in mice’s neck and abdomen.
Impact: Lipid-targeted EPSI technology surpasses traditional single-voxel spectroscopy or multi-echo chemical-shift water-fat imaging by providing higher spatial and spectral resolution, empowering researchers with deeper insights into lipid metabolism for future investigations.
Introduction
Measuring lipid composition provides valuable information beyond lipid content alone1. However, the commonly used single-voxel spectroscopy (SVS) technique is limited by its low resolution2. To address this limitation, echo-planar spectroscopic imaging (EPSI) enables rapid and high-resolution spectroscopic imaging, offering structural and molecular imaging capabilities3. While EPSI techniques have been applied previously in some cases to study brain metabolites, none have been demonstrated for imaging the abdomen or any other body region highly contaminated with motion4. While lipid is the other dominant signal than water in body MRI, which plays a vital metabolic role in many diseases, it has hardly ever been targeted by EPSI to investigate its composition and complicated metabolism pathways5. This study applied the EPSI technique and a fully automated reconstruction and calculation pipeline to quantify body lipid composition by simultaneously achieving lipid targeting and water suppression. Both in-vivo and in-vitro measurement effectiveness were demonstrated.Methods
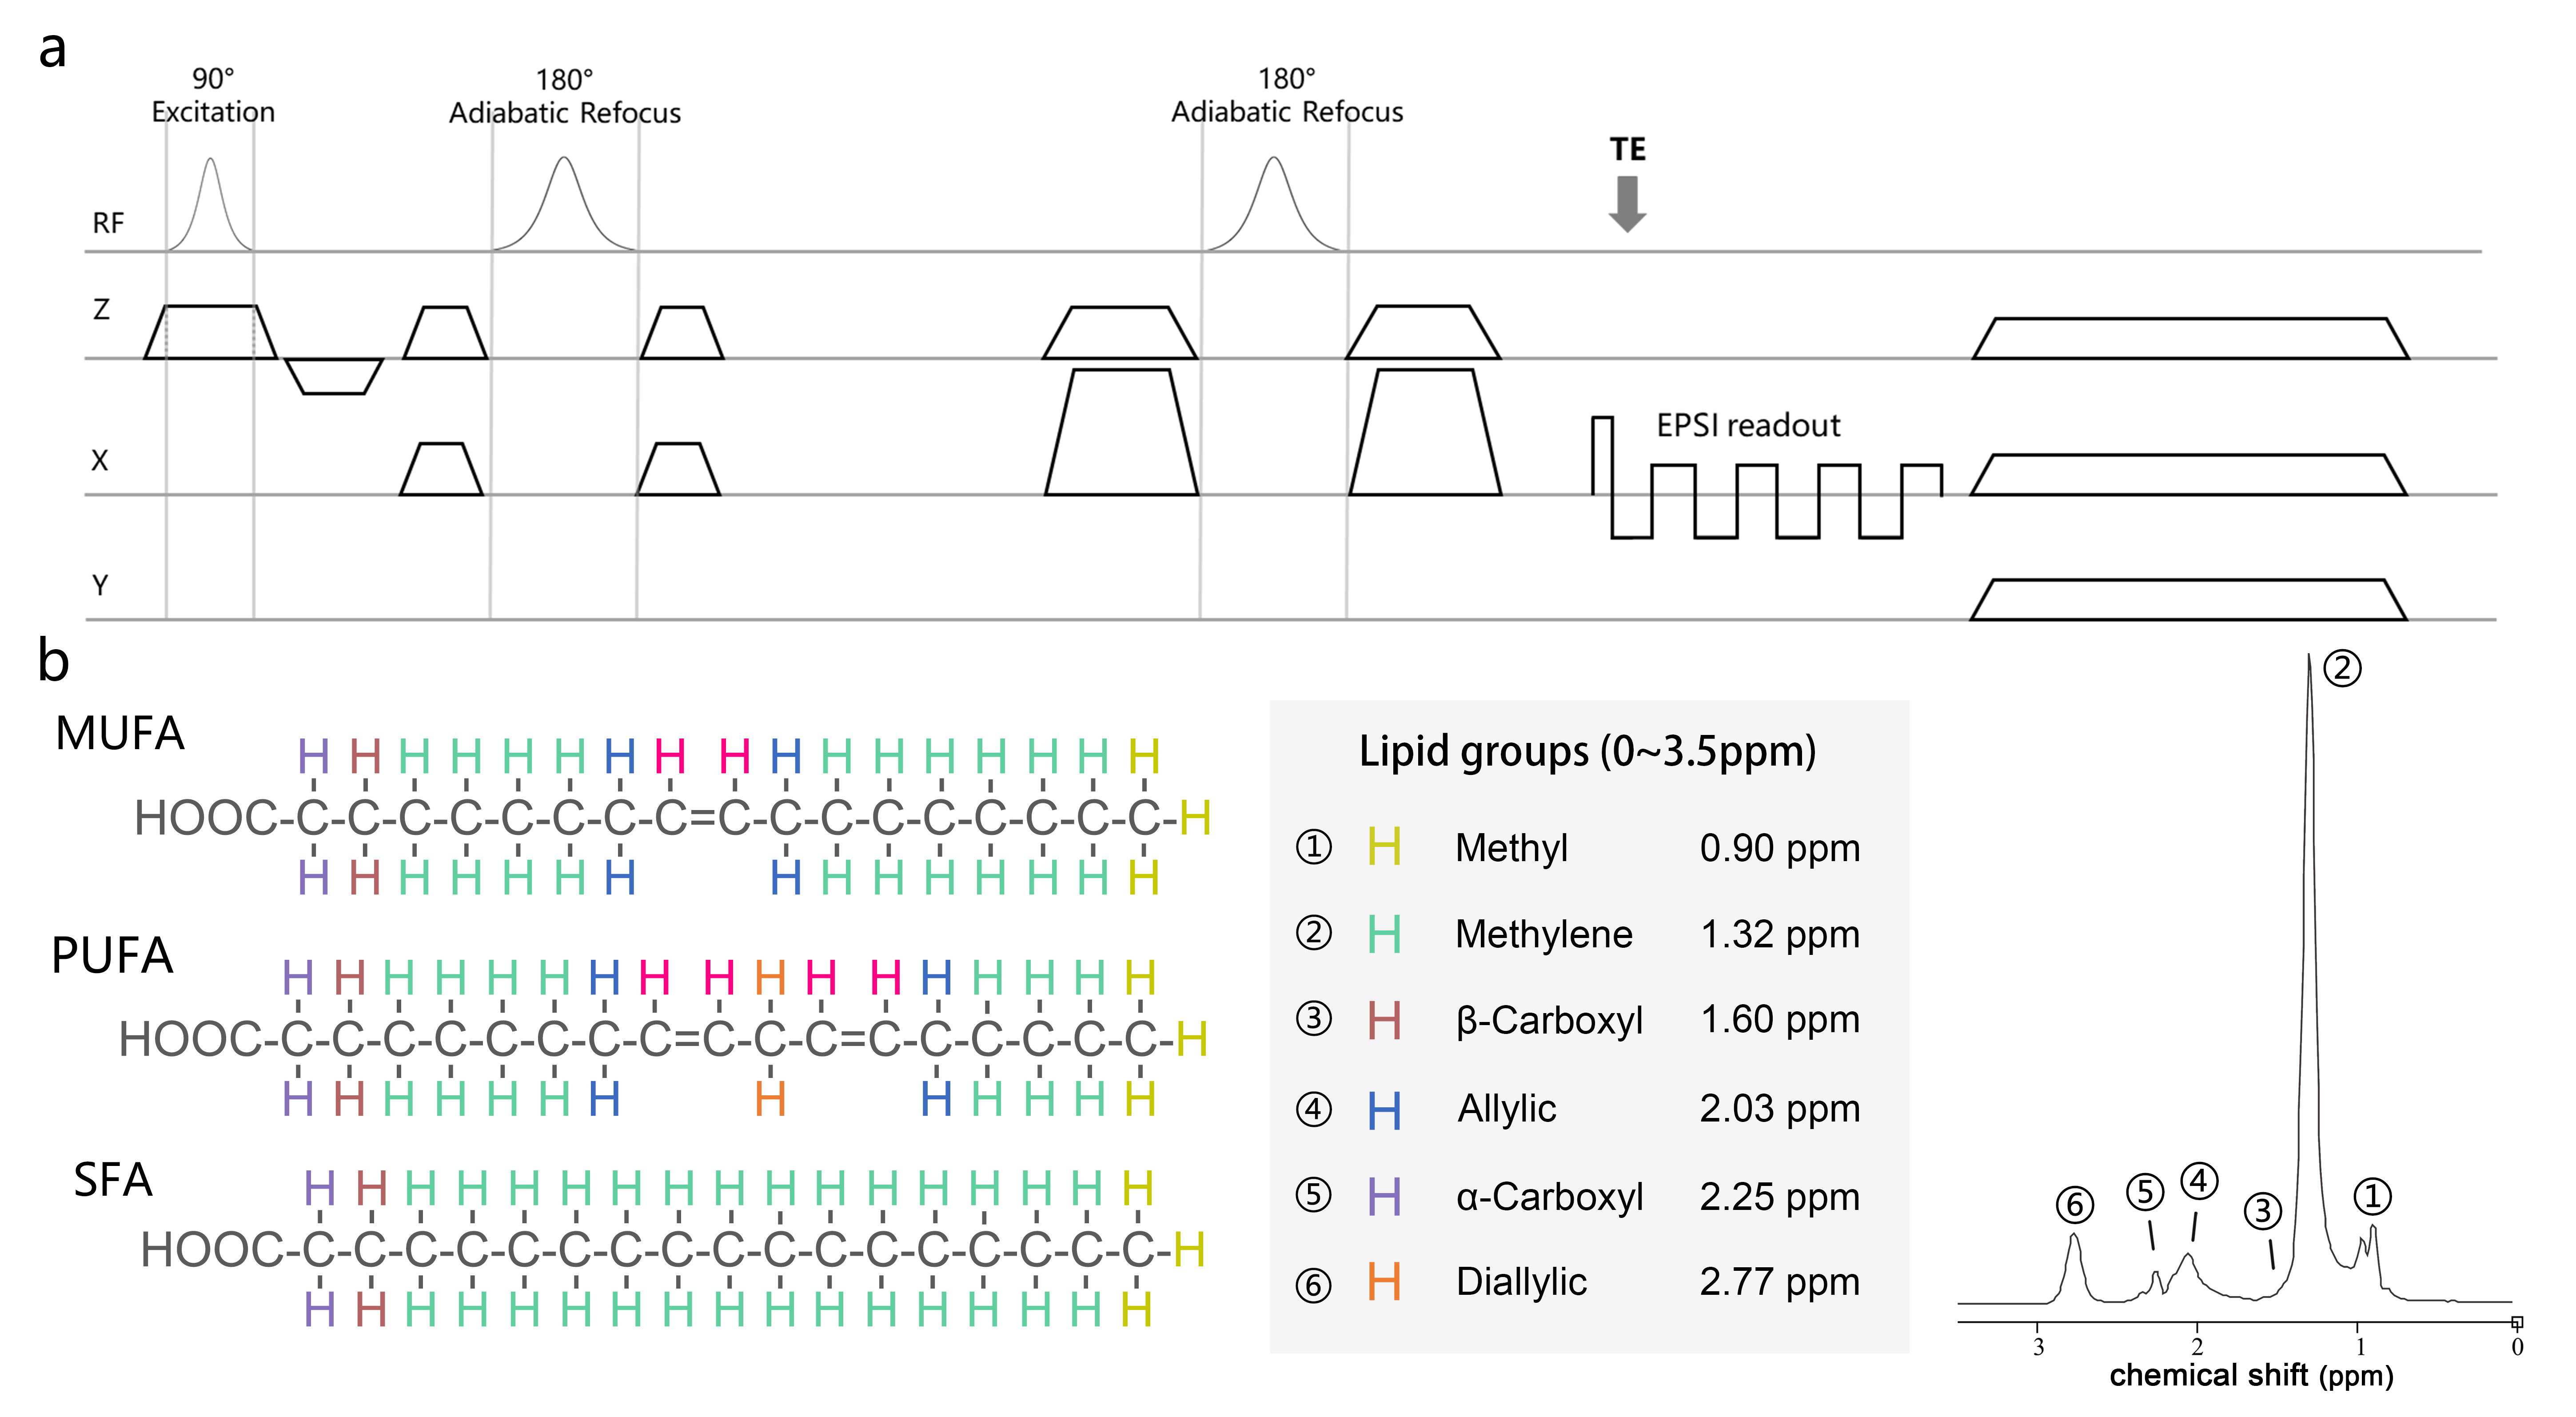
Instruments: Experiments were conducted on a 7T Bruker MRI scanner equipped with a 1H body coil.Sequence Design: The developed sequence is based on the Bruker EPSI sequence and includes a slice-selective excitation pulse and a pair of chemical-shift-selective adiabatic-refocusing pulses with symmetric spoiler gradients (Figure 1a). The pulse parameters included: center frequency = 1.85 ppm; duration = 12 ms; bandwidth = 1467 Hz. The adiabatic pulses selectively refocus lipids while leaving water signals unaffected (Figure 1b).
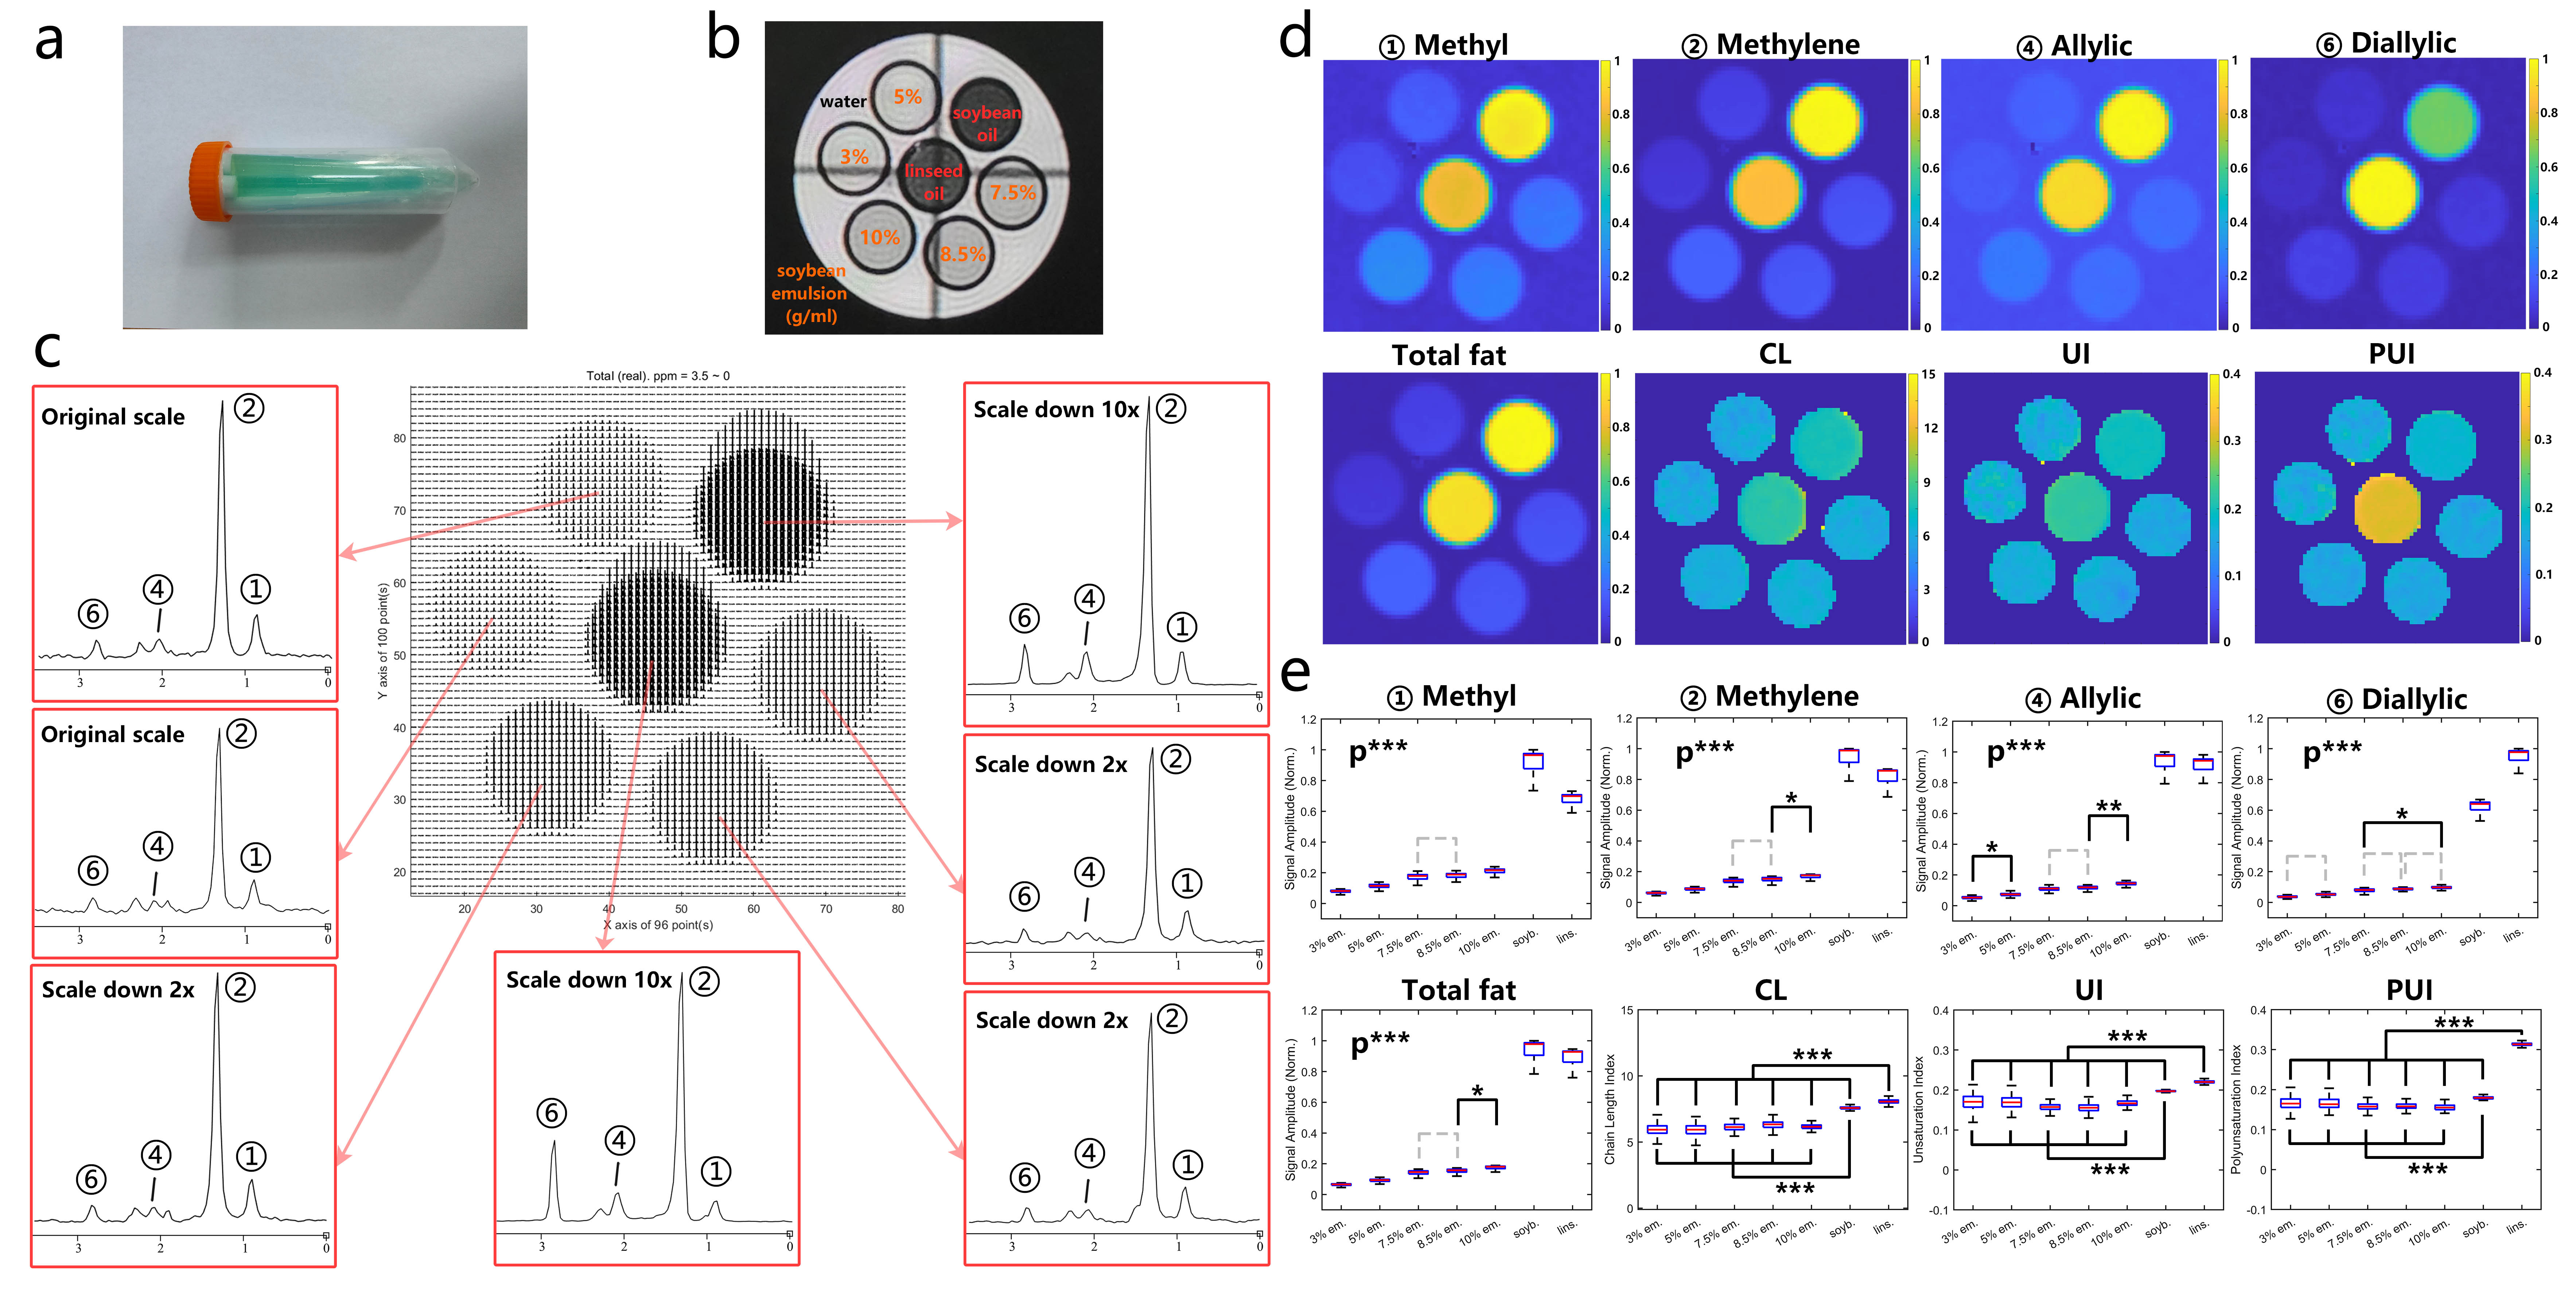
Phantom Experiments: A phantom was created using a 50-ml tube filled with water and seven 1.5-ml tubes filled with linseed oil, soybean oil, and soybean emulsion at various concentrations.
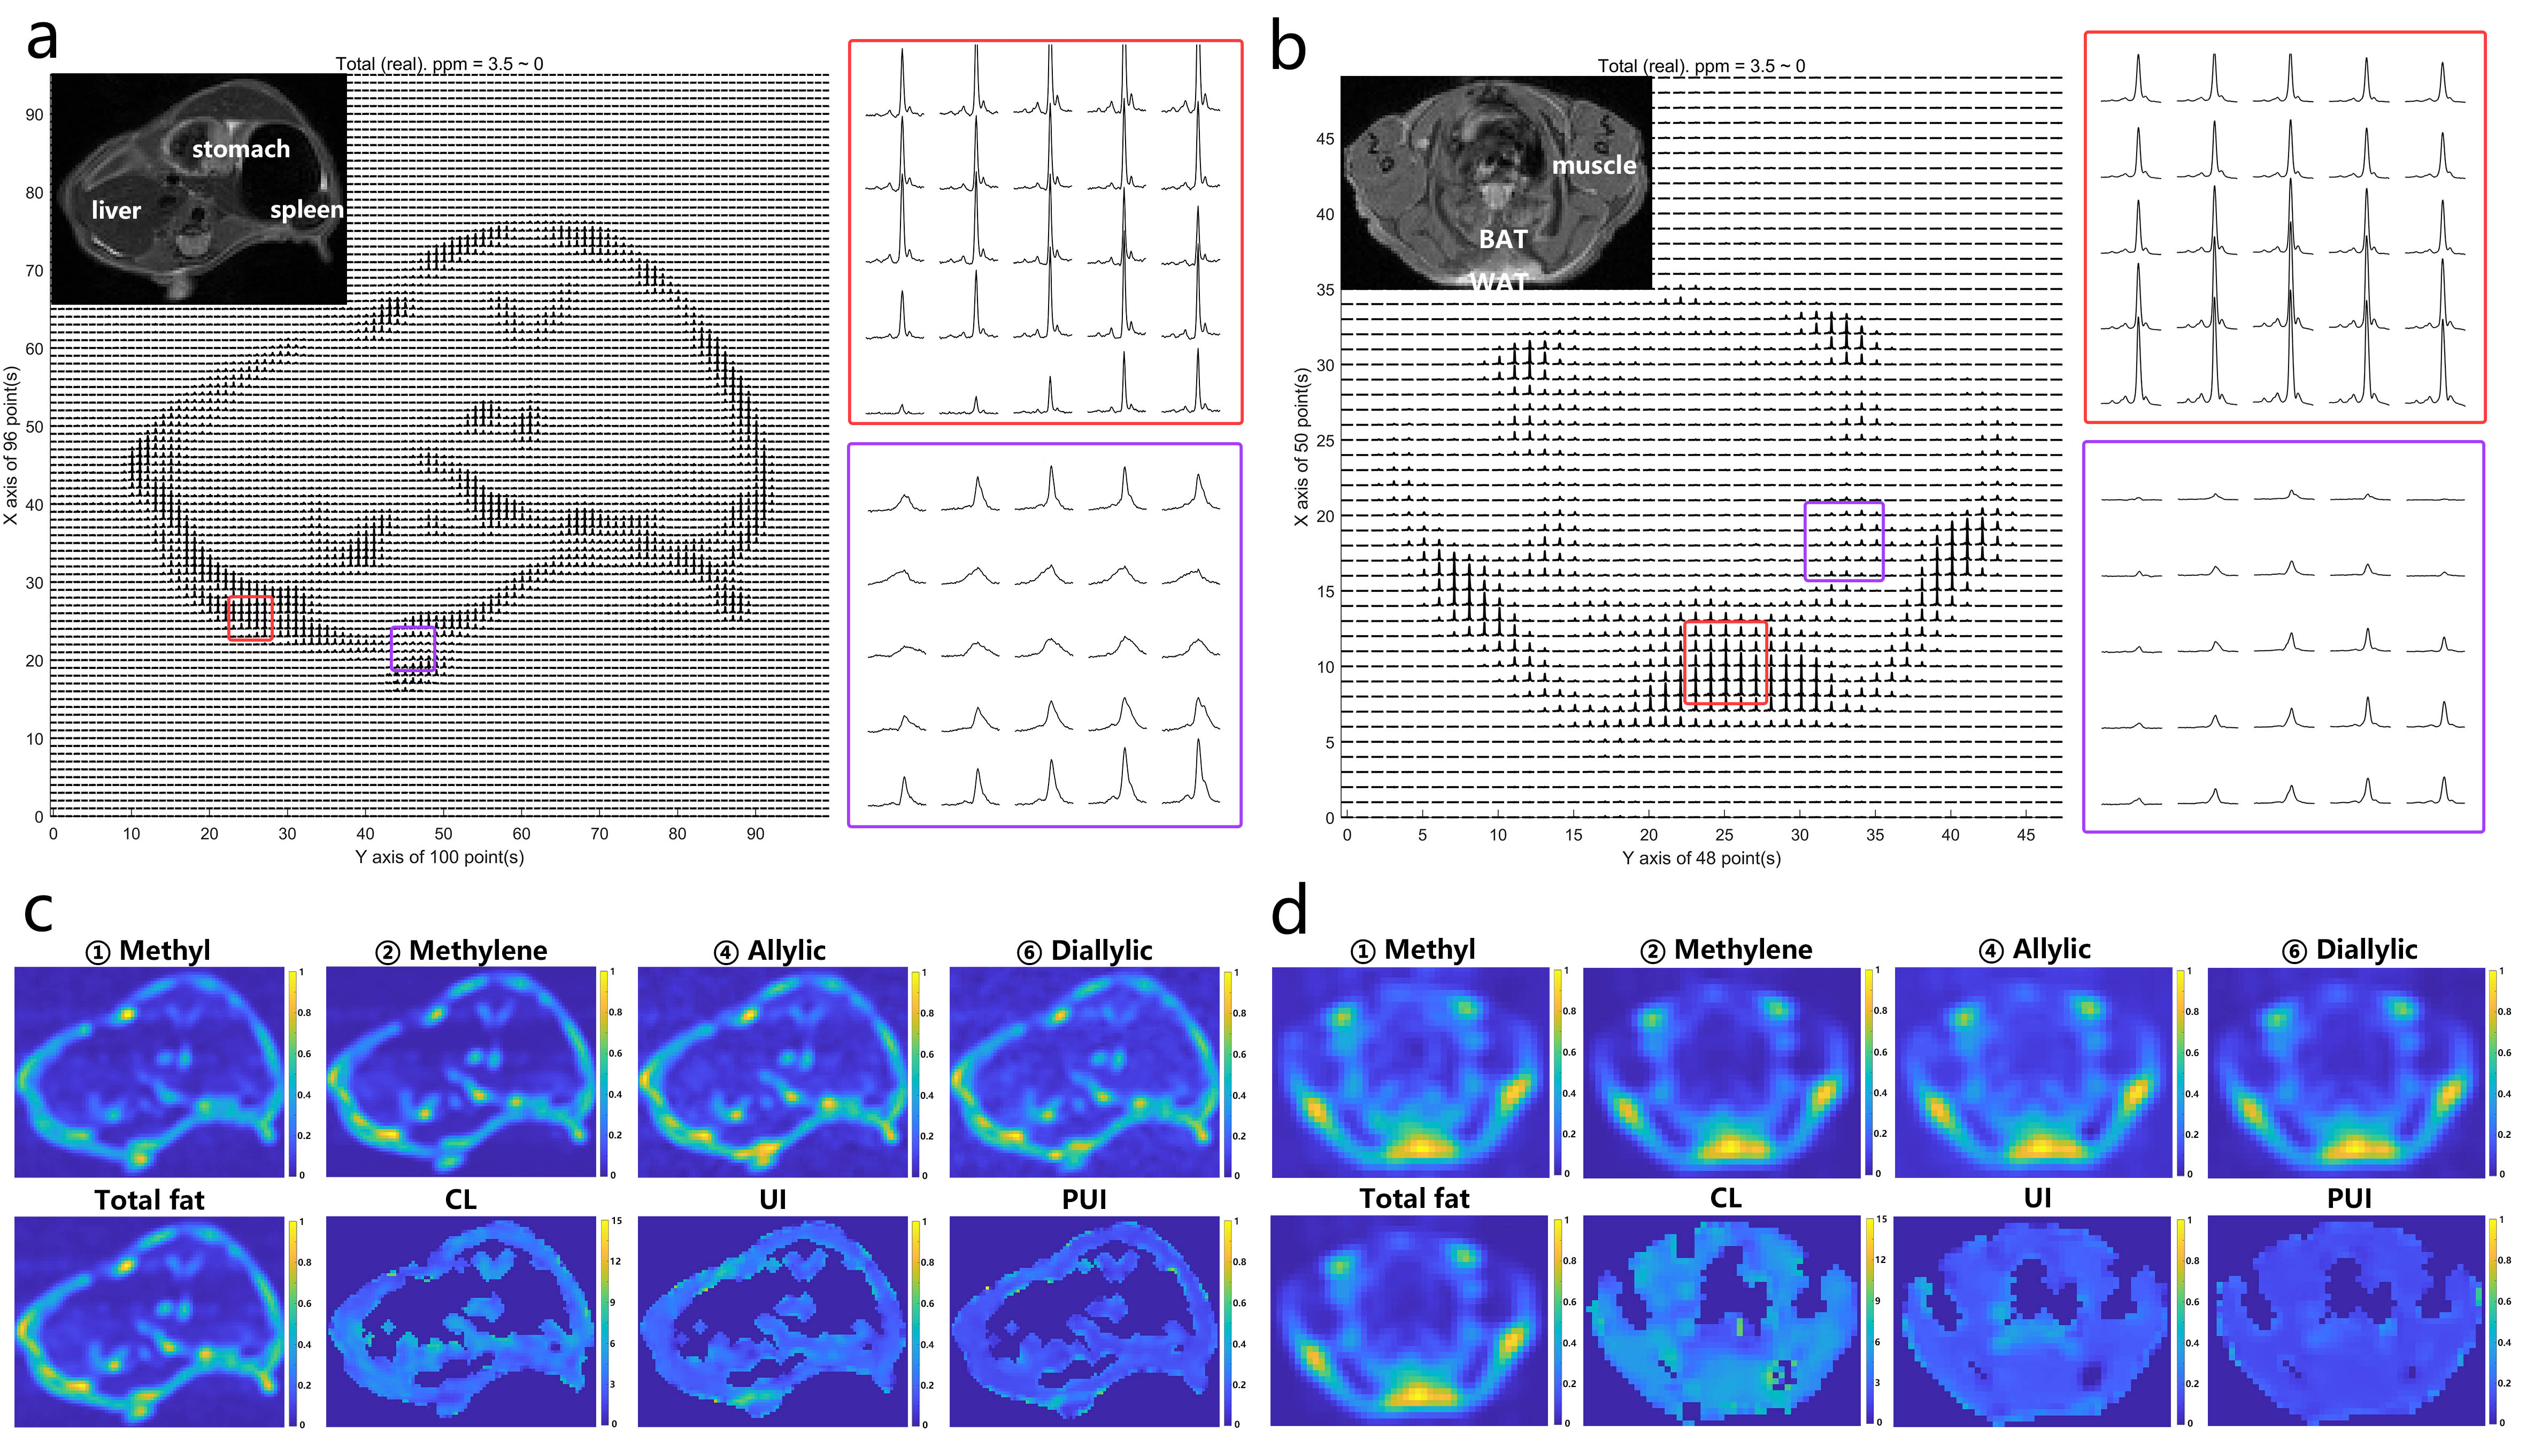
In-vivo Experiments: Anesthetized C57BL/6J female mice underwent abdominal and neck scans under respiratory gating.
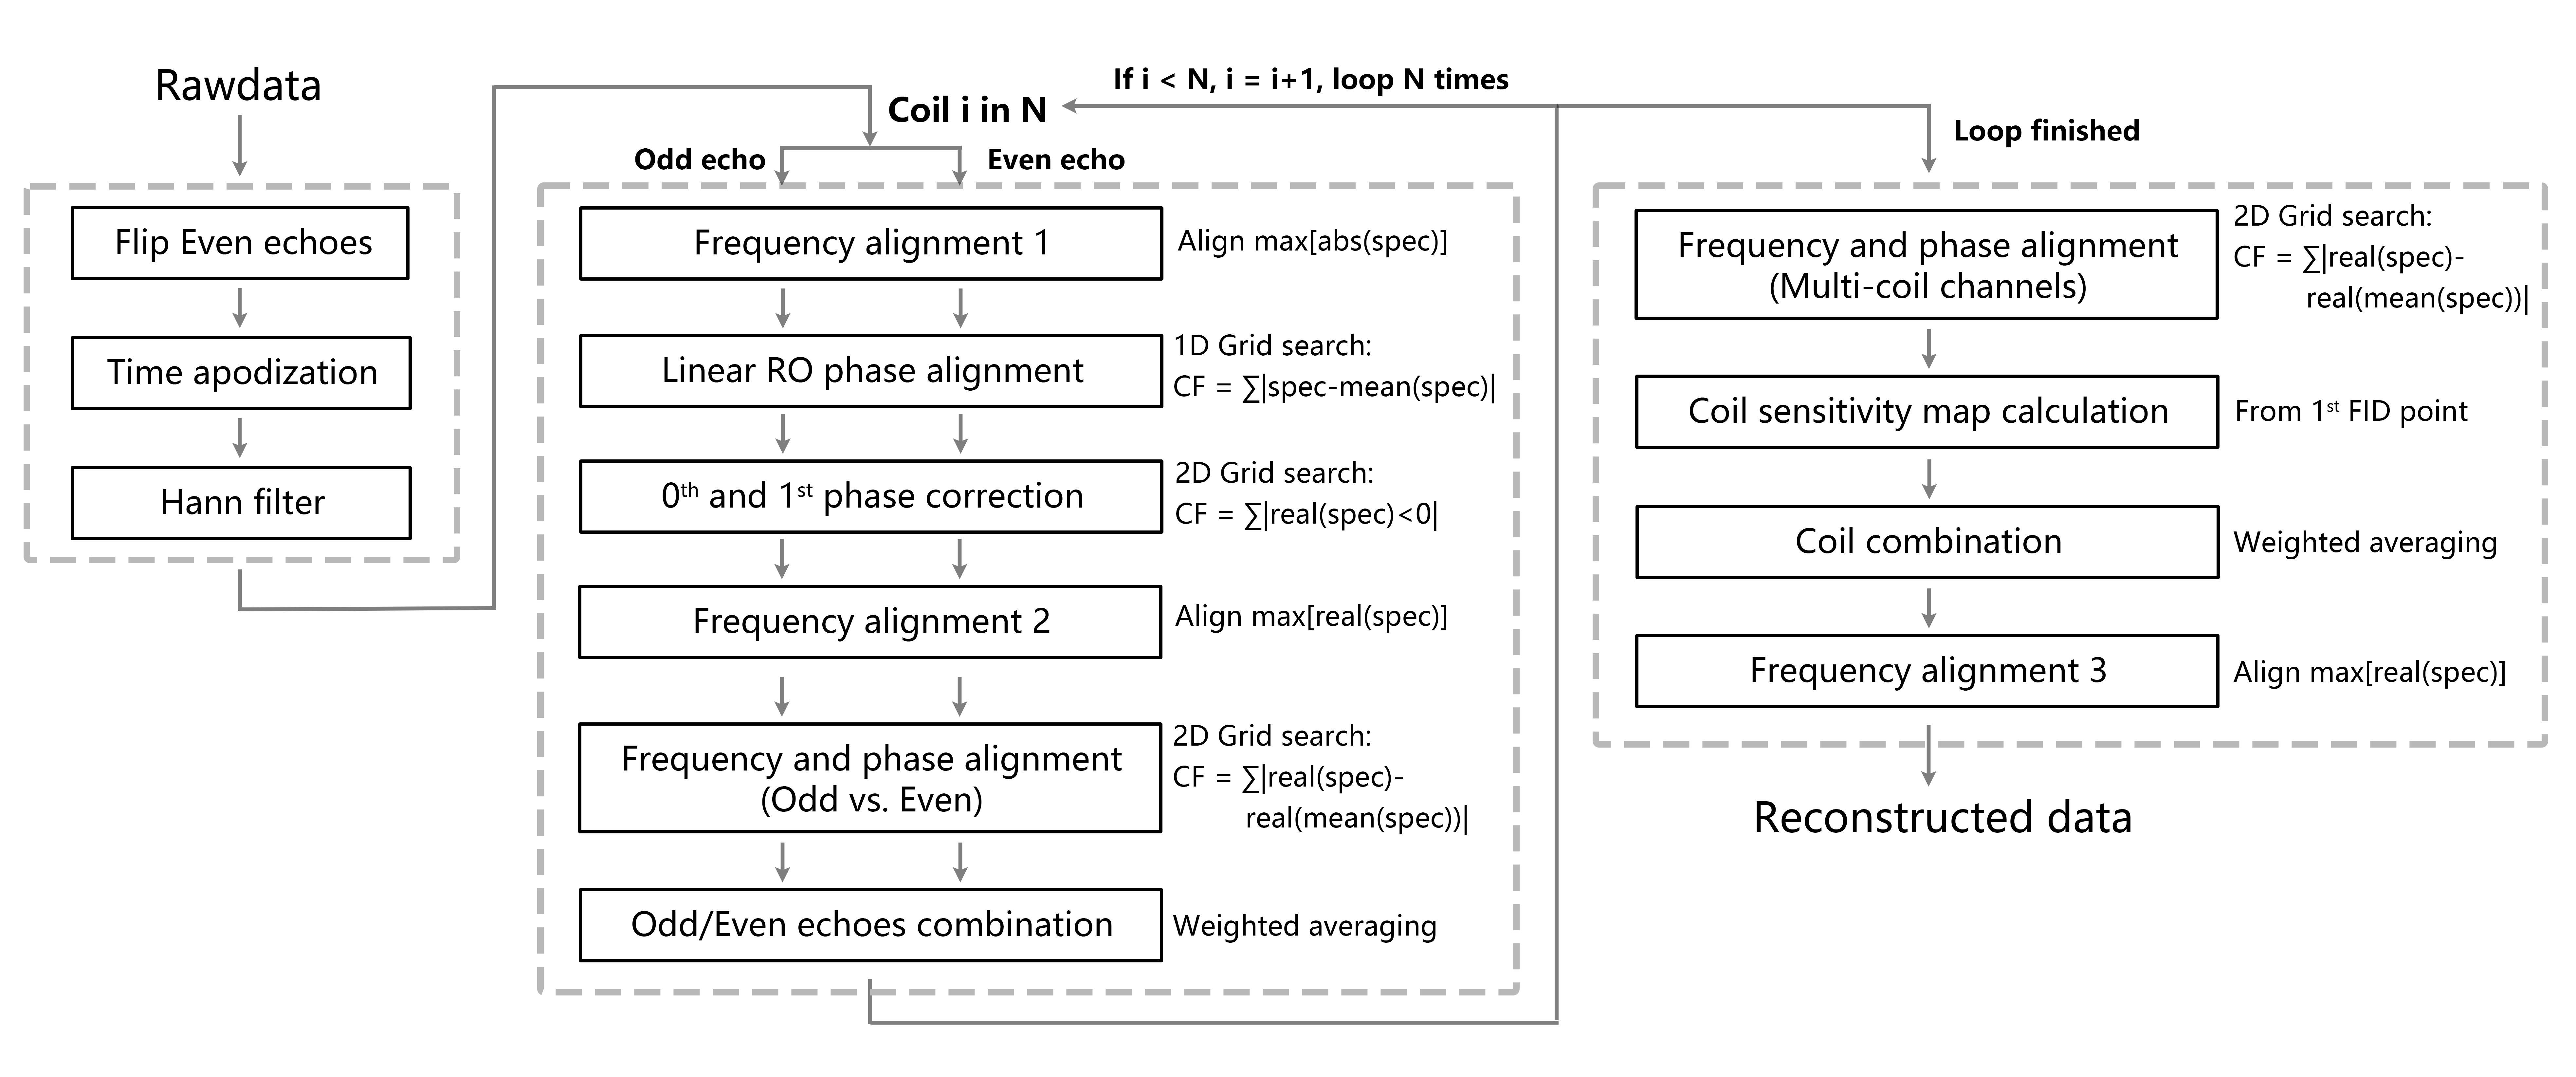
Data Reconstruction: The fully automated reconstruction pipeline (Figure 2) involved filtering, separate phase/frequency correction of odd and even echoes, weighted averaging, individual processing of coil channels, and final combination.
Index Calculation: The lipid signal amplitude (S) was obtained by integrating the lipid resonance. Lipid composition indices were calculated as follows: chain length index (CL) of 3Smethylene/2Smethyl, unsaturation index (UI) of Sallylic/Smethylene, and polyunsaturation index (PUI) of Sdiallylic/Smethylene.
Results
Figure 3 presents the total EPSI plane showing pixel-by-pixel spectra of different oil/emulsion tubes. In Figure 3c, individual tubes are magnified to highlight the intricate details of the spectra, revealing various lipid resonances. Automated correction and alignment were applied to zero-order phases, first-order phases, and chemical shifts in the spectra. Signal amplitudes and lipid composition indices calculated from different lipid resonances were visualized in Figure 3d and summarized in Figure 3e. The signal amplitude of soybean emulsions increased with concentration. Compared to emulsions, both oils exhibited higher fat content across all lipid resonances. Linseed oil showed significantly higher Sdiallylic, CL, UI, and PUI than soybean oil and emulsions, indicating a higher polyunsaturated lipid content. Additionally, soybean oil had significantly higher CL, UI, and PUI than soybean emulsions, suggesting a higher unsaturated/polyunsaturated lipid content.Figure 4 displays the total EPSI planes of the abdomen and neck in rodents. Regions with good B0 homogenization (red) were compared to those with poor B0 homogenization (purple). Inadequate B0 shimming-induced linewidth broadening led to signal overlap that contaminated the calculation of lipid composition indices. The purple regions in Figures 4a and 4b exhibit a pseudo-highlighted effect in the corresponding UI and PUI subgraphs depicted in Figures 4c and 4d, respectively. Contaminated voxels can be identified using the spectral shape of individual pixels, demonstrating the capability of EPSI to visually identify and exclude contaminated voxels from analysis.
Discussion
Lipid composition can be influenced by various factors such as fasting, dietary intake, cold exposure, and pharmacological interventions6. Understanding lipid composition is crucial for comprehending human physiological activities and cellular metabolic processes7. Current methods for in-vivo analysis of lipid composition include SVS and multi-echo chemical-shift water-fat imaging8. Beyond those methods, lipid-targeted EPSI technology enables water suppression while acquiring lipid signals. Inconsistencies between odd and even echoes can cause Nyquist ghosts in the spectral dimension9. Existing ghost correction approaches designed for the brain may perform poorly in the body due to poor B0 homogeneity, especially at tissue boundaries10. In this study, an iterative method was used to align and average odd and even echoes before coil combination, for which a half-spectral bandwidth is acceptable, given the narrow chemical shift range of lipids.Conclusion
We implemented a lipid-targeted EPSI for body imaging, offering an innovative methodology for quantifying lipid composition in vivo. This EPSI approach successfully measured the lipid composition in mice and a multi-compartmental lipid phantom. This approach allows future investigations into fundamental lipid metabolic pathways involved in many diseases.Acknowledgements
No acknowledgement found.References
1. Lin D, Zhou J, Cao Y, et al. Echo time optimization for in-vivo measurement of unsaturated lipid resonances using J-difference-edited MRS. Magn Reson Med. 2023; doi:10.1002/mrm.29807.
2. Ouwerkerk R, Hamimi A, Matta J, et al. Proton MR Spectroscopy Measurements of White and Brown Adipose Tissue in Healthy Humans: Relaxation Parameters and Unsaturated Fatty Adds. Radiology. 2021;299(2):396-406.
3. Du W, Du YP, Fan X, Zamora MA, Karczmar GS. Reduction of spectral ghost artifacts in high-resolution echo-planar spectroscopic imaging of water and fat resonances. Magn Reson Med. 2003;49(6):1113-1120.
4. Weng G, Radojewski P, Sheriff S, et al. SLOW: A novel spectral editing method for whole-brain MRSI at ultra high magnetic field. Magn Reson Med. 2022;88(1):53-70.
5. Wymann MP, Schneiter R. Lipid signalling in disease. Nat Rev Mol Cell Biol. 2008;9(2):162-176.
6. Bartelt A, Heeren J. Adipose tissue browning and metabolic health. Nat Rev Endocrinol. 2014;10(1):24-36.
7. Gohlke S, Zagoriy V, Cuadros Inostroza A, et al. Identification of functional lipid metabolism biomarkers of brown adipose tissue aging. Mol Metab. 2019;24:1-17.
8. Peterson P, Trinh L, Mansson S. Quantitative (1) H MRI and MRS of fatty acid composition. Magn Reson Med. 2021;85(1):49-67.
9. Labadie C, Hetzer S, Schulz J, Mildner T, Aubert-Frecon M, Moller HE. Center-out echo-planar spectroscopic imaging with correction of gradient-echo phase and time shifts. Magn Reson Med. 2013;70(1):16-24.
10. Nam KM, Hendriks AD, Boer VO, Klomp DWJ, Wijnen JP, Bhogal AA. Proton metabolic mapping of the brain at 7 T using a two-dimensional free induction decay-echo-planar spectroscopic imaging readout with lipid suppression. NMR Biomed. 2022;35(10):e4771.
Figures