3177
Simulations of systematic error in a new quantitative BOLD method incorporating an independent measure of deoxygenated blood volume1Department of Medical Physics and Clinical Engineering, St. Vincent’s University Hospital, Dublin, Ireland, 2School of Life Sciences, University of Nottingham, Nottingham, United Kingdom
Synopsis
Keywords: Oxygenation, Oxygenation, qBOLD
Motivation: To investigate sources of error in a new quantitative BOLD technique incorporating an independent measure of deoxygenated blood volume.
Goal(s): Simulate the effect of systematic error and system noise on estimates of oxygen extraction fraction.
Approach: Monte Carlo simulations of the random walk of protons around deoxygenated blood vessels modelled as infinite cylinders were performed using a standard approach.
Results: These simulations show that introducing an independent measure of DBV into the qBOLD framework provides improved estimates of oxygen extraction fraction.
Impact: This improved technique for mapping oxygen extraction has wide applications in the study of neurological disorders including stroke, dementia and cancer.
Introduction
The quantitative BOLD (qBOLD) technique provides the capability to non-invasively and quantitatively map the oxygen extraction fraction (OEF) on a regional level1,2. OEF is derived from the ratio of the irreversible transverse relaxation rate (R2′) and the deoxygenated blood volume (DBV), the latter of which has been found to be overestimated for asymmetric spin echo (ASE) based acquisitions leading to an underestimation of OEF3. Recently it was proposed4 that an independent measure of DBV could be acquired by using the BOLD response to administration of medical oxygen5 dubbed hyperoxia qBOLD (hqBOLD). In this simulation study the potential for systematic error due to physiological variability and the effect of noise were both examined for the proposed hqBOLD technique and compared with simulations of ASE based qBOLD (standard qBOLD).Methods
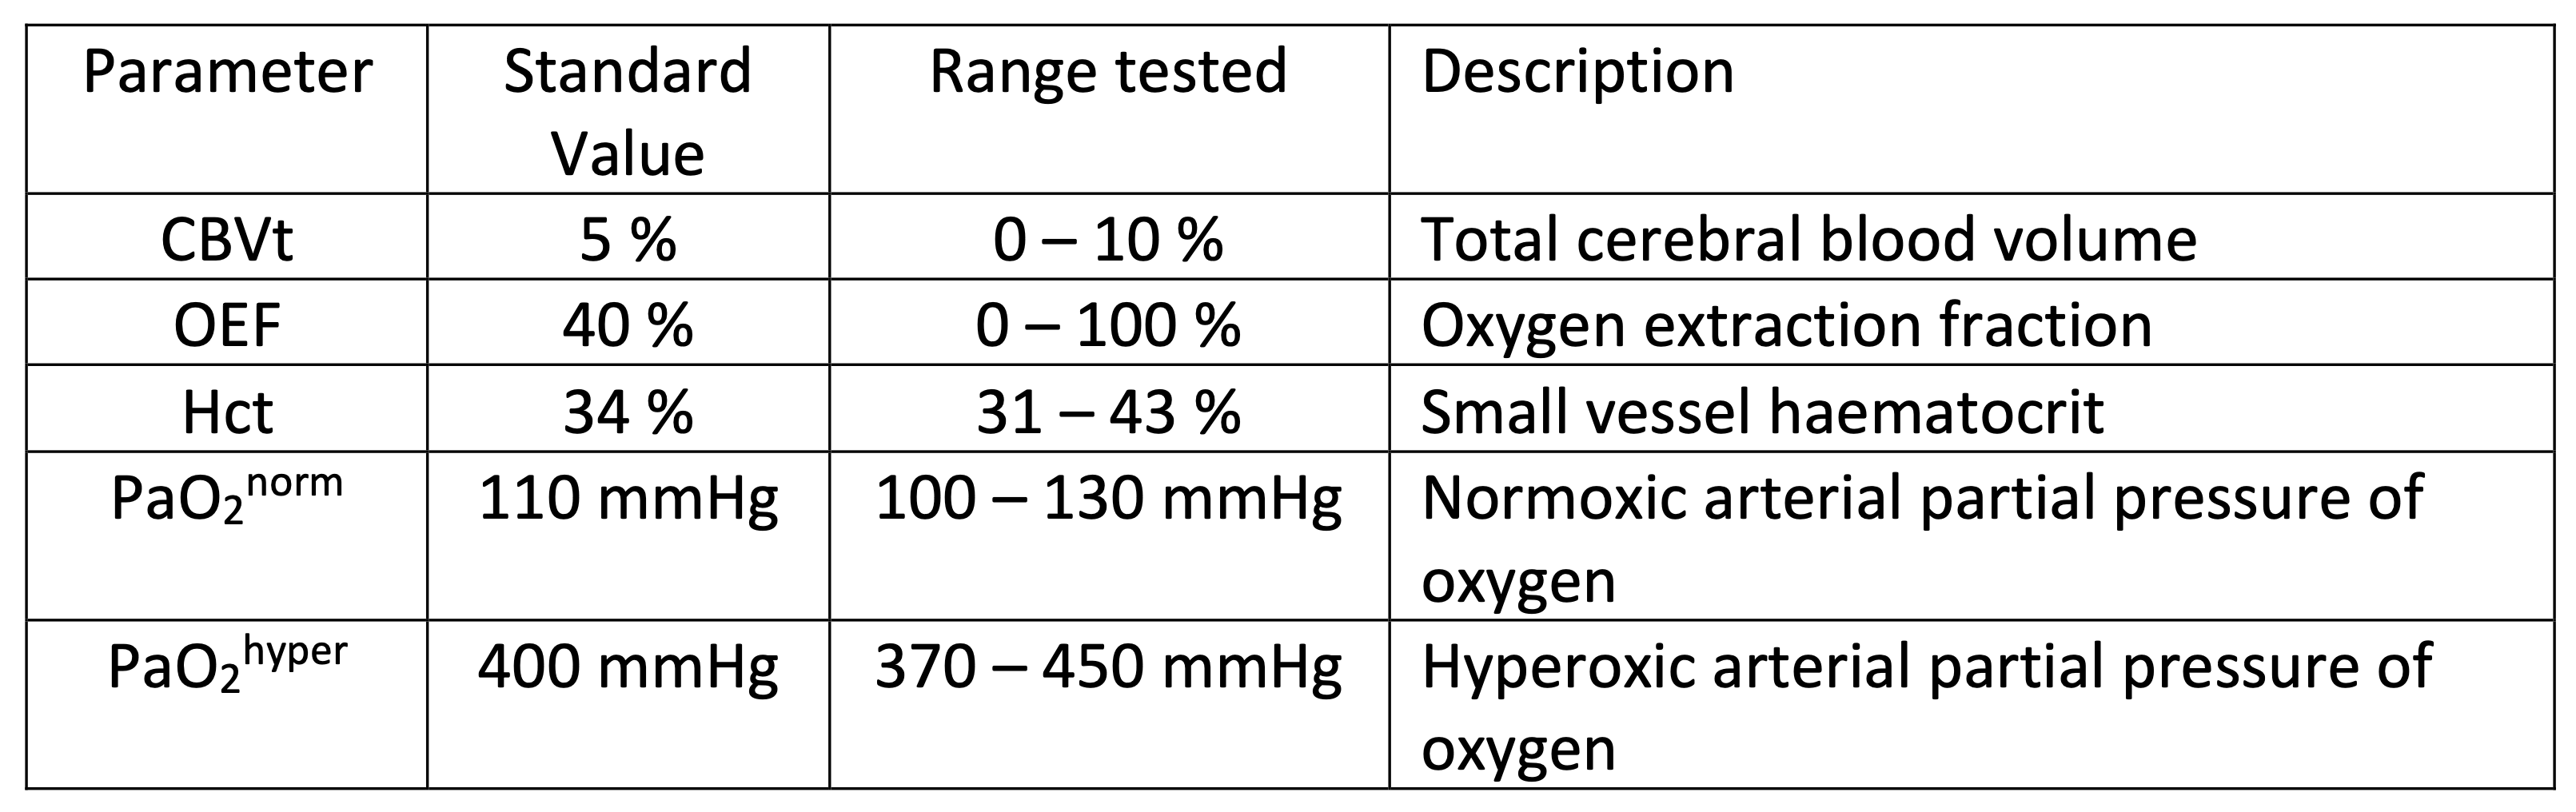
Simulations of the qBOLD and hyperoxia-BOLD signal were performed using a previously reported Monte Carlo based approach6. Modifications were made to model the hyperoxia BOLD signal using a model of oxygen transport7.Systematic error was investigated in the absence of system noise and incorporated variations in physiology by randomly generating values in a predefined range (Figure 1) using a uniform random number generator5. These values were used to generate ASE and BOLD signals for 1,000 different physiological states. These signals were processed to generate estimates of R2′ and OEF.
The effect of noise was investigated by simulating signals for standard physiological values (Figure 1). Representative Gaussian noise (ASE SNR 52, BOLD SNR 87) was added to these signals before calculating R2′, DBV and OEF and repeated 20,000 times. To account for the averaging process inherent in the experimental linear regression analysis, multiple signals with added noise were generated for normoxia and hyperoxia and averaged before calculating the BOLD signal change.
Results
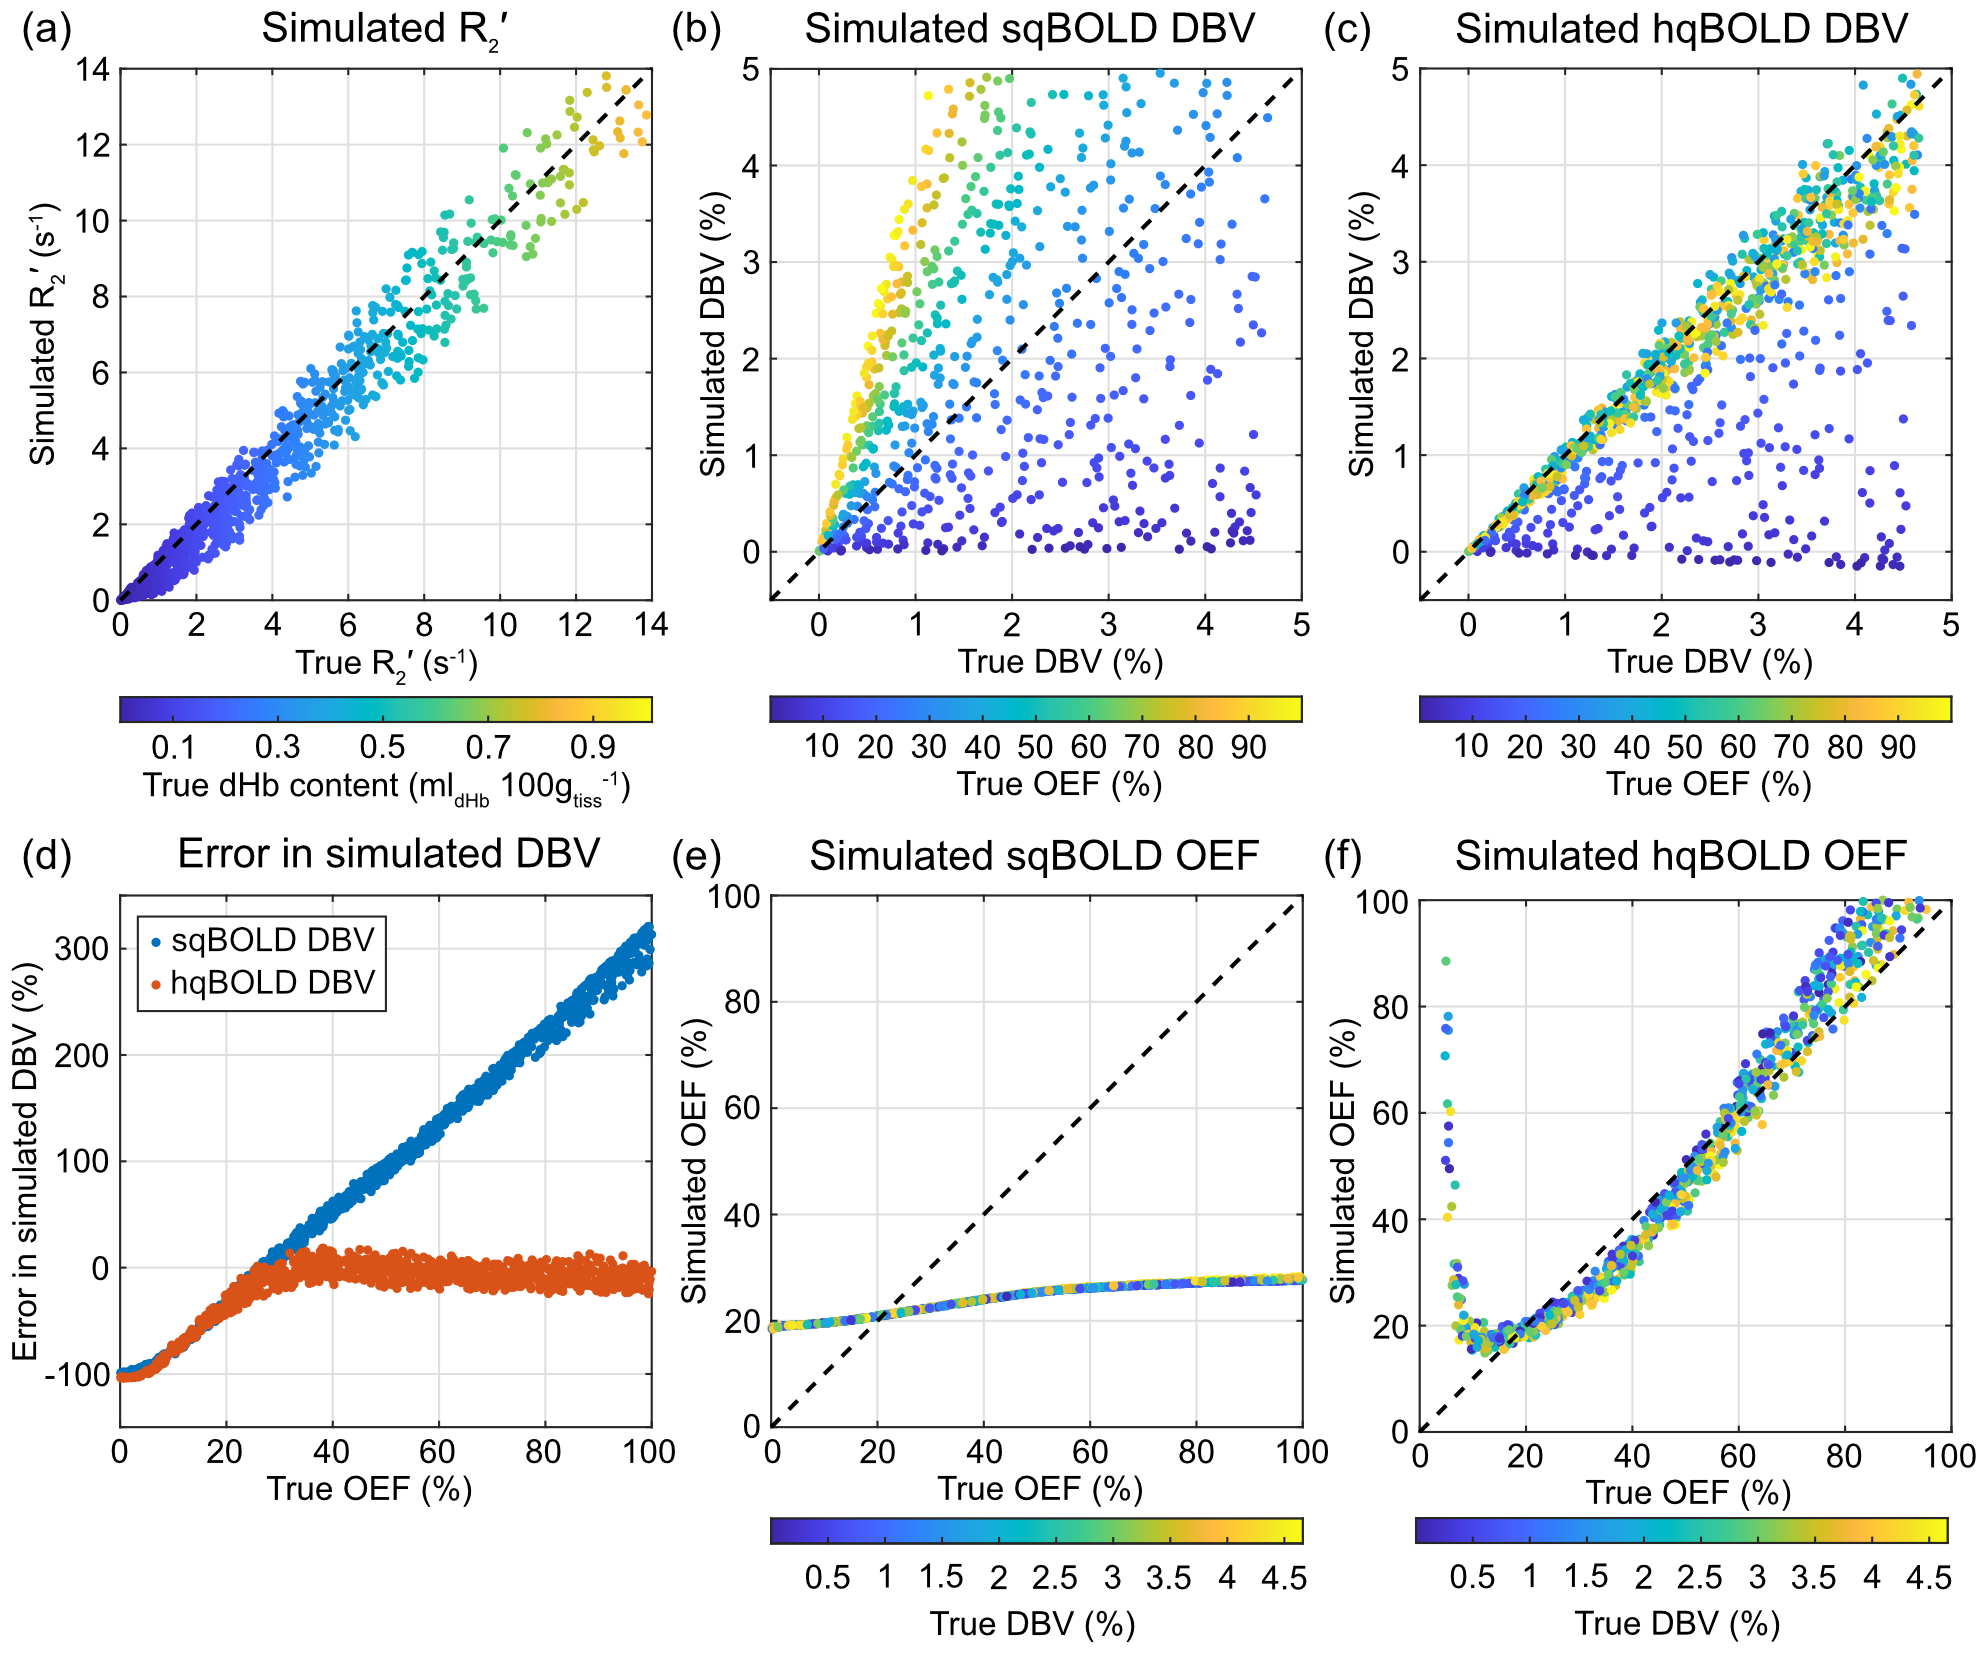
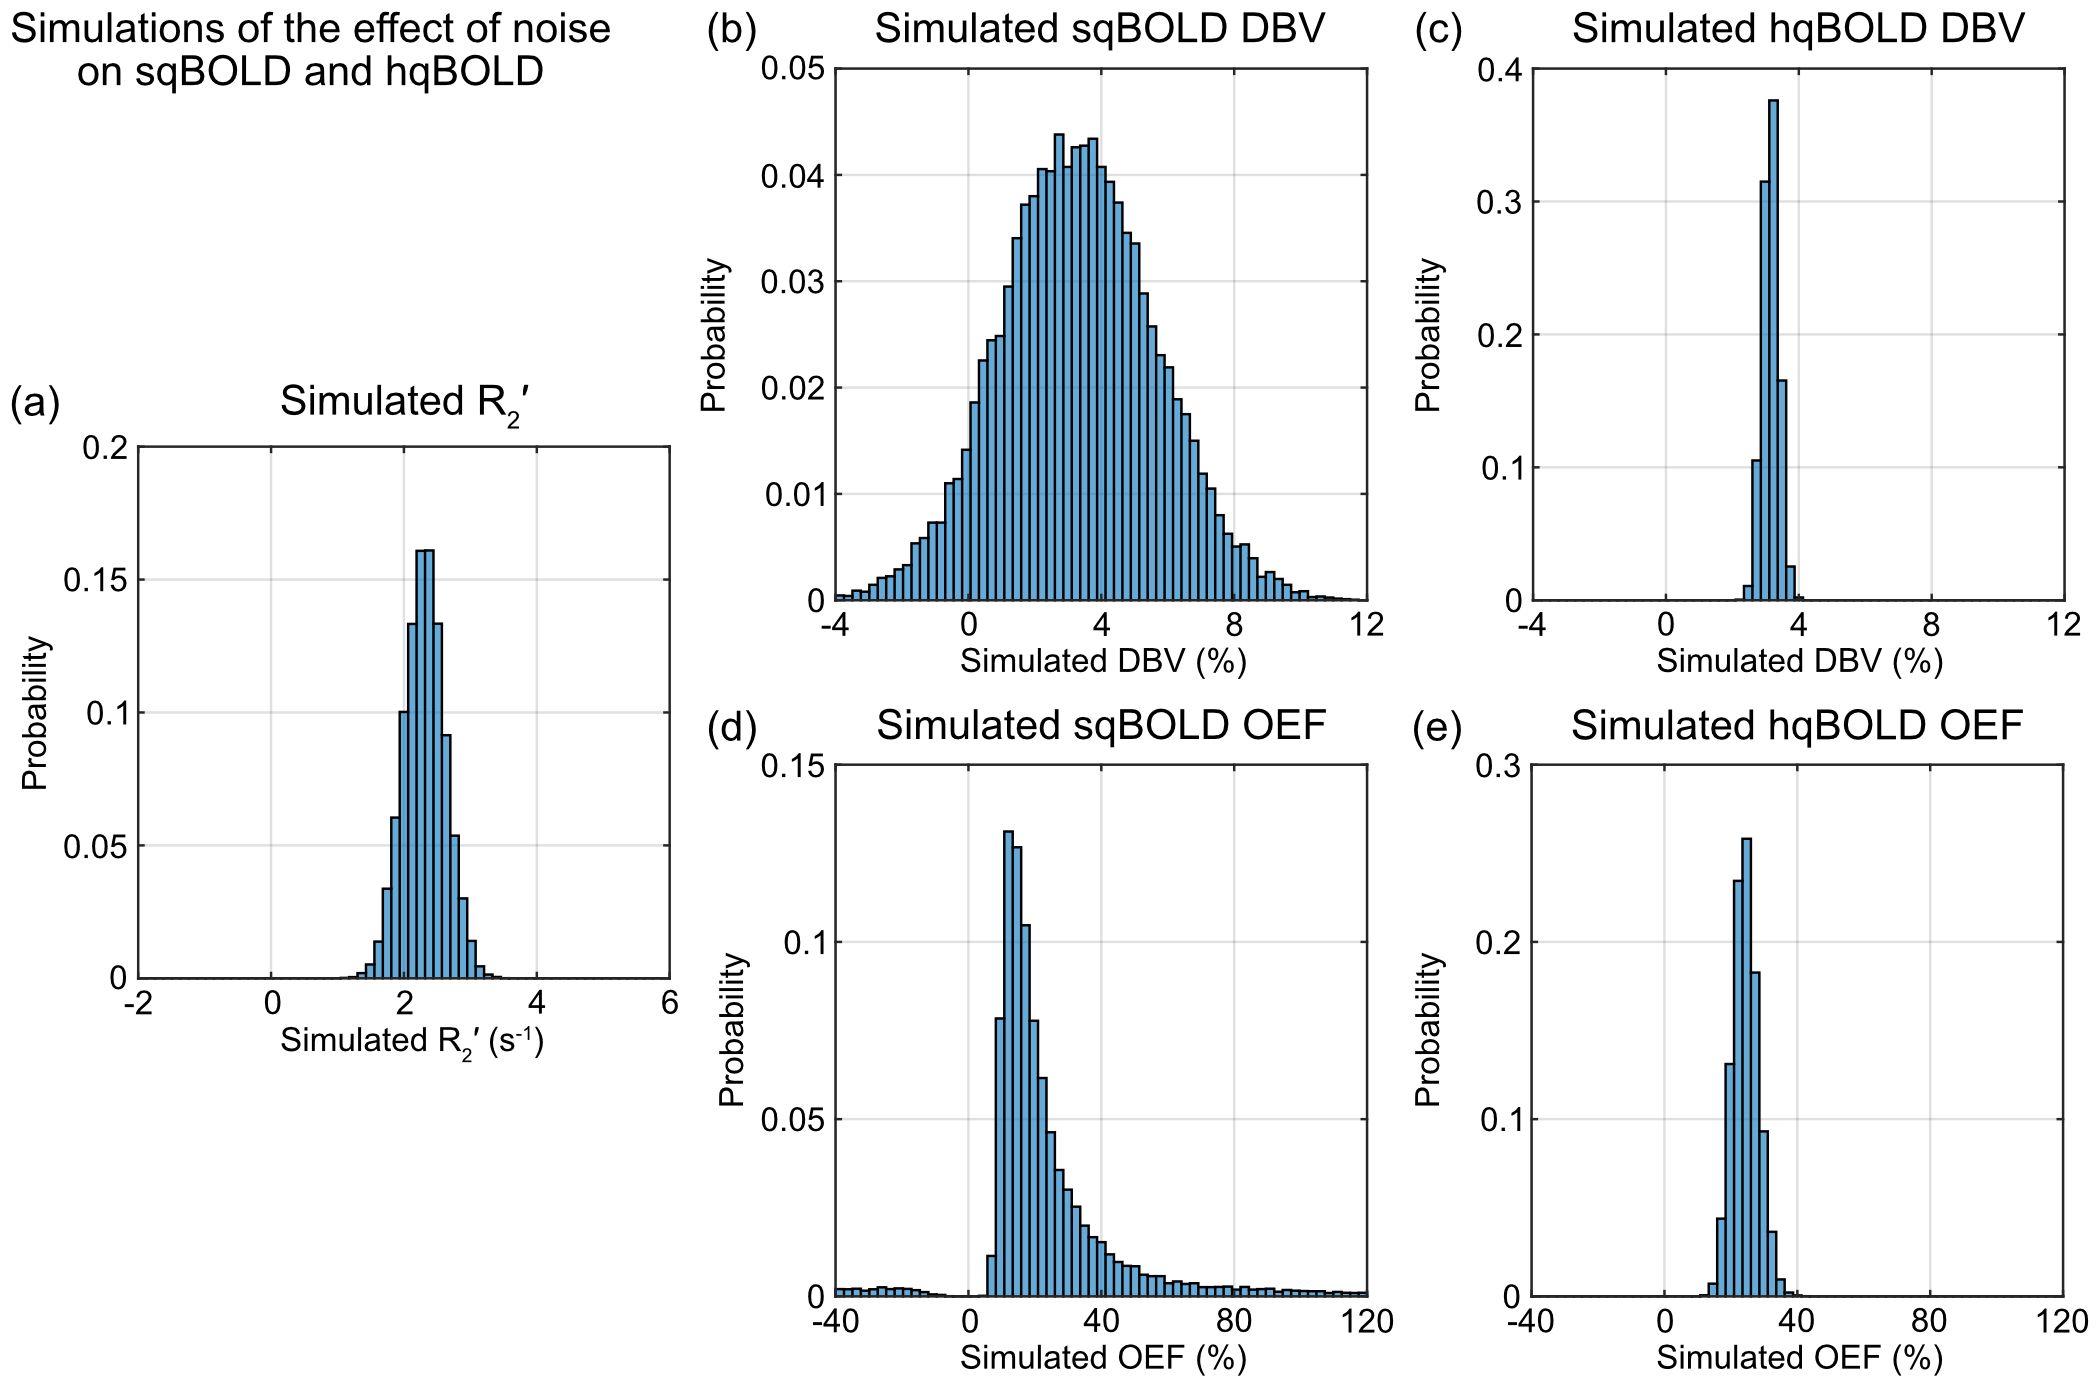
Figure 2 presents the simulation of systematic error. The R2′ estimated from the simulated qBOLD data is plotted against the true R2′ based on the ‘true’ static dephasing qBOLD model8 (Fig. 2a). The DBV from standard qBOLD shows a large amount of uncertainty which increases with true OEF when compared with true DBV (Fig. 2b). Whilst the DBV from hyperoxia BOLD has a much lower uncertainty when OEF ≳ 30 % (Fig. 2c). The OEF from standard qBOLD does increase with true OEF, but has a very small dynamic range (Fig. 2d). Finally, the OEF from hyperoxia qBOLD increases monotonically with true OEF for OEF > 20 % with a dynamic range consistent with the full range of OEF (Fig. 2e).Figure 3 presents simulations of the effect of system noise. The true R2′ was estimated to be 2.8 s-1, whilst the median value simulated was 2.3 s-1 (Fig. 3a). Standard qBOLD DBV had an interquartile range (IQR) of 3.2 % (Fig. 3b), compared with the hyperoxia BOLD DBV IQR of 0.0033 % (Fig. 3c). The main difference in the standard qBOLD and hyperoxia qBOLD estimates of OEF is in their propensity for outliers, with the former having an excess kurtosis value of 5826.1 (Fig. 3d) and the latter a value of 0.1 (Fig. 3e).
Discussion
Simulations of the standard BOLD technique were consistent with previous results6, namely that R2′ is linearly related to the true R2′, that standard qBOLD DBV is a function of the OEF and this leads to a reduced dynamic range of OEF measurements with standard qBOLD.Simulations of the new hyperoxia qBOLD technique predict a considerable improvement in estimates of both DBV and OEF compared with the standard qBOLD technique. These results also provide an independent confirmation of the heuristic model for scaling the hyperoxia BOLD signal change to DBV. This heuristic was developed using an entirely different model to the one presented here based on analytical models of three vascular compartment5. In this previous work a narrower range of healthy OEF values were simulated (35 – 55 %). Despite this, the heuristic model generalises well to the much larger OEF range simulated in this study (0 – 100 %) (Fig. 2d). This is emphasised by the close correspondence between hyperoxia BOLD DBV and true DBV with a slope of 0.95 for OEF > 30 % (Fig. 2c). Therefore, when combined with the simulated measurement of R2′, the dynamic range of hyperoxia qBOLD is markedly improved.
Using representative noise levels estimated from the data, the simulations show that for a single physiological state the uncertainty in standard qBOLD DBV (Fig. 3b) is considerably larger than for hyperoxia BOLD (Fig. 3c).
Conclusions
These simulations show that introducing an independent measure of DBV into the qBOLD framework provides improved estimates of OEF.Acknowledgements
This work was funded by EPSRC grant EP/K025716/1.References
1. An H, Lin W, Celik A, Lee YZ. Quantitative measurements of cerebral metabolic rate of oxygen utilization using MRI: A volunteer study. NMR Biomed. 2001;14(7-8):441-447. doi:10.1002/nbm.7172. He X, Yablonskiy DA. Quantitative BOLD: Mapping of human cerebral deoxygenated blood volume and oxygen extraction fraction: Default state. Magn Reson Med. 2007;57(1):115-126. http://doi.wiley.com/10.1002/mrm.21108
3. Stone AJ, Blockley NP. A streamlined acquisition for mapping baseline brain oxygenation using quantitative BOLD. Neuroimage. 2017;147(October 2016):79-88. doi:10.1016/j.neuroimage.2016.11.057
4. Stone A, Blockley NP. Improving qBOLD based measures of brain oxygenation using hyperoxia BOLD derived measures of blood volume. In: Proc Intl Soc Mag Reson Med 25. 2017:1658.
5. Blockley NP, Griffeth VEM, Germuska MA, Bulte DP, Buxton RB. An analysis of the use of hyperoxia for measuring venous cerebral blood volume: Comparison of the existing method with a new analysis approach. Neuroimage. 2013;72:33-40.
6. Stone AJ, Holland NC, Berman AJL, Blockley NP. Simulations of the effect of diffusion on asymmetric spin echo based quantitative BOLD: An investigation of the origin of deoxygenated blood volume overestimation. Neuroimage. 2019;201(March):116035. doi:10.1016/j.neuroimage.2019.116035
7. Chiarelli PA, Bulte DP, Wise R, Gallichan D, Jezzard P. A calibration method for quantitative BOLD fMRI based on hyperoxia. Neuroimage. 2007;37(3):808-820.
8. Yablonskiy DA, Haacke EM. Theory of NMR signal behavior in magnetically inhomogeneous tissues: the static dephasing regime. Magn Reson Med. 1994;32(6):749-763.
Figures