3174
Longitudinal MRI Tracking of Transplanted Neural Progenitor Cells in the Spinal Cord Utilizing the Bright Ferritin Mechanism1Institute of Biomedical Engineering, University of Toronto, Toronto, ON, Canada, 2Translational Biology & Engineering Program, Ted Rogers Centre for Heart Research, Toronto, ON, Canada, 3Division of Genetics and Development, Krembil Research Institute, University Health Network, Toronto, ON, Canada, 4Department of Spine Surgery and Orthopaedics, Xiangya Hospital, Central South University, Changsha, China, 5Institute of Medical Sciences, University of Toronto, Toronto, ON, Canada, 6Department of Biology, University of Toronto Mississauga, Toronto, ON, Canada, 7Department of Cell and Systems Biology, University of Toronto, Toronto, ON, Canada, 8Department of Surgery and Spine Program, University of Toronto, Toronto, ON, Canada, 9The Edward S. Rogers Sr. Department of Electrical and Computer Engineering, University of Toronto, Toronto, ON, Canada
Synopsis
Keywords: Molecular Imaging, Cell Tracking & Reporter Genes
Motivation: A non-invasive imaging technology for monitoring cell survival and in-vivo migration after transplantation is critical to optimizing and translating stem cell-based therapies.
Goal(s): To extend our previously reported bright-ferritin cell tracking platform to monitoring stem cell therapy, we investigated tracking human neural progenitor cells transplanted in the rat spinal cord.
Approach: In-vitro assays of proliferation and differentiation, and imaging both in vitro on cell pellets and in vivo in rats were performed.
Results: Monitoring rats on MRI over seven weeks confirmed the ability to assess cell retention and distribution in the rat spinal cord.
Impact: Our bright-ferritin platform demonstrated no adverse effects on human neural progenitor cells. Stem cells injected in the rat spinal cord could be tracked longitudinally and on-demand via a bright T1-contrast on MRI.
Introduction
Human neural progenitor cells (hNPCs) are a promising candidate for the treatment of spinal cord injury. Studies to date have focused on improving their regenerative potential and therapeutic effect. Equally important is ensuring successful delivery and engraftment of hNPCs at the site of injury. Unfortunately, monitoring cell fate non-invasively in living subjects is non-trivial, particularly if cells need to be tracked long-term for cell survival, distribution, and differentiation. No current imaging solution for cell tracking is compatible with long-term monitoring in vivo. The objective of this study was to apply a novel bright-ferritin1 magnetic resonance imaging (MRI) mechanism to track hNPC transplants longitudinally and on-demand in the rat spinal cord.Methods
hNPCs were genetically modified to stably overexpress human ferritin using a CRISPR-Cas9 system1. The effect of ferritin-overexpression in hNPCs was evaluated based on cell viability, morphology, self-renewal, and tri-lineage differentiation capability. In vivo, 2 million cells were injected into the cervical spinal cord of female Rowett athymic nude (RNU) rats. Long-term cell tracking using bright-ferritin was investigated out to 7 weeks post-transplantation, with Mn supplementation administered on-demand to recall bright signal. MRI acquisitions employed a rat body coil and both T1-weighted sequences and T1 mapping on a 3 Tesla scanner (MR Solutions, Guildford, UK)2. MRI findings were corroborated against histological validation.Results
We generated a mutant hNPC cell line that stably overexpressed human ferritin using a nonviral CRISPR-Cas 9 system. A higher level of ferritin protein expression was found relative to wild-type cells (Figure 1). Normal cell growth rate and tr-lineage differentiation capability were maintained (Figure 2). Ferritin-overexpressing (FT) hNPCs labeled with 0.2 mM Mn provided significant T1-induced bright contrast on in-vitro MRI, with no adverse effect on cell viability, morphology, and proliferation (Figure 3). Long-term in-vivo cell tracking using bright-ferritin allowed on-demand signal recall upon Mn supplementation and precise visualization of the surviving hNPC graft out to 7 weeks post-transplantation when the study concluded (Figure 4). Spatial distribution of hNPCs on MRI matched that on histology (Figure 5). Furthermore, a linear relationship emerged between FT-hNPC cell number and T1 relaxation time (Figure 5).Discussion
Longitudinal and precise in-vivo cell tracking is imperative for advancing stem cell therapies into the clinic. In this study, we achieved a significant milestone and reported the first high resolution, specific, and on-demand longitudinal tracking of hNPCs grafts in the spinal cord. We attained this milestone by utilizing our previously reported bright-ferritin technology that boasts several key advantages1. First and foremost, it demonstrated an unparalleled capability to identify spinal cord hNPCs grafts with high sensitivity and specificity. Second, ferritin overexpression did not bring about discernible toxicity on hNPC proliferation and differentiation, in keeping with preserved therapeutic potential. Third and most importantly, it achieved the long-desired goal of tracking cells over the long-term and on-demand. These advantages underscore the potency and effectiveness of the bright-ferritin platform for in-vivo monitoring of spinal cord grafts, and its substantial promise for future applications in spinal cord injuries.Conclusion
Bright-ferritin provides the first demonstration of long-term, on-demand, and specific tracking of hNPCs in the rat spinal cord.Acknowledgements
No acknowledgement found.References
1. Szulc DA, Lee XA, Cheng HM, Cheng HM. Bright Ferritin-a Reporter Gene Platform for On-Demand, Longitudinal Cell Tracking on MRI. iScience. 2020;23(8):101350. doi: 10.1016/j.isci.2020.101350
2. Cheng HL, Wright GA. Rapid high-resolution T(1) mapping by variable flip angles: accurate and precise measurements in the presence of radiofrequency field inhomogeneity. Magn Reson Med 2006;55(3):566-74.
Figures
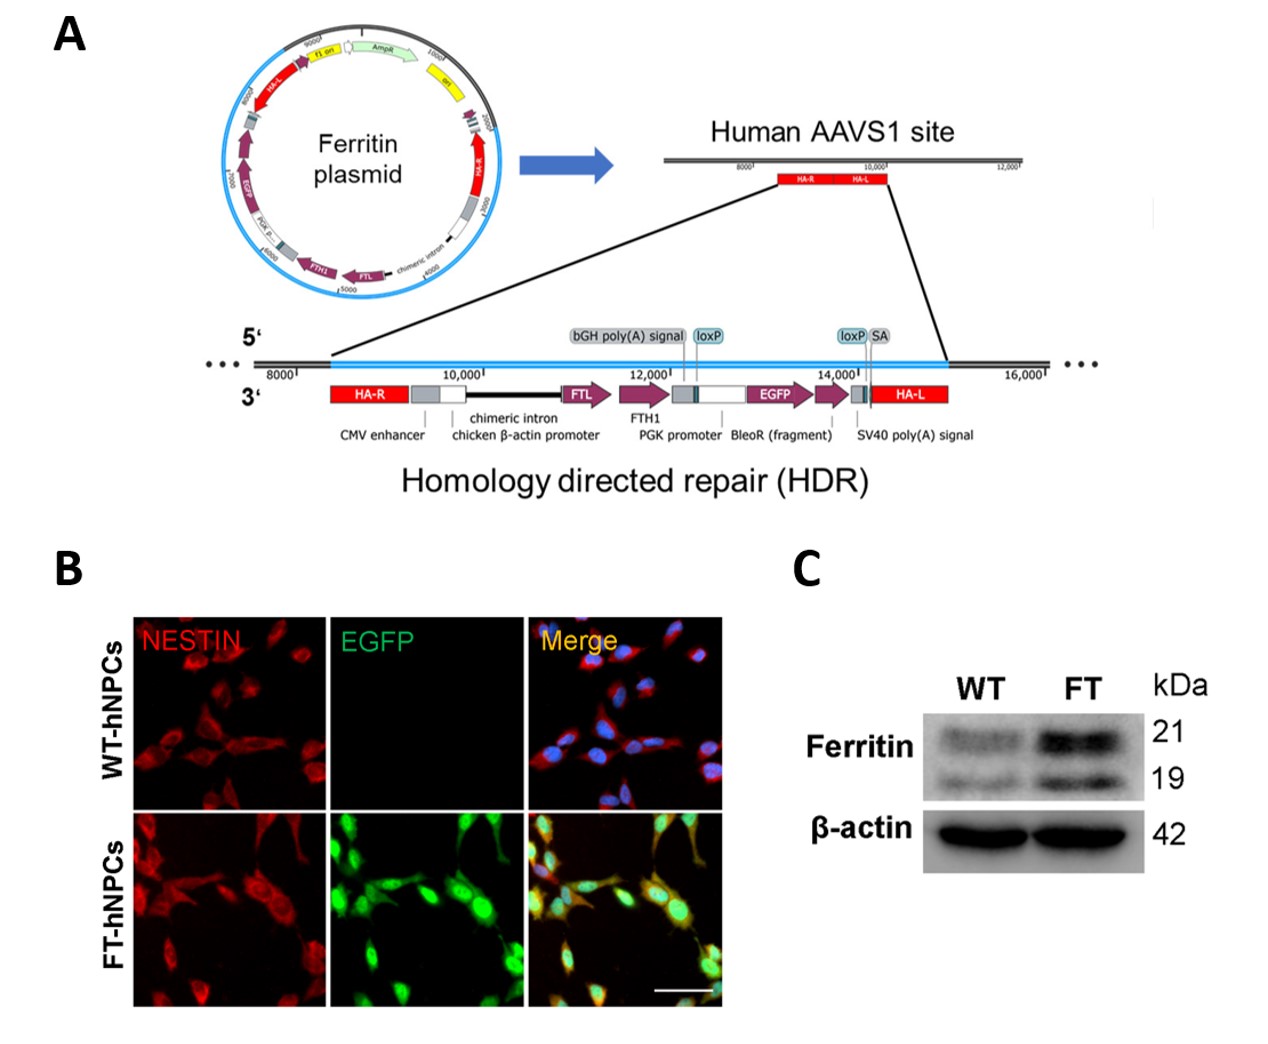
Figure 1. CRISPR/Cas9-mediated ferritin overexpression in hNPCs. (A) Schematic representation of CRISPR/Cas9-mediated ferritin gene integration into the human AAVS1 locus. (B) Representative immunofluorescent staining showing FT-hNPCs (Nestin+ and EGFP+) and WT-hNPCs (Nestin+). Scale bar, 50 μm. (C) Western blot analysis of ferritin protein levels in WT-hNPCs and FT-hNPCs.
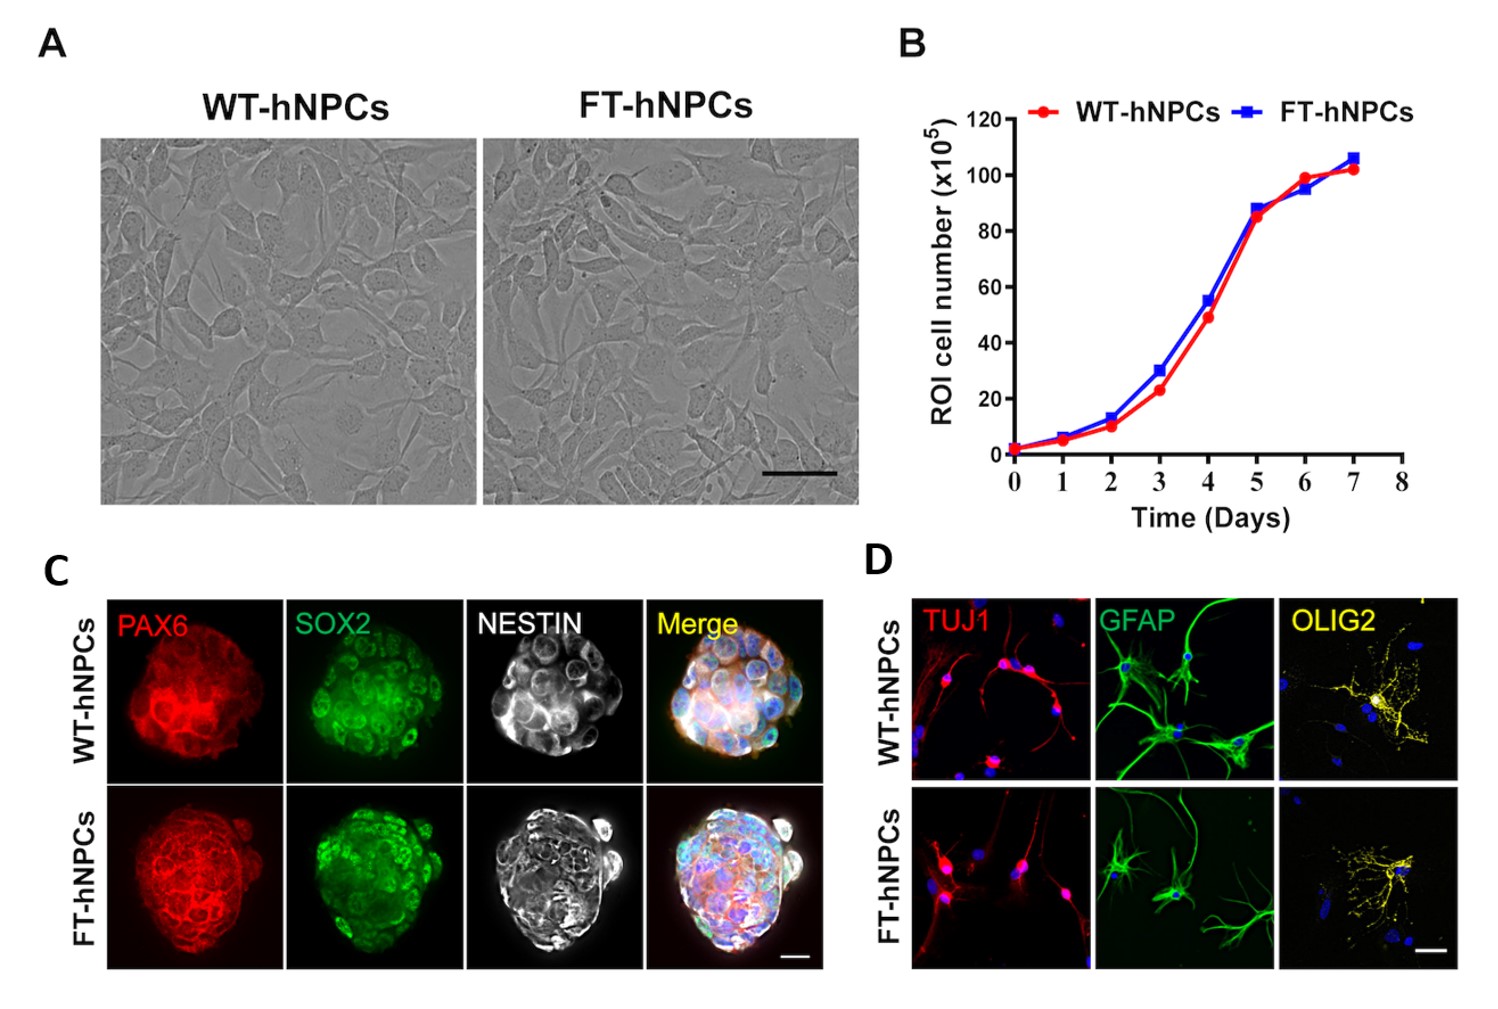
Figure 2. Ferritin overexpression does not affect the self-renewal and tri-lineage differentiation potential of hNPCs. (A) Representative optical microscopy images of WT-hNPCs and FT-hNPCs. Scale bar, 60μm. (B) Cell growth curve illustrating the growth patterns. (C) Representative immunofluorescent images depicting the expression of stem cell markers PAX6, SOX2, and NESTIN in the neurospheres. Scale bar, 20μm. (D) Representative immunofluorescent images depicting the tri-potency (TUJ1 for neurons, GFAP for astrocytes, and OLIG2 for oligodendrocytes). Scale bar, 10 μm.
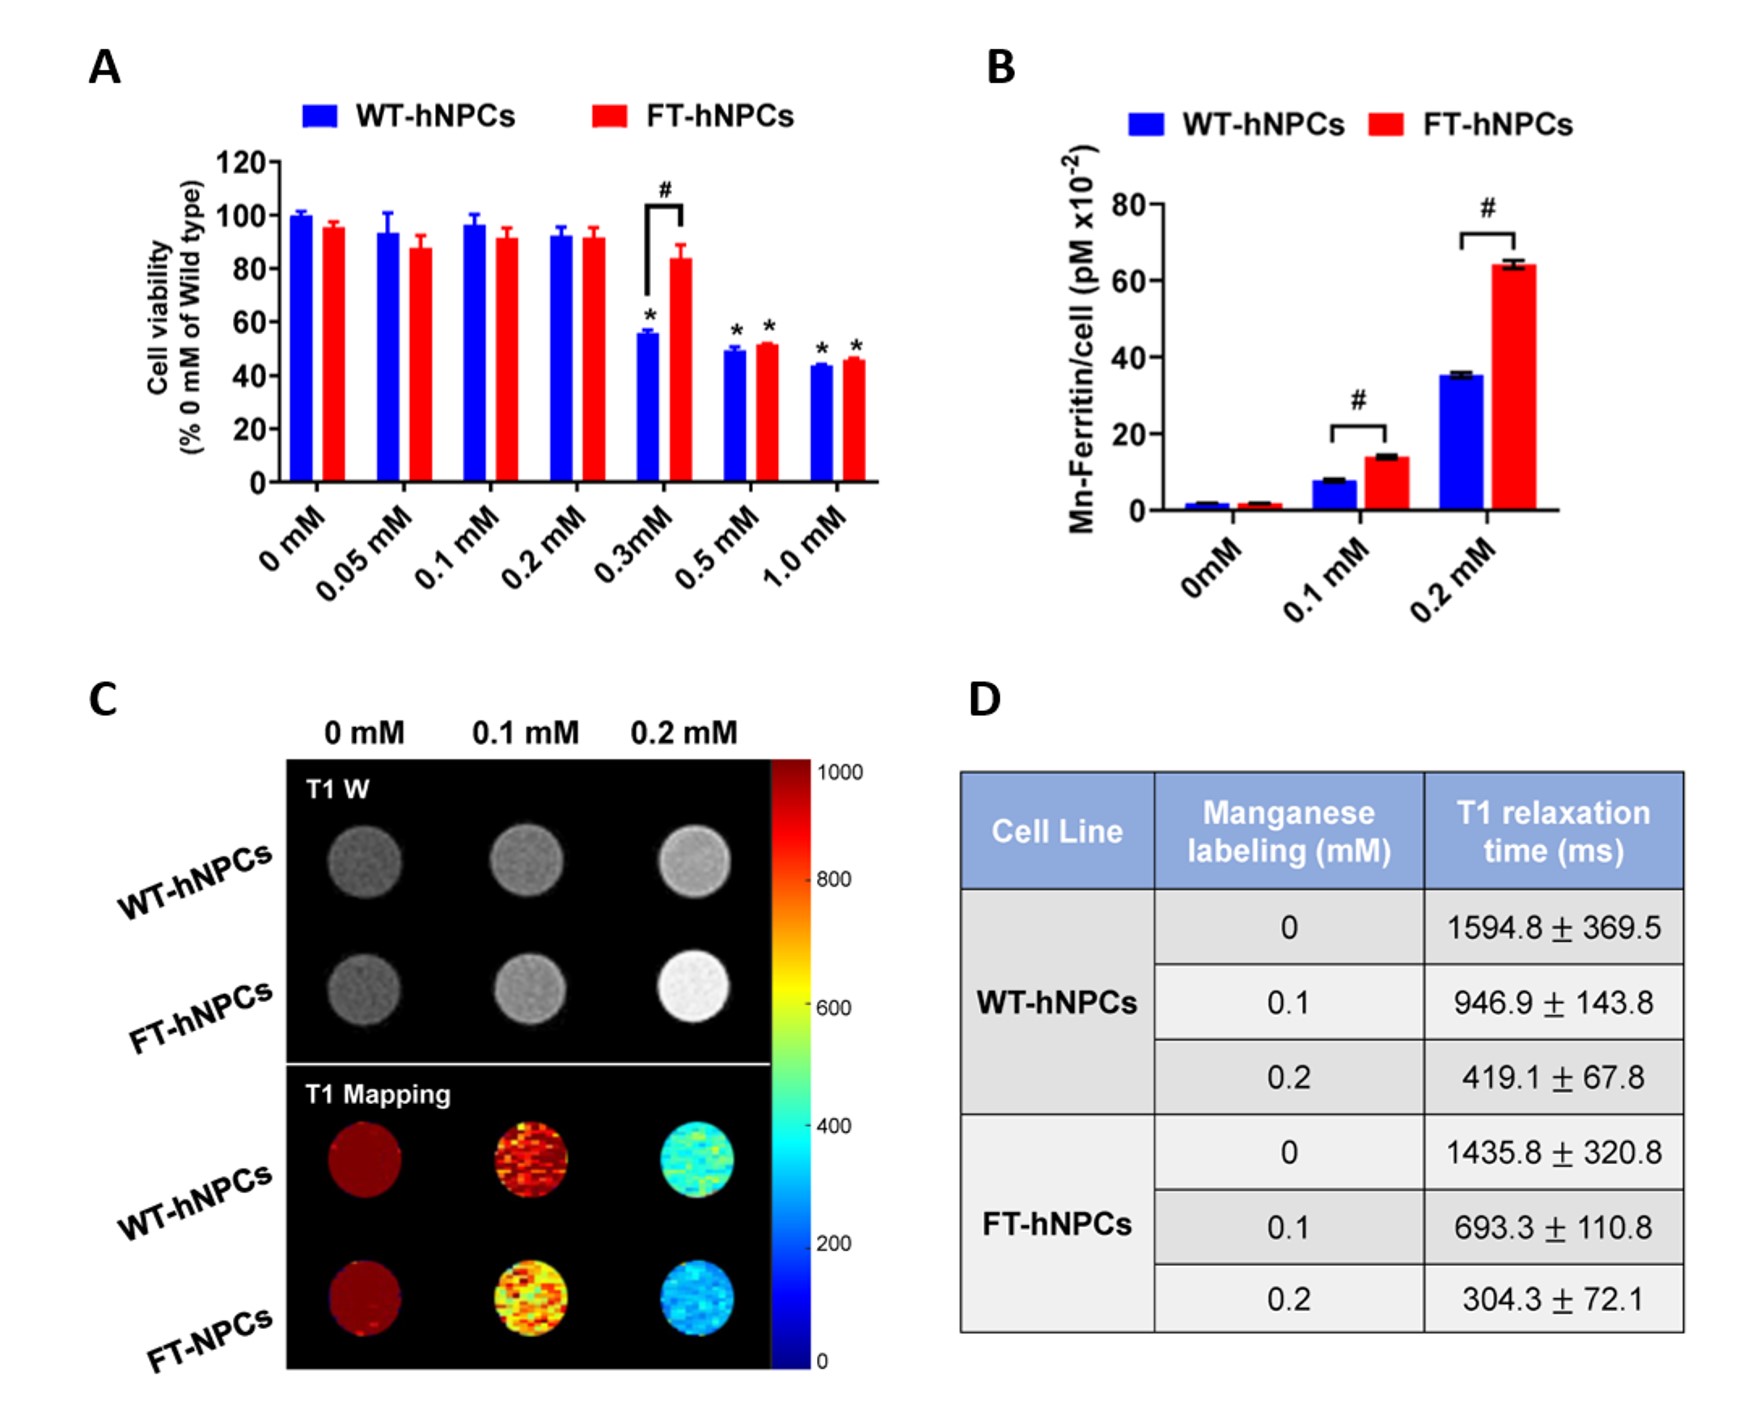
Figure 3. Manganese-ferritin complexes enhance contrast efficiency of T1-weighted MRI. (A) MTT assay results for WT-hNPCs and FT-hNPCs exposed to different concentrations of MnCl2. (B) Cellular manganese content measured in WT and FT-hNPCs, with 0 mM, 0.1 mM, and 0.2 mM MnCl2 supplementation for 24 hours. *p < 0.05 vs. 0 mM WT-hNPCs. #p<0.05 vs. WT-hNPCs. Data are represented as mean ± SEM (n=3). (C) T1-weighted fast spin echo and T1 mapping images of WT-hNPCs and FT-hNPCs incubated with 0 mM, 0.1 mM, and 0.2 mM MnCl2 for 24 hours. (D) Quantitative analysis of (C).
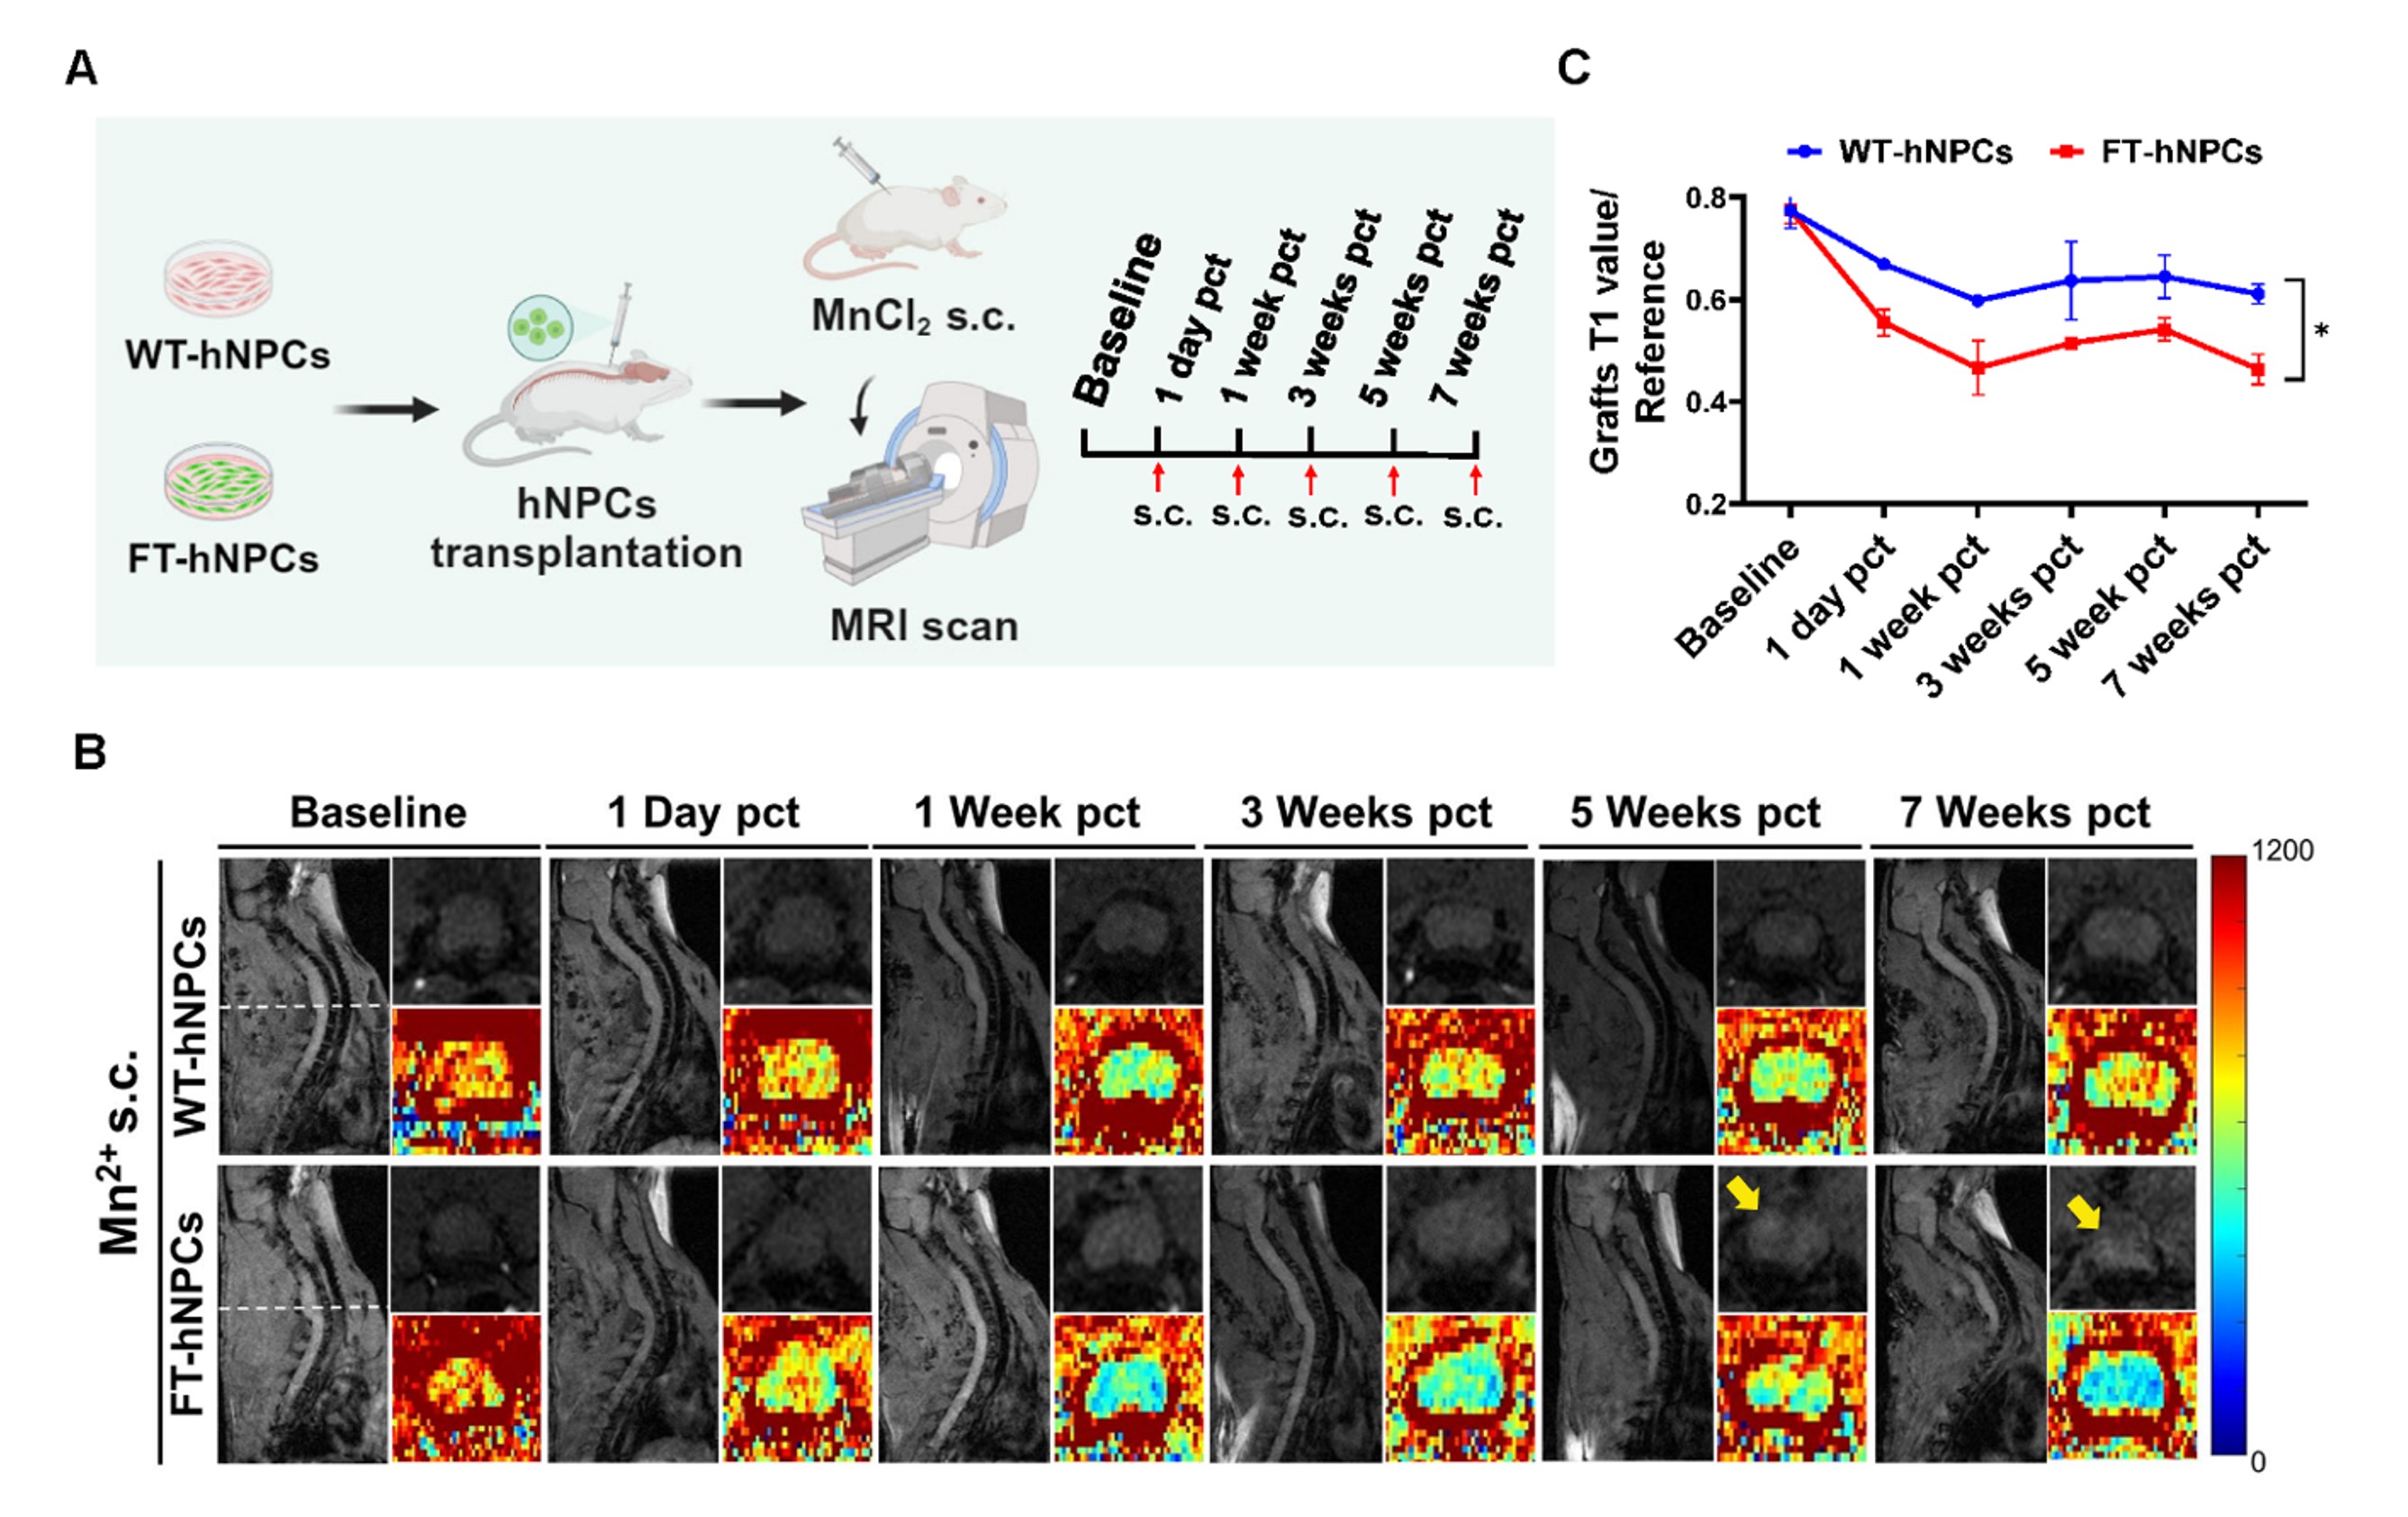
Figure 4. In-vivo long-term MRI tracking of hNPCs in the spinal cord using bright-ferritin. (A) Schematic depicting in-vivo MRI at baseline, 1 day, 1 week, 3 weeks, 5 weeks, and 7 weeks post-transplantation of WT-hNPCs and FT-hNPCs into the cervical spinal cord. MRI was performed 24 hours after subcutaneous MnCl2 administration. (B) Representative MRI of rats. Yellow arrowheads indicate bright contrast signal originating from transplanted FT-hNPCs. (C) Quantitative relaxometry of (B) corrected for background T1 values. Data are represented as mean ± SEM (n = 3). *p < 0.01.
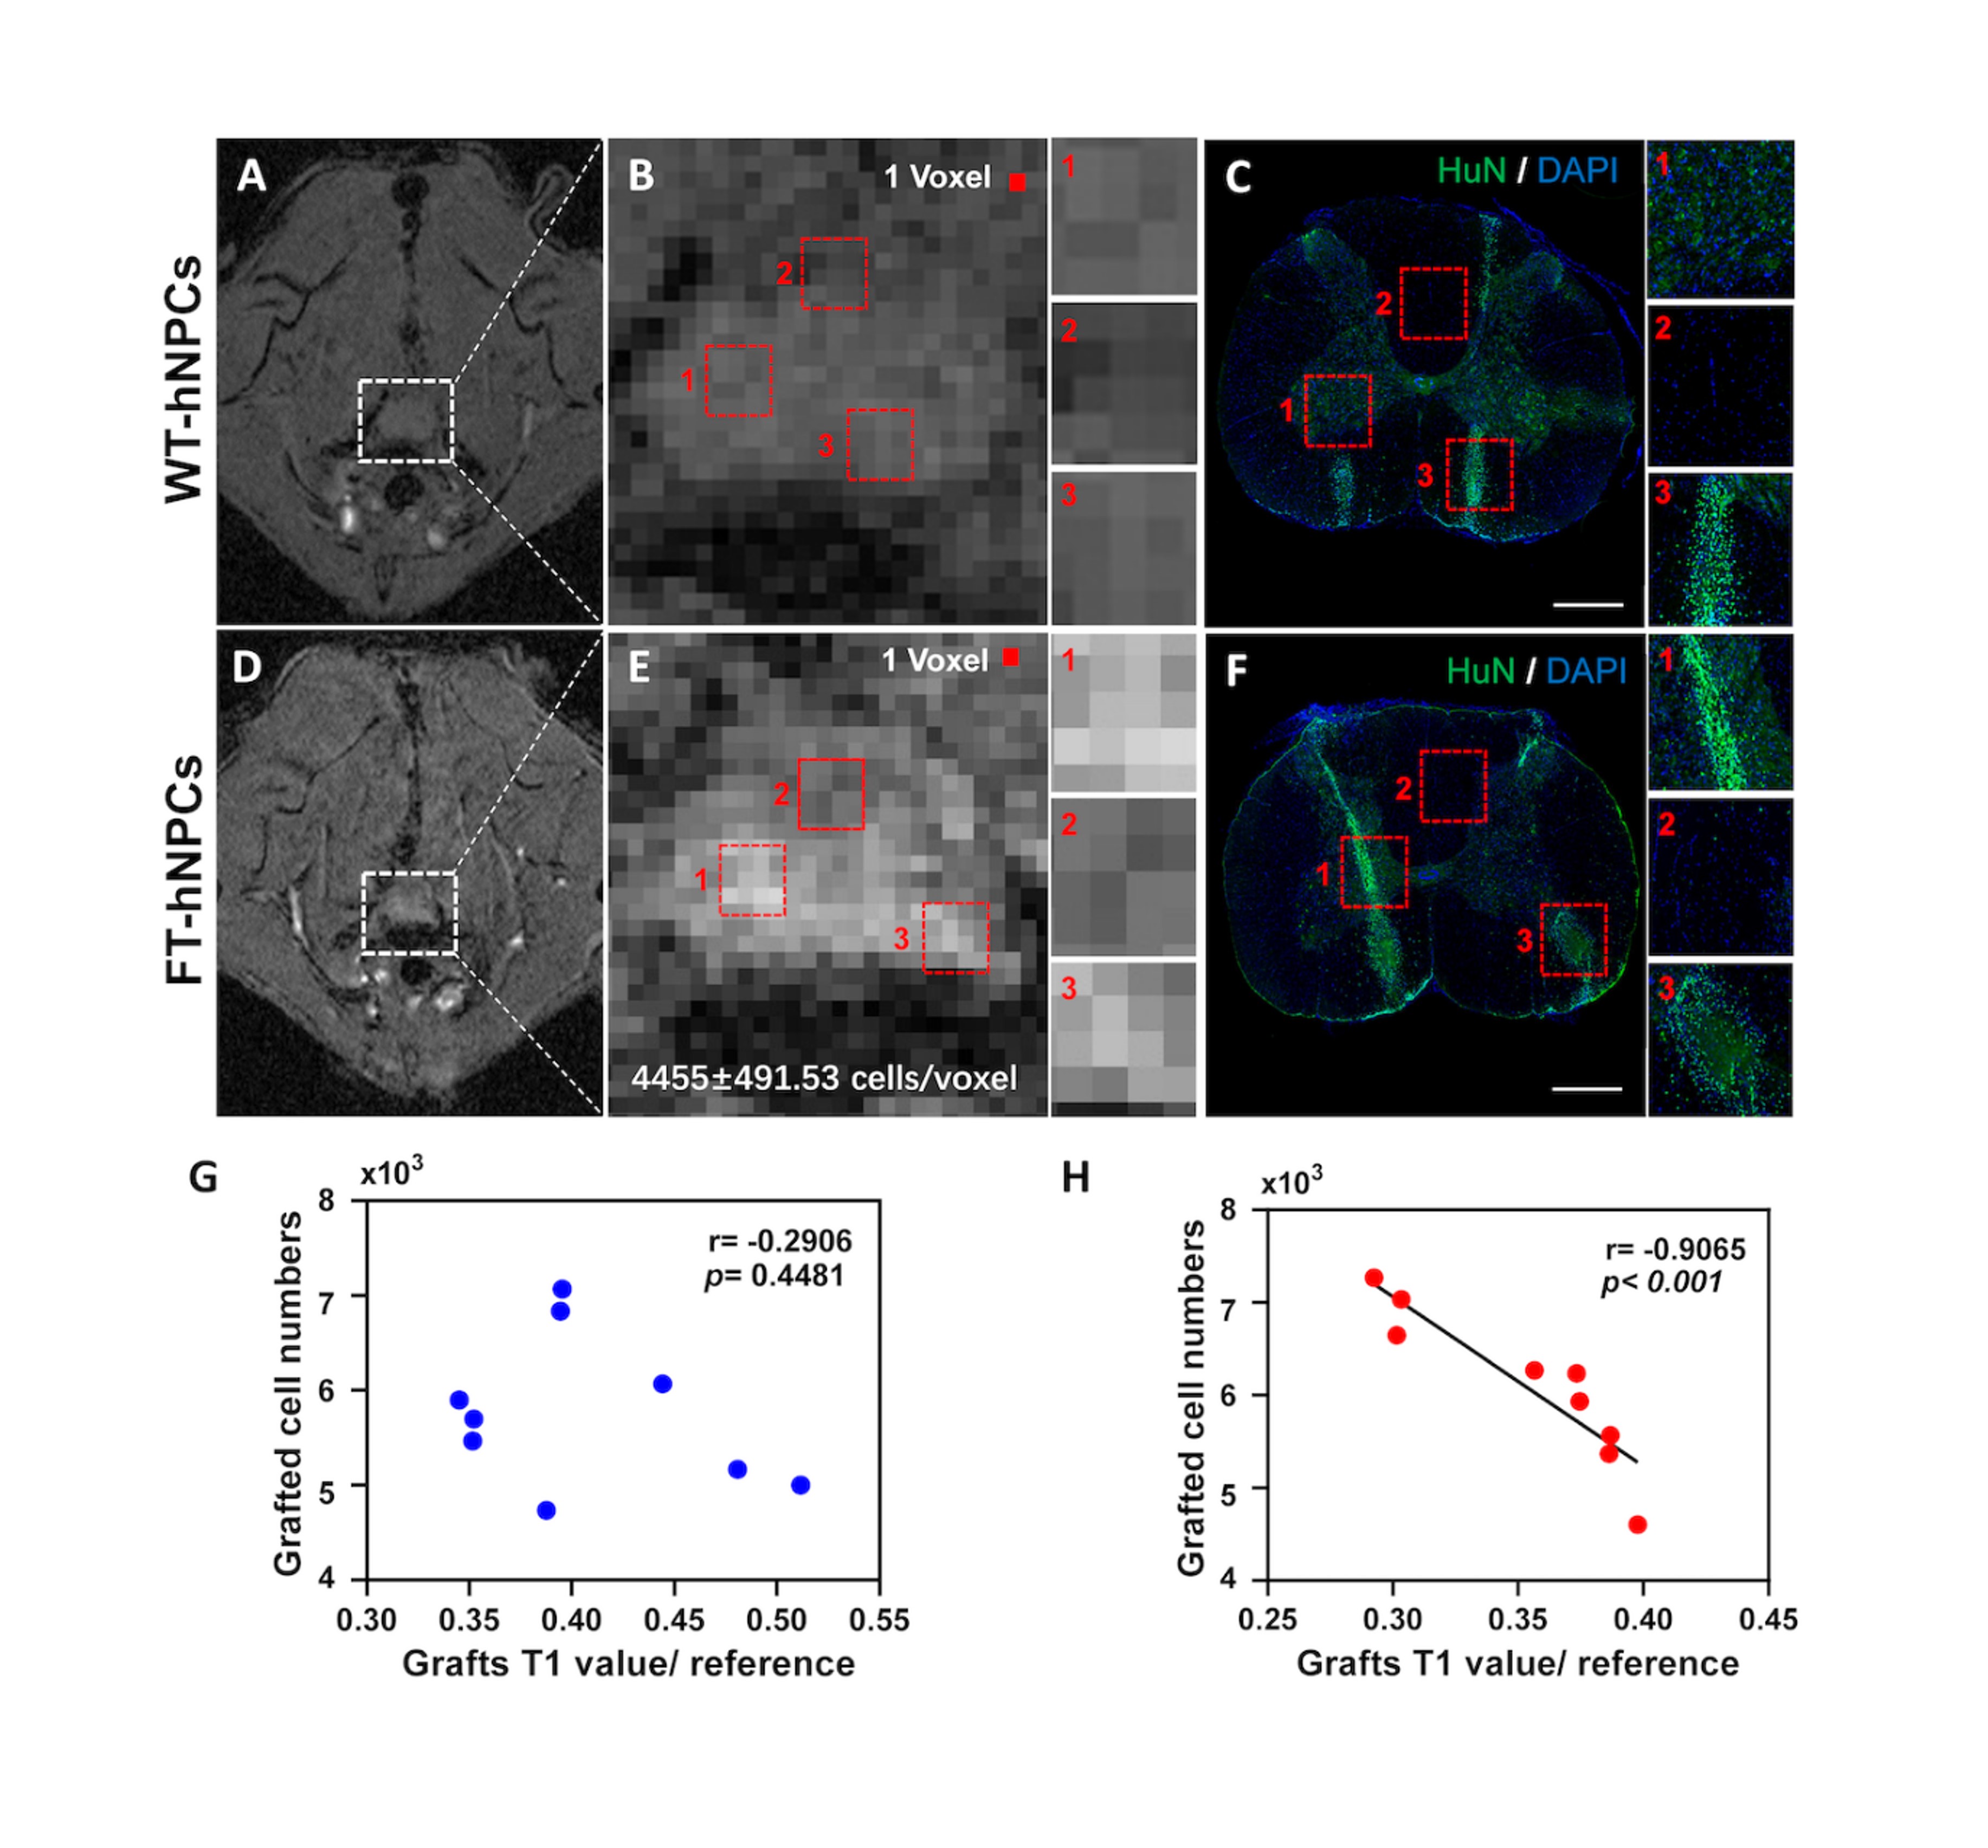
Figure 5. Histological validation of MRI signal in RNU rat spinal cord. Representative T1-weighted SPGR images of the spinal cord at 7 weeks post-transplantation with WT-hNPCs (A-B) or FT-hNPCs (D-E) transplants. Red dot represents individual pixel. (C, F) Immunofluorescence staining results of spinal cord sections at the same location, where HuN (human nuclei) was used to label the cell transplants. Scale bar, 400 μm. Correlation analysis between MRI signal and immunofluorescence intensity for WT-hNPCs (G) and FT-hNPCs (H).