3171
Vessel-specific quantification of cerebral venous oxygenation with velocity encoding preparation and rapid acquisition1Department of Biomedical Engineering, Zhejiang University, Hangzhou, China, 2Department of Radiology, Johns Hopkins University, Baltimore, MD, United States, 3MR Collaboration, Siemens Healthineers Ltd., Shanghai, China
Synopsis
Keywords: Oxygenation, Oxygenation
Motivation: Non-invasive measurement of cerebral venous oxygenation (Yv) is of critical importance in numerous brain diseases.
Goal(s): The present work proposed a fast method to quantify regional Yv map for both large and small veins, named T2-Relaxation-Under-Velocity-Encoding-and-Rapid Acquisition (TRU-VERA).
Approach: It isolates blood spins from static tissue with velocity-encoding preparation, modulates the T2 weighting of venous signal with T2-preparation and utilizes a bSSFP readout to achieve fast acquisition with high resolution.
Results: Venous T2 measured with TRU-VERA was highly correlated with T2 from TRUST and showed an excellent test-retest reproducibility with a CoV of 1.2% for large veins and 3.6% for small veins.
Impact: The proposed TRU-VERA sequence is a promising method to for non-contrast and fast assessment of vessel-specific oxygenation, thus regional cerebral oxygen metabolism, in a number of diseases.
INTRODUCTION
Extensive literature demonstrated the important role of cerebral oxygen extraction and metabolism in diseases1. One important line of oxygenation method is based on the T2 modulation effect of venous oxygenation (Yv)2-6. Quantification of Yv at whole-brain level can be achieved with T2-Relaxation-Under-Spin-Tagging (TRUST) MRI reliably2,7-9. However, regional assessment of Yv is important where oxygenation alterations are local and heterogenous, such as stroke10-12 and brain tumor13. Existing T2-based regional methods had the limitation of long scan duration or low SNR. The goal of present work is to develop a fast method for oxygenation quantification in both large and small cerebral veins, dubbed as T2-Relaxation-Under-Velocity-Encoding-and-Rapid Acquisition (TRU-VERA).METHODS
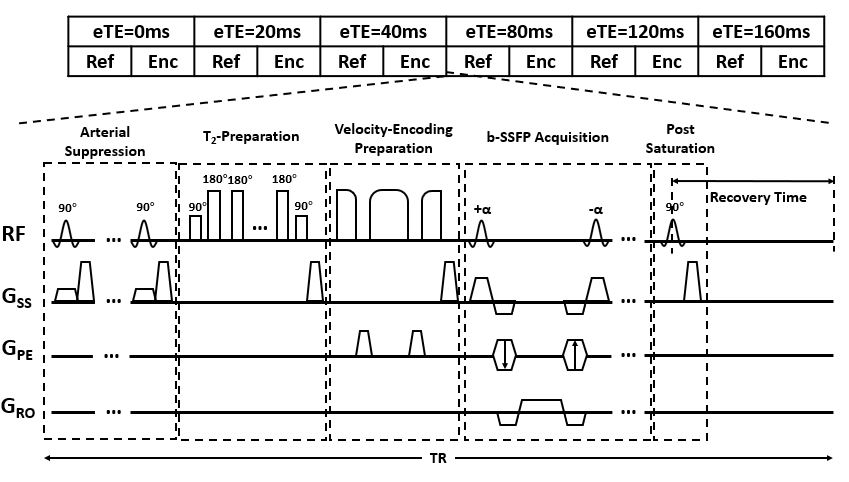
Pulse SequenceThe proposed sequence is illustrated in Figure 1, which measured venous blood T2 using a combination of T2-preparation, velocity encoding preparation and bSSFP readout. The subtraction between reference and velocity-encoded image allowed the isolation of flowing spin signal from static tissues, which was modulated by the T2-preparation with a range of effective echo time (eTE). Monoexponential fitting yielded blood T2 which can be converted to Yv using a calibration curve14. The main difference between TRU-VERA and other regional methods such as TRUPC15 or aTRUPC16 was the usage of a single-shot bSSFP readout which drastically reduced the scan time. Compared with aTRUPC, higher turbo factor can be used here for two reasons: first, transverse magnetization was refocused rather than spoiled in bSSFP; second, velocity encoding was implemented as a preparation module before readout, so a much shorter echo spacing can be achieved. Both contributed to a slower evolution of the signal to steady-state, thus a less dissipation of T2-preparation effect and smaller bias of T2 estimation.
Protocol optimization
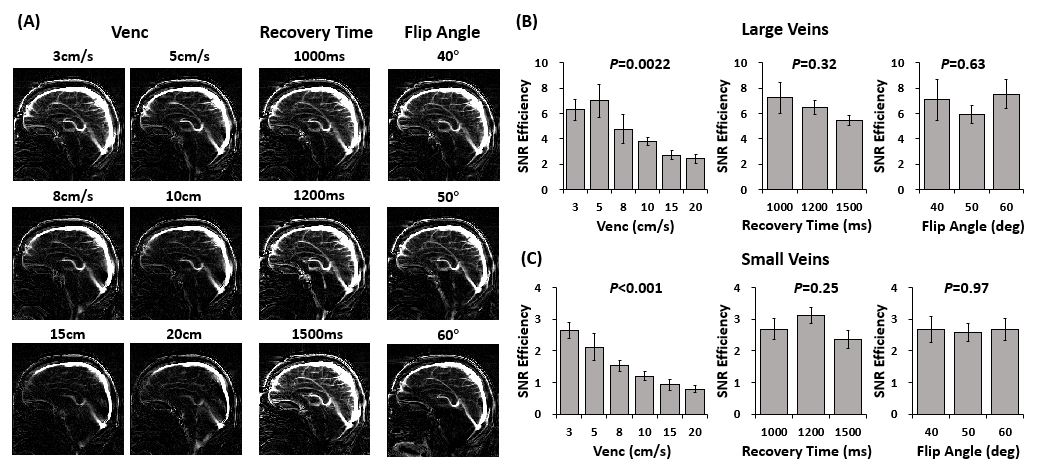
To obtain the highest sensitivity for both large and small veins, three parameters were first optimized, including Venc, recovery time (RT) and bSSFP flip angle (FA), on five healthy volunteers (24.8±2.2yrs, 3F/2M). Six Venc values (3, 5, 8, 10, 15 and 20cm/s), three RT values (1000, 1200 and 1500ms) and three FA (40°, 50° and 60°) were tested. ROIs were drawn manually for large veins, including superior sagittal sinus (SSS), straight sinus (SS), great vein of Galen (GV) and internal cerebral vein (ICV), and small mid-sagittal veins. SNR efficiency was calculated.
Validation and test-retest reproducibility
Afterwards, a full TRU-VERA scan was performed on ten healthy volunteers (24.5±3.6yrs, 5F/5M) with six eTEs (0, 20, 40, 80, 120, 160ms). Venous T2 at posterior SSS was compared with TRUST. A equation was established to convert TRU-VERA T2 to TRUST T2, before applying the calibration model14. Test-retest reproducibility was also examined. Finally, the effect of eTE choice on Yv quantification was investigated.
RESULTS
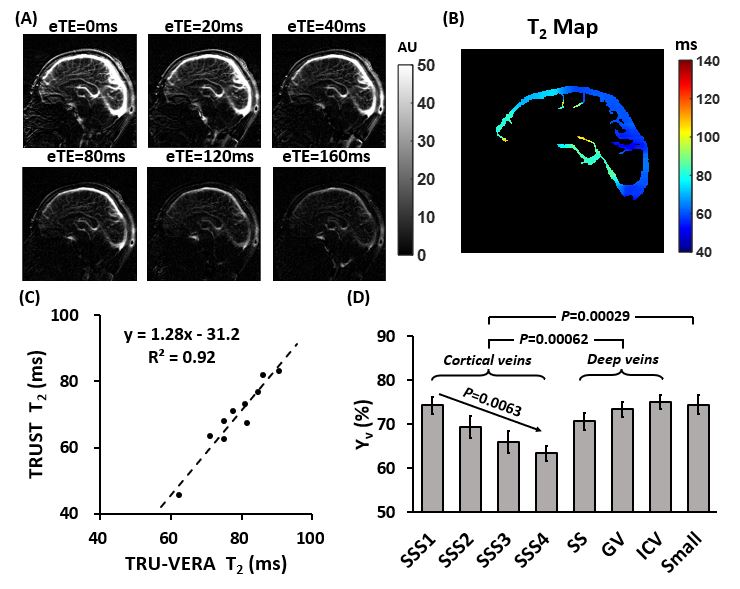
Figure 2 illustrated the TRU-VERA difference images and SNR efficiency for different protocols. Venc had a significant main effect for both large veins (P=0.0022) and small veins (P<0.001). Thus, a Venc=3cm/s was used subsequently. No effect of RT and FA was found, so in the final scans, we used a RT=1200ms and FA=60°.Representative images with different eTEs were shown in Figure 3A. Voxelwise fitting yielded vessel-specific T2 mapping (Figure 3B). TRU-VERA T2 of posterior SSS showed a strong correlation with TRUST (R2=0.92). Linear fitting resulted in the following conversion equation that can be used before T2-Yv calibration: T2,TRUST=1.28×T2,TRU-VERA-31.2.
ROI analysis revealed gradually decreased Yv from anterior to posterior SSS (P=0.0063) and higher Yv in vessels draining deep brain than cortical brain (P=0.00062). Mid-sagittal small veins showed a higher Yv than cortical veins (P=0.00029) but not deep veins (P=0.31).
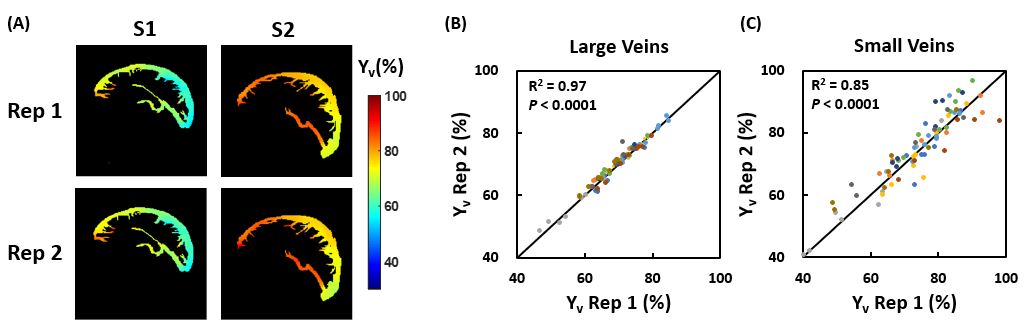
Test-retest reproducibility of Yv maps was shown in Figure 4. There was an excellent correlation between two runs for both large veins (R2=0.97) and small veins (R2=0.85). The intrasession CoV was 1.19±0.47% and 3.59±1.10% for large and small veins.
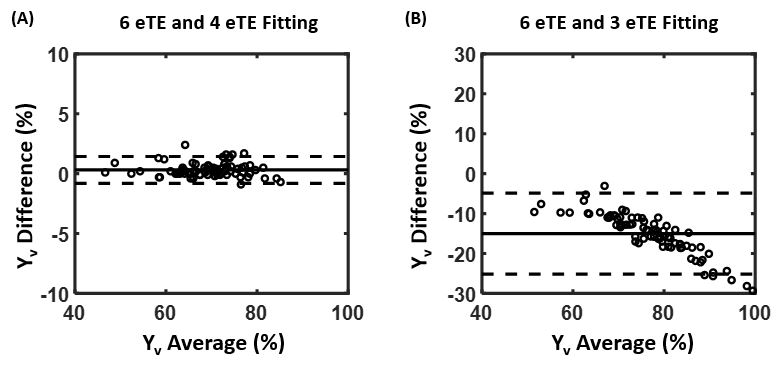
No difference was found in Yv between 6 eTE fitting and 4 eTE (0,40,80,160ms) fitting. However, 3 eTE (0,40,80ms) fitting showed an overestimation of Yv (Figure 5).
DISCUSSION AND CONCLUSION
The main advantage of TRU-VERA is the utilization of single-shot bSSFP readout, which was recently exploited for Yv measurement17, 18. It can achieve high in-plane resolution with short scan time, with high blood SNR due to T2/T1 contrast.Furthermore, compared with phase-contrast which requires separate choice of Venc for different velocities19, only one small Venc is needed here due to large intravoxel velocity variation and thus adequate dephasing20, allowing further shortening of scan time.
Practically, we observed that 3 eTE fitting tends to overestimate T2, especially when the blood oxygenation is high. Thus, cautions need to be made when comparing blood T2 from different fitting schemes.
Acknowledgements
No acknowledgement found.References
1. Jiang D and Lu H. Cerebral oxygen extraction fraction MRI: Techniques and applications. Magnetic Resonance in Medicine 2022; 88: 575-600. DOI: https://doi.org/10.1002/mrm.29272.
2. Lu H and Ge Y. Quantitative evaluation of oxygenation in venous vessels using T2-Relaxation-Under-Spin-Tagging MRI. Magn Reson Med 2008; 60: 357-363. 2008/07/31. DOI: 10.1002/mrm.21627.
3. Bolar DS, Rosen BR, Sorensen AG, et al. QUantitative Imaging of eXtraction of oxygen and TIssue consumption (QUIXOTIC) using venular-targeted velocity-selective spin labeling. Magnetic Resonance in Medicine 2011; 66: 1550-1562. DOI: https://doi.org/10.1002/mrm.22946.
4. De Vis JB, Petersen ET, Alderliesten T, et al. Non-invasive MRI measurements of venous oxygenation, oxygen extraction fraction and oxygen consumption in neonates. NeuroImage 2014; 95: 185-192. DOI: https://doi.org/10.1016/j.neuroimage.2014.03.060.
5. Guo J and Wong EC. Venous oxygenation mapping using velocity-selective excitation and arterial nulling. Magn Reson Med 2012; 68: 1458-1471. 2012/02/02. DOI: 10.1002/mrm.24145.
6. Qin Q, Grgac K and van Zijl PC. Determination of whole-brain oxygen extraction fractions by fast measurement of blood T(2) in the jugular vein. Magn Reson Med 2011; 65: 471-479. 2011/01/26. DOI: 10.1002/mrm.22556.
7. Eldirdiri A, Zhuo J, Lin Z, et al. Toward vendor-independent measurement of cerebral venous oxygenation: Comparison of TRUST MRI across three major MRI manufacturers and association with end-tidal CO2. NMR in Biomedicine 2023; n/a: e4990. DOI: https://doi.org/10.1002/nbm.4990.
8. Jiang D, Deng S, Franklin CG, et al. Validation of T2-based oxygen extraction fraction measurement with 15O positron emission tomography. Magnetic Resonance in Medicine 2021; 85: 290-297. DOI: https://doi.org/10.1002/mrm.28410.
9. Jiang D, Liu P, Li Y, et al. Cross-vendor harmonization of T2-relaxation-under-spin-tagging (TRUST) MRI for the assessment of cerebral venous oxygenation. Magnetic Resonance in Medicine 2018; 80: 1125-1131. DOI: https://doi.org/10.1002/mrm.27080.
10. An H, Ford AL, Chen Y, et al. Defining the Ischemic Penumbra Using Magnetic Resonance Oxygen Metabolic Index. Stroke 2015; 46: 982-988. DOI: 10.1161/STROKEAHA.114.008154.
11. Fan AP, Khalil AA, Fiebach JB, et al. Elevated brain oxygen extraction fraction measured by MRI susceptibility relates to perfusion status in acute ischemic stroke. J Cereb Blood Flow Metab 2020; 40: 539-551. 2019/02/09. DOI: 10.1177/0271678x19827944.
12. Stone AJ, Harston GWJ, Carone D, et al. Prospects for investigating brain oxygenation in acute stroke: Experience with a non-contrast quantitative BOLD based approach. Hum Brain Mapp 2019; 40: 2853-2866. 2019/03/13. DOI: 10.1002/hbm.24564.
13. Stadlbauer A, Zimmermann M, Kitzwögerer M, et al. MR Imaging–derived Oxygen Metabolism and Neovascularization Characterization for Grading and IDH Gene Mutation Detection of Gliomas. Radiology 2017; 283: 799-809. DOI: 10.1148/radiol.2016161422.
14. Lu H, Xu F, Grgac K, et al. Calibration and validation of TRUST MRI for the estimation of cerebral blood oxygenation. Magn Reson Med 2012; 67: 42-49. 2011/05/19. DOI: 10.1002/mrm.22970.
15. Krishnamurthy LC, Liu P, Ge Y, et al. Vessel-specific quantification of blood oxygenation with T2-relaxation-under-phase-contrast MRI. Magn Reson Med 2014; 71: 978-989. 2013/04/10. DOI: 10.1002/mrm.24750.
16. Jiang D, Lu H, Parkinson C, et al. Vessel-specific quantification of neonatal cerebral venous oxygenation. Magn Reson Med 2019; 82: 1129-1139. 2019/05/09. DOI: 10.1002/mrm.27788.
17. Langham MC, Rodríguez-Soto AE, Schwartz N, et al. In vivo whole-blood T(2) versus HbO(2) calibration by modulating blood oxygenation level in the femoral vein through intermittent cuff occlusion. Magn Reson Med 2018; 79: 2290-2296. 2017/09/05. DOI: 10.1002/mrm.26885.
18. Rodríguez-Soto AE, Abdulmalik O, Langham MC, et al. T(2) -prepared balanced steady-state free precession (bSSFP) for quantifying whole-blood oxygen saturation at 1.5T. Magn Reson Med 2018; 79: 1893-1900. 2017/07/19. DOI: 10.1002/mrm.26835.
19. Krishnamurthy LC, Mao D, King KS, et al. Correction and optimization of a T2-based approach to map blood oxygenation in small cerebral veins. Magn Reson Med 2016; 75: 1100-1109. 2015/04/08. DOI: 10.1002/mrm.25686.
20. Fan Z, Sheehan J, Bi X, et al. 3D noncontrast MR angiography of the distal lower extremities using flow-sensitive dephasing (FSD)-prepared balanced SSFP. Magn Reson Med 2009; 62: 1523-1532. 2009/10/31. DOI: 10.1002/mrm.22142.
Figures