3168
Per voxel hemodynamic response estimation by sinusoid tracking1Stanford University, Stanford, CA, United States
Synopsis
Keywords: fMRI Analysis, fMRI (task based), hemodynamic response function, activation
Motivation: Sinusoid tracking has several important advantages over DFT to detect hemodynamic response (HRF). We propose only per voxel HRF estimation to detect activation. GLM globally assumes identical HRF over all voxels to detect activation. While the general contour of HRF is widely accepted, little is known about its variability in different brain regions.
Goal(s): Determine activation and HRF across whole brain simultaneously.
Approach: A periodic impulsive stimulus generates BOLD response. Sinusoid tracking returns seven-harmonic parameters required from BOLD signal.
Results: HRF is reconstructed from these harmonics, and ratios of harmonic amplitudes define activation.
Impact: A custom sinusoid tracking method, which (unlike windowed DFT) imposes no restriction on sample rate, stimulus task frequency, and record length, can detect hemodynamic response function and fMRI activation simultaneously per voxel across the whole brain.
Introduction
Functional MRI (fMRI) activation is commonly determined by the general linear model (GLM) with predefined hemodynamic response function (HRF). Although there already exists evidence that HRF varies across brain, age groups, and states of health1-2, HRF is conventionally modeled simply based on a canonical gamma function3, and presumed invariant across brain.The most straightforward way to measure HRF is by application of impulsive stimuli; e.g, 1s visual or motor stimulus, followed by 29s rest, then repeat. HRF is then determined by time-locked averaging of BOLD signal synchronized to onset of each stimulus cycle.
In this work, we apply a custom sinusoid tracking method to detect HRF induced by periodic impulsive stimuli. HRF is modelled by seven lowest-frequency harmonics of BOLD signal’s Fourier series. Power ratio of the first three harmonics, to those remaining, resemble GLM results. Sinusoid tracking imposes no restriction on sample rate and stimulus task frequency, which can be arbitrary. In contrast, a DFT method would optimally set sample rate at an exact multiple of stimulus task frequency so that task frequency coincides precisely with a frequency bin; otherwise, task energy is spread over multiple bins and windowing considerations would come into play.
Methods
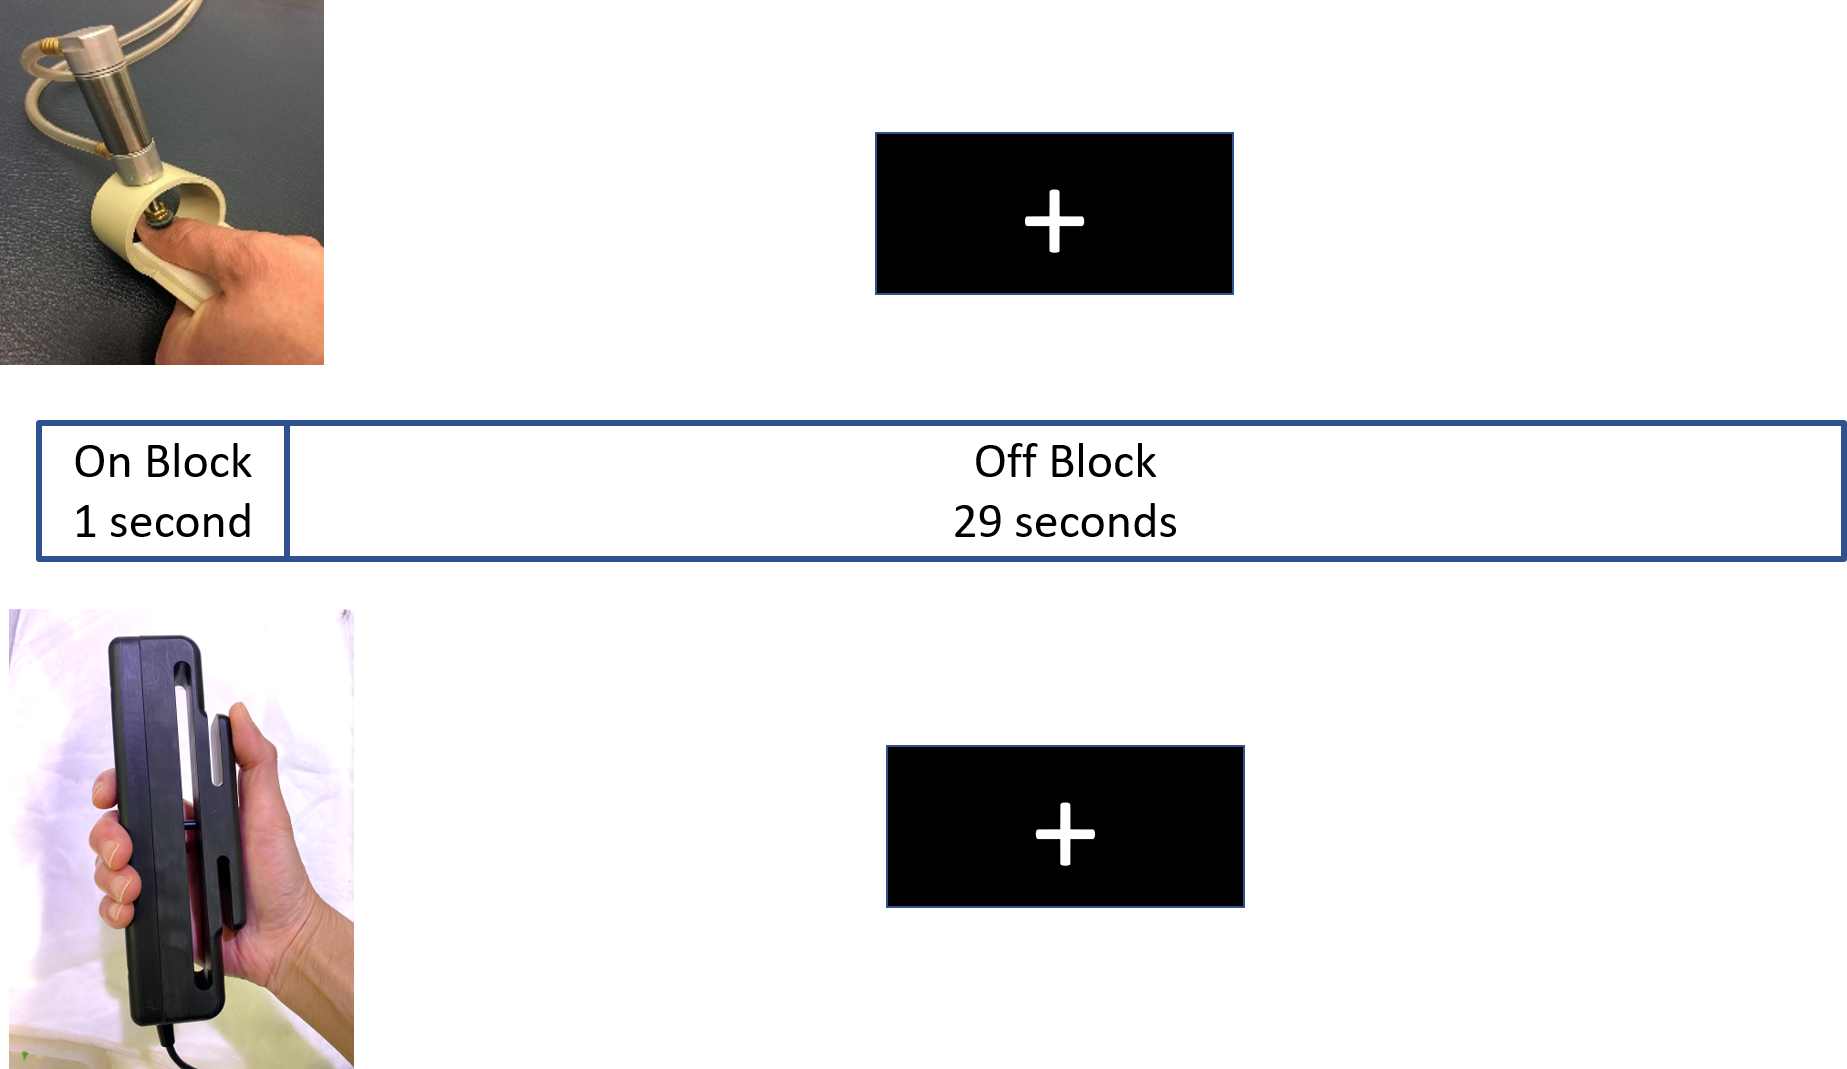
Two periodic impulsive stimuli were used to measure HRF on a healthy subject with a GE 3T scanner (Discovery 750). fMRI sequence parameters: EPI GRAPPA (R=2), FOV=22cm, matrix size=64x64, TE/TR=30ms/316.8ms, #slices=5(angled to cover sensory, motor, and visual cortices), #volumes=2022, slice thickness/spacing=5/0mm. Data from two scans with different periodic impulsive stimuli were collected: (1) Pressure Scan: During 1s on-blocks, subject saw a flashing checker board and experienced 6kg/cm2 pressure applied to left thumb via a custom pneumatically driven device. (2) Grip Scan: During 1s on-blocks, subject’s right hand gripped a dynamometer device with visual feedback to reach a predetermined force level. In both scans, the subject did not perform any task during 29s off-blocks, focusing only on a fixation cross (Fig.1).A sinusoid tracking algorithm was applied to data linearly detrended (DC removed) and temporally smoothed by sliding window width=20 samples. Sinusoid tracking returned harmonic amplitude, frequency, and phase for each voxel timeseries. Seven harmonics of each voxel timeseries (empirically found adequate) were then summed to represent HRF per voxel. Harmonic power-ratio was defined as total power of first, second, and third harmonics to total power of fourth through seventh harmonics. This power-ratio provides insight into signal-to-noise of timeseries, incidentally, because high ratio indicates strong presence of HRF. Harmonic-power-ratio of each voxel was displayed as an image.
GLM analysis was performed using FSL FEAT with temporal high pass filter cutoff=100s, slice timing correction, 5mm spatial smoothing, and prewhitening. An idealized boxcar signal, identifying stimuli onset and duration, is convolved with a double-gamma idealized HRF then input to GLM. Activation is determined by Z-score threshold at cluster p=0.05 and Z>3.1.
Results
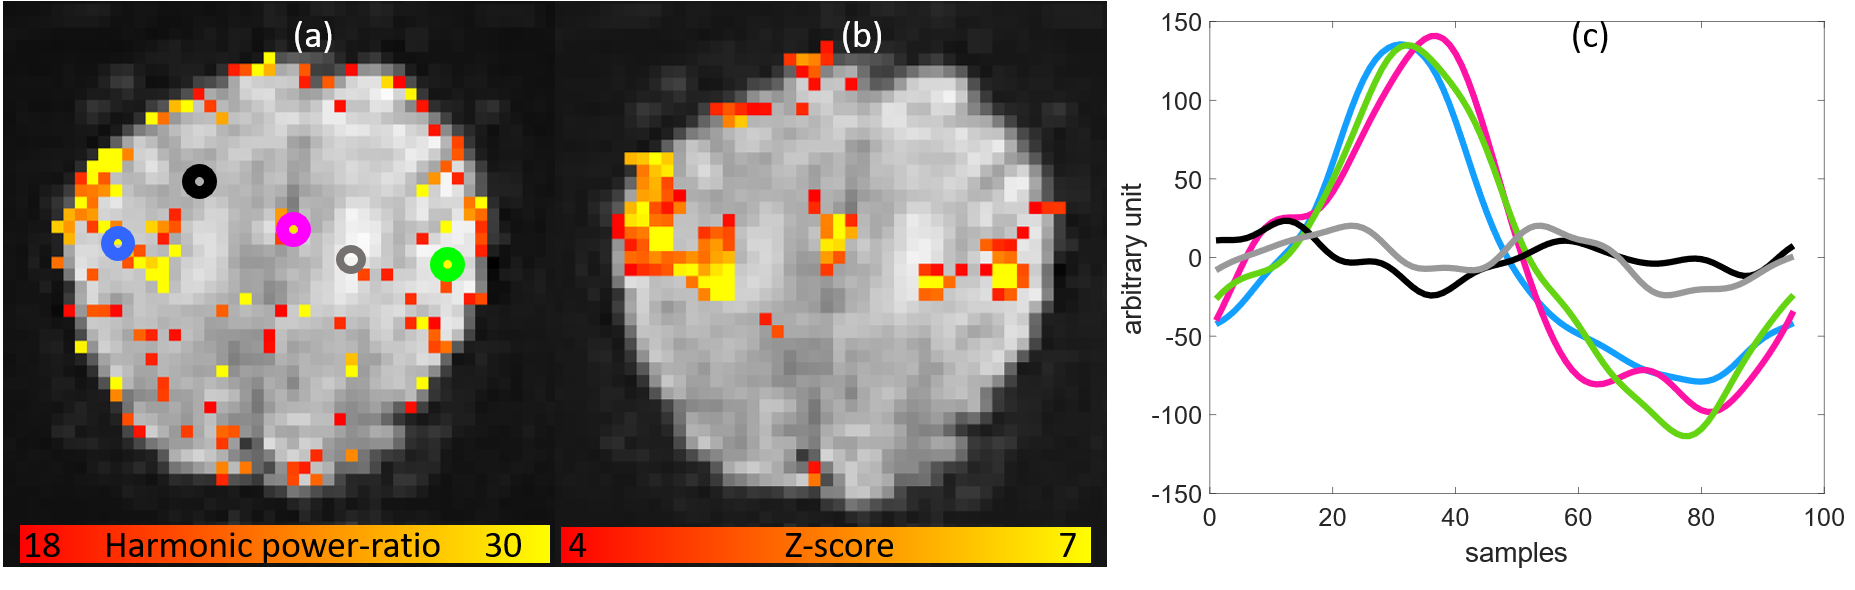
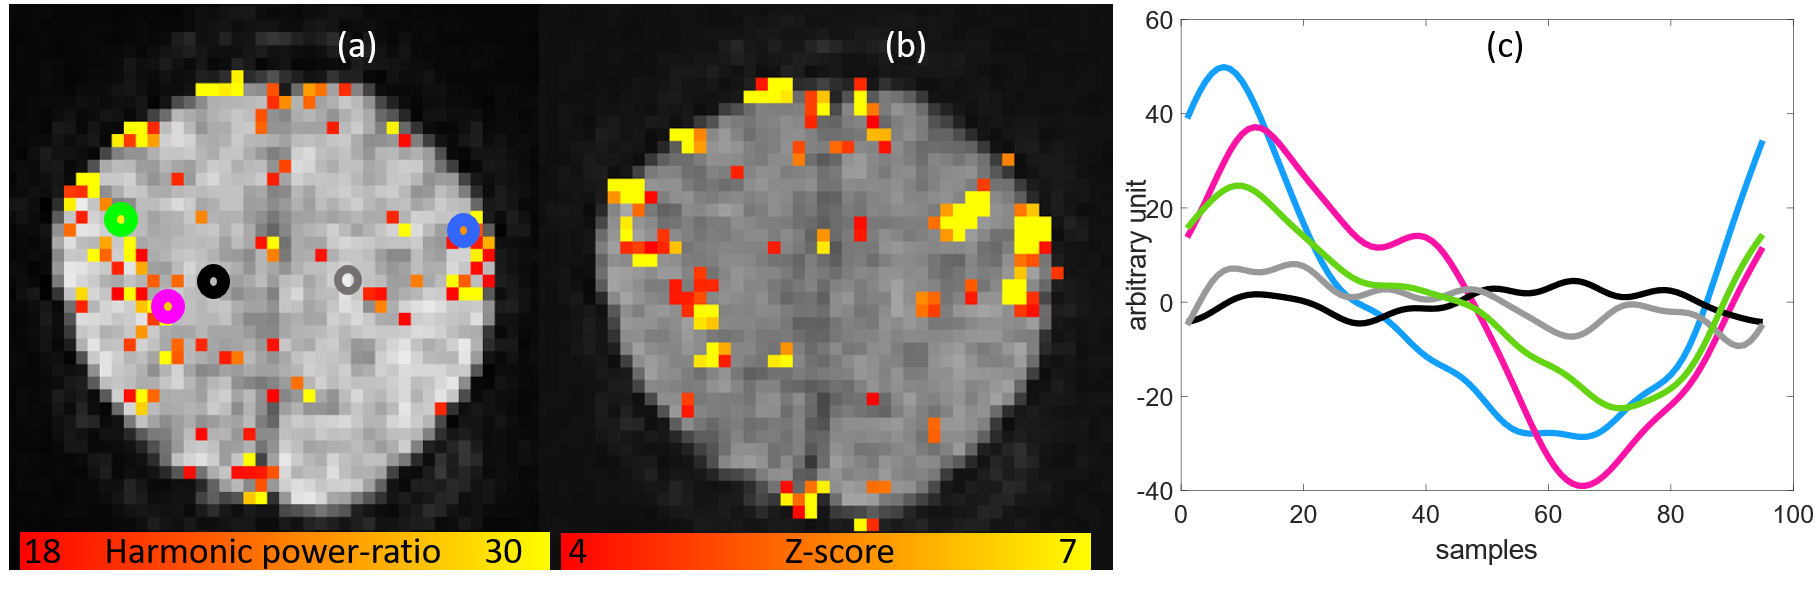
Harmonic-power-ratio map from the Pressure Scan is shown in Fig.2a while activation calculated from the GLM is shown in Fig.2b. Figure2c shows HRFs estimated at circled voxels in Fig.2a. HRFs shown in color represent voxels that have both high harmonic power-ratio and Z-score, whereas black and gray lines represent those that have not. Figure3 shows results from the Grip Scan.Discussion
We consider voxels to be representative of HRF only if they have both high harmonic power-ratio and Z-score. Harmonic power-ratio maps resemble activation maps generated by GLM analysis. HRFs, estimated by sinusoid tracking from voxels in task-related brain regions, have expected characteristics; i.e, sudden initial peak rise followed by slow decay. Estimation from voxels, having low harmonic power-ratio and Z-score, lack HRF characteristics.Harmonic power-ratio maps and HRF estimations indicate that our sinusoid tracking method indeed provided useful insight into stimulus tasks: Three HRFs estimated from the Pressure Scan (Fig.2c) closely resemble each other despite physical distance separating the corresponding voxels (Fig.2a), whereas the three HRFs estimated from the Grip Scan divert from each other. One possible explanation is that voxels chosen from the Grip Scan actually have different HRF curves. Another possibility is that the Pressure Scan was a passive task, whereas the subject had to actively squeeze the hand dynamometer during the Grip Scan, which is a more complex motion and movement plan.
Conclusion
HRFs from task-related brain areas show distinct rise and fall characteristics absent from HRFs in non-task-related areas. Three resembling HRFs in Fig.2c mean left and right somatosensory and supplementary motor regions all respond to pressure applied to left thumb near simultaneously. Overall, sinusoid tracking shows promise as a new tool to decode HRF of the whole brain.Acknowledgements
R01 NS109450References
1. Handwerker DA, Ollinger JM, D’Esposito M (2004) Variation of BOLD hemodynamic responses across subjects and brain regions and their effects on statistical analyses.Neuroimage21:1639–1651.
2. Aguirre GK, Zarahn E, D’esposito M (1998) The variability of human, BOLD hemodynamic responses.Neuroimage8:360–369.
3. Glover GH, Deconvolution of Impulse Response in Event-Related BOLD fMRI, NeuroImage, Volume 9, Issue 4, 1999, Pages 416-429.
Figures