3164
Dynamics of brain neurotransmitters levels in response to a short visual stimulus measured using functional MRS at 3T1CRIEPST, Moscow, Russian Federation, 2IBCP RAS, Moscow, Russian Federation, 3FRC CP RAS, Moscow, Russian Federation
Synopsis
Keywords: Biology, Models, Methods, Spectroscopy, Glutamate, GABA, MRS
Motivation: Current assumptions propose that rapid fluctuations in Glu levels are associated with its release from vesicles in response to an event-related stimulus. Therefore, there should be rapid changes in GABA and Glu in response to a short stimulus that will show local stimulus-induced inhibition and excitation.
Goal(s): To quantify GABA and Glu levels following a brief visual stimulus lasting three seconds.
Approach: Single voxel 1H-MRS was used to measure GABA (MEGA-PRESS) and Glx (PRESS) levels. Flickering checkerboard (3s) was used for stimulation.
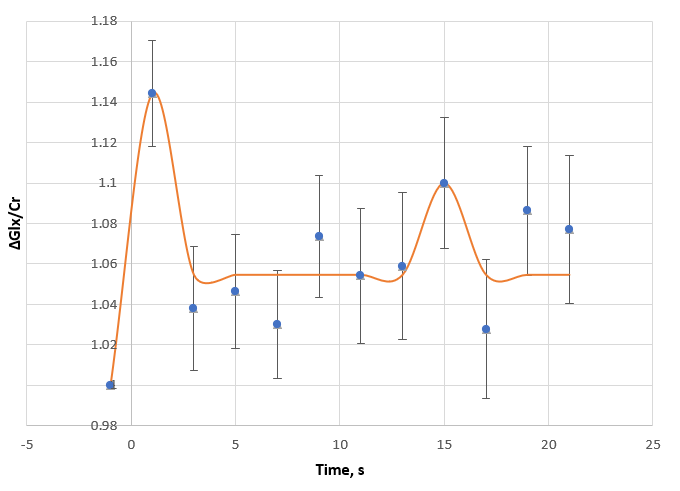
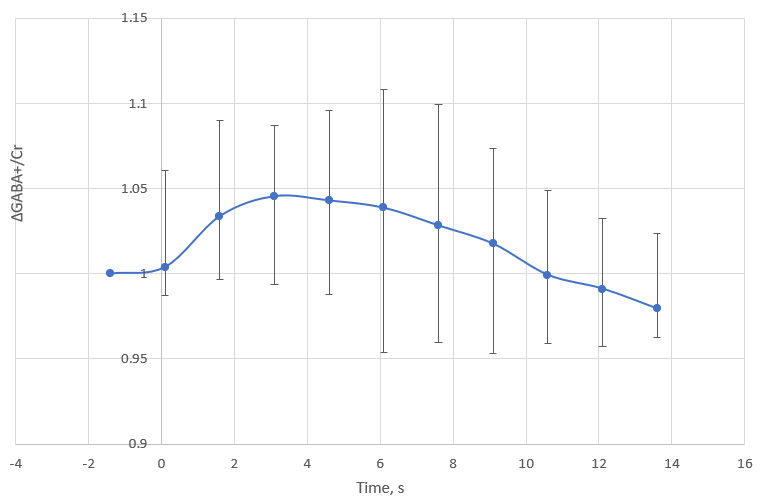
Results: Both neurotransmitter levels showed increase in first seconds after stimulus presentation and following decrease to a basic level.
Impact: This study tests hypothesis regarding rapid neurotransmitter level changes induced by vesicular release in response to short stimuli. The findings from this research have the potential to offer novel insights and methodologies for investigating neural processes.
Introduction
Two key neurometabolites in the human brain, glutamate (Glu) and gamma-aminobutyric acid (GABA), serve as excitatory and inhibitory neurotransmitters, respectively. In magnetic resonance spectroscopy (MRS) studies, the GABA-to-Glu ratio is often considered indicative of the excitation and inhibition balance. This equilibrium of neural activity holds significant relevance in various functional tasks and changes in pathological state. It is crucial to note that the actual modulation of excitation and inhibition is realized by the neurotransmitter amount interacted with receptors. Current assumptions propose that swift fluctuations in Glu levels are associated with its release from vesicles in response to an event-related stimulus. Therefore, rapid changes in GABA and Glu will show local stimulus-induced inhibition and excitation. In this study we aimed to quantify GABA and Glu levels following a brief visual stimulus lasting three seconds.Materials and Methods
MRI and single voxel 1H-MRS were performed using the Philips Achieva dStream 3T MRI System (Eindhoven, Netherlands) using the 20 coil SENSE Head coil. To measure GABA levels for Glx levels 33 and 25 healthy volunteers were recruited, respectively. Visual stimulation was achieved using an 8/4 Hz flashing checkerboard presented in similar blocks, with a 3-second stimulus followed by 13.5/21 seconds of black screen for GABA/Glx measurement. There were 40 blocks for MRS and 15 – for fMRI. Functional magnetic resonance imaging (fMRI) images were acquired using a gradient-echo echo-planar imaging (GE EPI) sequence (repetition time (TR)/echo time (TE) = 3000/40 ms, flip angle = 90°, in-plane resolution = 2.4×2.4 mm, slice thickness = 4 mm, 30 slices, and 83 transients). We generated an activation map using SPM12 in response to visual stimulation. For GABA measurements, spectra were acquired using the MEGA-PRESS sequence without macromolecule suppression (TR/TE = 1500/68 ms, 802 averages, and a voxel size of 30x40x25 mm, frequency selective pulses are 1.89 ppm and 7.46 ppm). Glx spectra were obtained using the PRESS sequence (TR/TE = 2000/35 ms, 432 averages, voxel size = 20x30x20 mm). All spectra were localized within the activated region of the visual cortex. To obtain GABA dynamics with a temporal resolution of 1.5 seconds and ensure a reliable signal-to-noise ratio (SNR), we averaged five adjacent transients. Spectra for GABA were preprocessed using Gannet, while PRESS spectra were preprocessed using FID-A, involving frequency and phase alignment as well as water removal. Quantitative analysis of the spectra was carried out using LCModel. To assess the impact of the blood-oxygen-level-dependent (BOLD) effect on metabolite spectra, we estimated differences in the linewidth of the total creatine (Cr) singlet (3.03 ppm) between each time point and the value of most distant from stimulus point (further it has negative time value – before stimulus). Cr linewidth was determined as a model estimation parameter. We tested the normality of the obtained values (GABA/Cr, Cr, and tCr linewidth) corresponding to individual time points using the Shapiro–Wilk test. In the case of a normal distribution, we performed Fisher’s least significant difference (LSD) test; otherwise, we used an uncorrected Dunn’s test. Multiple comparisons were adjusted using the Benjamini-Hochberg method (FDR-adjusted), with a significance level set at q < 0.05.Results
An increase in the level of Glx (+14%, q= 0.006) was found at the 1st second after the presentation of the stimulus and a rapid decrease to the initial level. The level of GABA also increases for 1.6-3.1 (+3-5%, q < 0.05), after which it decreases to its initial level. The maximum changes (mean ± s.d.) in the line widths and heights for Cr were -1.4±0.3%, and +1.3±0.2%, respectively, and for NAA – -1.6±0.2%, and +1.2±0.1%, respectively.Discussion
The use of a short stimulus made it possible to observe rapid changes in the level, which cannot be associated with metabolic processes1,2. Therefore, statistically significant change in both neurotransmitters may indicate that there is a change in the MR-"visible" pool of GABA and Glu upon release from the vesicles (keeping in mind the relatively large TE = 68/35 ms). The change in the width of the creatine and NAA lines are most likely due to the BOLD effect, since the resulting curve reaches a maximum at about 6 seconds, similar to the standard hemodynamic response observed with fMRI.Acknowledgements
This study was funded by the Russian Science Foundation grant/award No 23-13-00011.References
1. P. G. Mullins, «Towards a theory of functional magnetic resonance spectroscopy (fMRS): A meta‐analysis and discussion of using MRS to measure changes in neurotransmitters in real time», Scandinavian Journal of Psychology, 59, 1, p. 91–103, 2018, doi: 10.1111/sjop.12411.
2. R. A. Kauppinen, T. R. M. Pirttila, S. O. K. Auriola, и S. R. Williams, «Compartmentation of cerebral glutamate in situ as detected by 1H/13C n.m.r.», Biochemical Journal, 298, 1, p. 121–127, 1994, doi: 10.1042/bj2980121.
Figures