3153
Integrated Resting-state and Breath-hold Paradigm for Reliable Cerebrovascular Reactivity Mapping and Functional Connectivity1State Key Laboratory of Brain and Cognitive Science, Institute of Biophysics, Chinese Academy of Sciences, Beijing, China, 2University of Chinese Academy of Sciences, Beijing, China, 3Siemens Shenzhen Magnetic Resonance Ltd., Shenzhen, China, 4Institute of Artificial Intelligence, Hefei Comprehensive National Science Center, Hefei, China
Synopsis
Keywords: Vascular, Vessels
Motivation: There is a lack of head-to-head evaluation of resting-state (RS) and breath-hold (BH) cerebrovascular reactivity (CVR).
Goal(s): Propose an integrated paradigm combining RS- and BH-BOLD acquisition in a single run, and evaluate the reliability of RS- and BH-CVR mapping with this protocol.
Approach: Combined RS- and BH-BOLD data were acquired on a 7T scanner. CVR mappings of various time windows were calculated and compared.
Results: RS-BOLD can be calculated for CVR mapping but is susceptible to BOLD signal outliers. BH-BOLD produces stable CVR mappings with higher dynamic range. The integrated paradigm guarantees reliable BH-CVR mapping and RS-fMRI analysis.
Impact: The introduction of the RS-BH paradigm offers an avenue for reliable CVR mapping with high dynamic range and is compatible with conventional RS-fMRI analysis.
Introduction
Cerebrovascular reactivity (CVR), representing cerebral blood vessel adaptation according to blood pressure and carbon dioxide levels, is widely used in studies of cerebrovascular function [1]. Conventional CVR mapping involves hypercapnic gas inhalation or breath-holding tasks during blood oxygenation level dependent (BOLD) scanning [2]; this approach is limited by subject compliance [3]. CVR mapping through resting-state (RS) BOLD MRI has gained attention for its feasibility and versatility [4, 5]. Despite RS-BOLD’s extensive use in brain functional analyses [6], no head-to-head comparative studies of CVR mapping results from RS and breath-holding paradigms exist. We evaluated a novel CVR mapping protocol at 7T, combining RS and BH conditions in a single run to access differences in their CVR mappings.Methods
MRI AcquisitionSix healthy adults (three men, aged 20-30 years) were scanned using a Siemens MAGNETOM 7T plus research scanner. The protocols included T1-weighted magnetization-prepared rapid acquisition with gradient echo (MP2RAGE) and multiband-echo-planar imaging (EPI). The MP2RAGE was acquired with the resolution of isotropic 0.70mm and TR/TE/TI 1/T1 2 = 4000/2.43/740/2430 ms. The BOLD-EPI parameters were: TR/TE = 1000/20.40 ms; FOV =192×192 mm2; resolution matrix = 128×128; voxel size = 1.5×1.5×1.5 mm3; 85 slices; multiband acceleration factor = 5; and GRAPPA acceleration factor = 2, measurements = 720. An integrated RS and BH paradigm was established for BOLD scans. Volunteers did nothing for 9 min, then performed breath modulation (Figure 1) guided by a Sinorad Medical in-bore screen displaying white fixation and grey prompts on a black background. A separate experiment with 7.5-min RS and nine BH replicates assessed BH-CVR mapping effects.
Data Analysis
CVR mapping was calculated using a custom script in seeVR (https://www.seevr.nl/). Whole-brain signals in the range of 0-0.1164 Hz were extracted as the independent variables, and voxel-wise time courses served as the dependent variable. Voxel-wise generalized linear model regression analysis was used to generate relative CVR maps.
The dynamic range of CVR values was measured by the FWHM of the histogram. The mean CVR for the entire brain was calculated as a representative metric for overall mapping of CVR in individual experiments. The effects of time window length and the presence of outliers on CVR were compared using ANOVA analysis. A paired sample t-test evaluated RS-CVR and BH-CVR dynamic range differences. CONN was used to analyse RS-fMRI data, and ROI-to-ROI analysis calculated functional connectivity.
Results
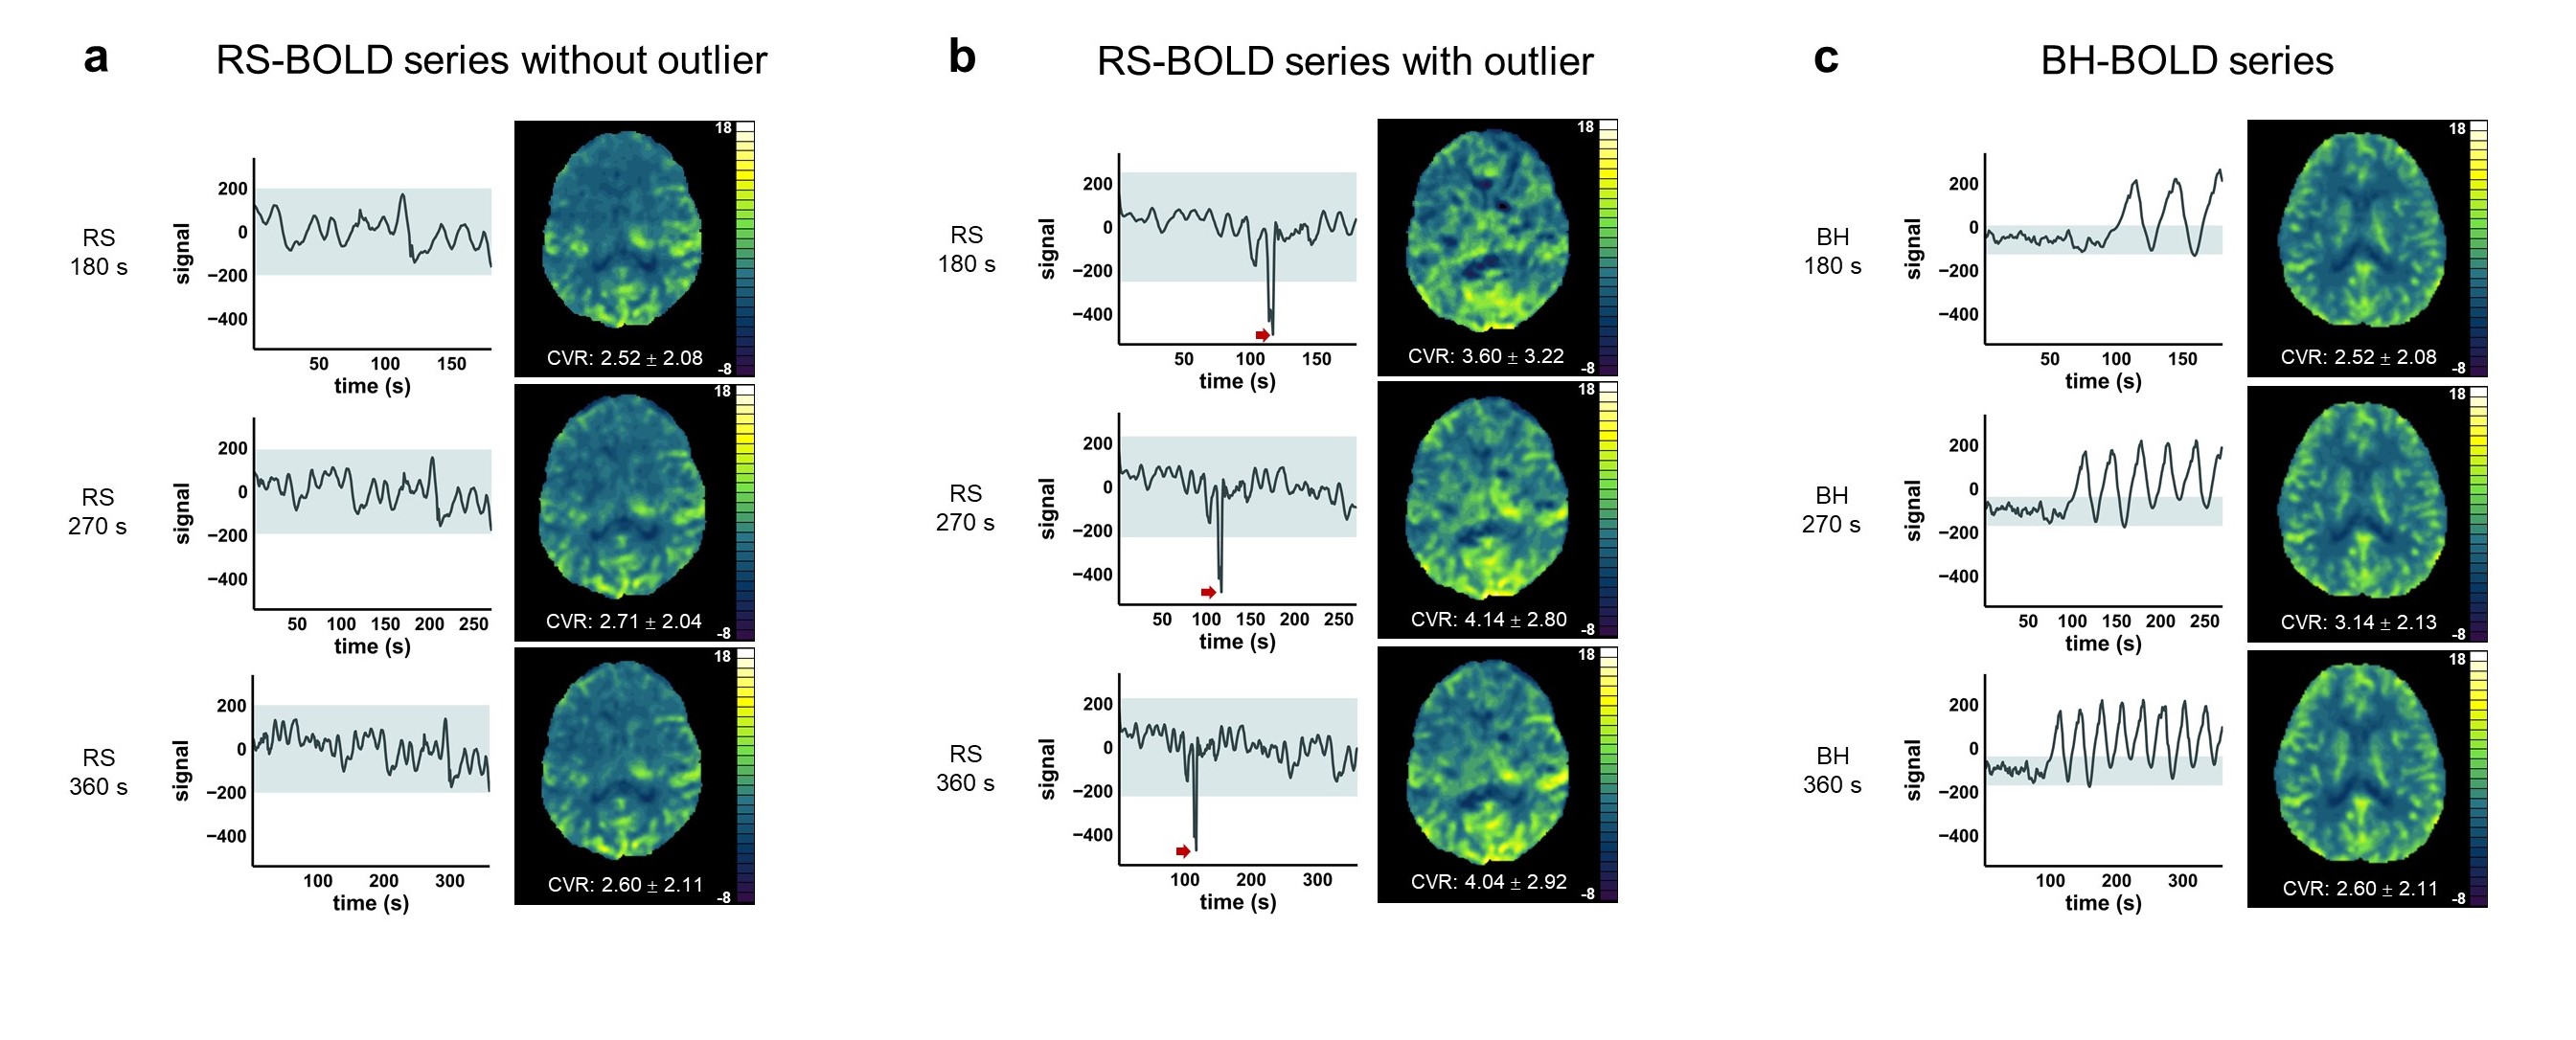
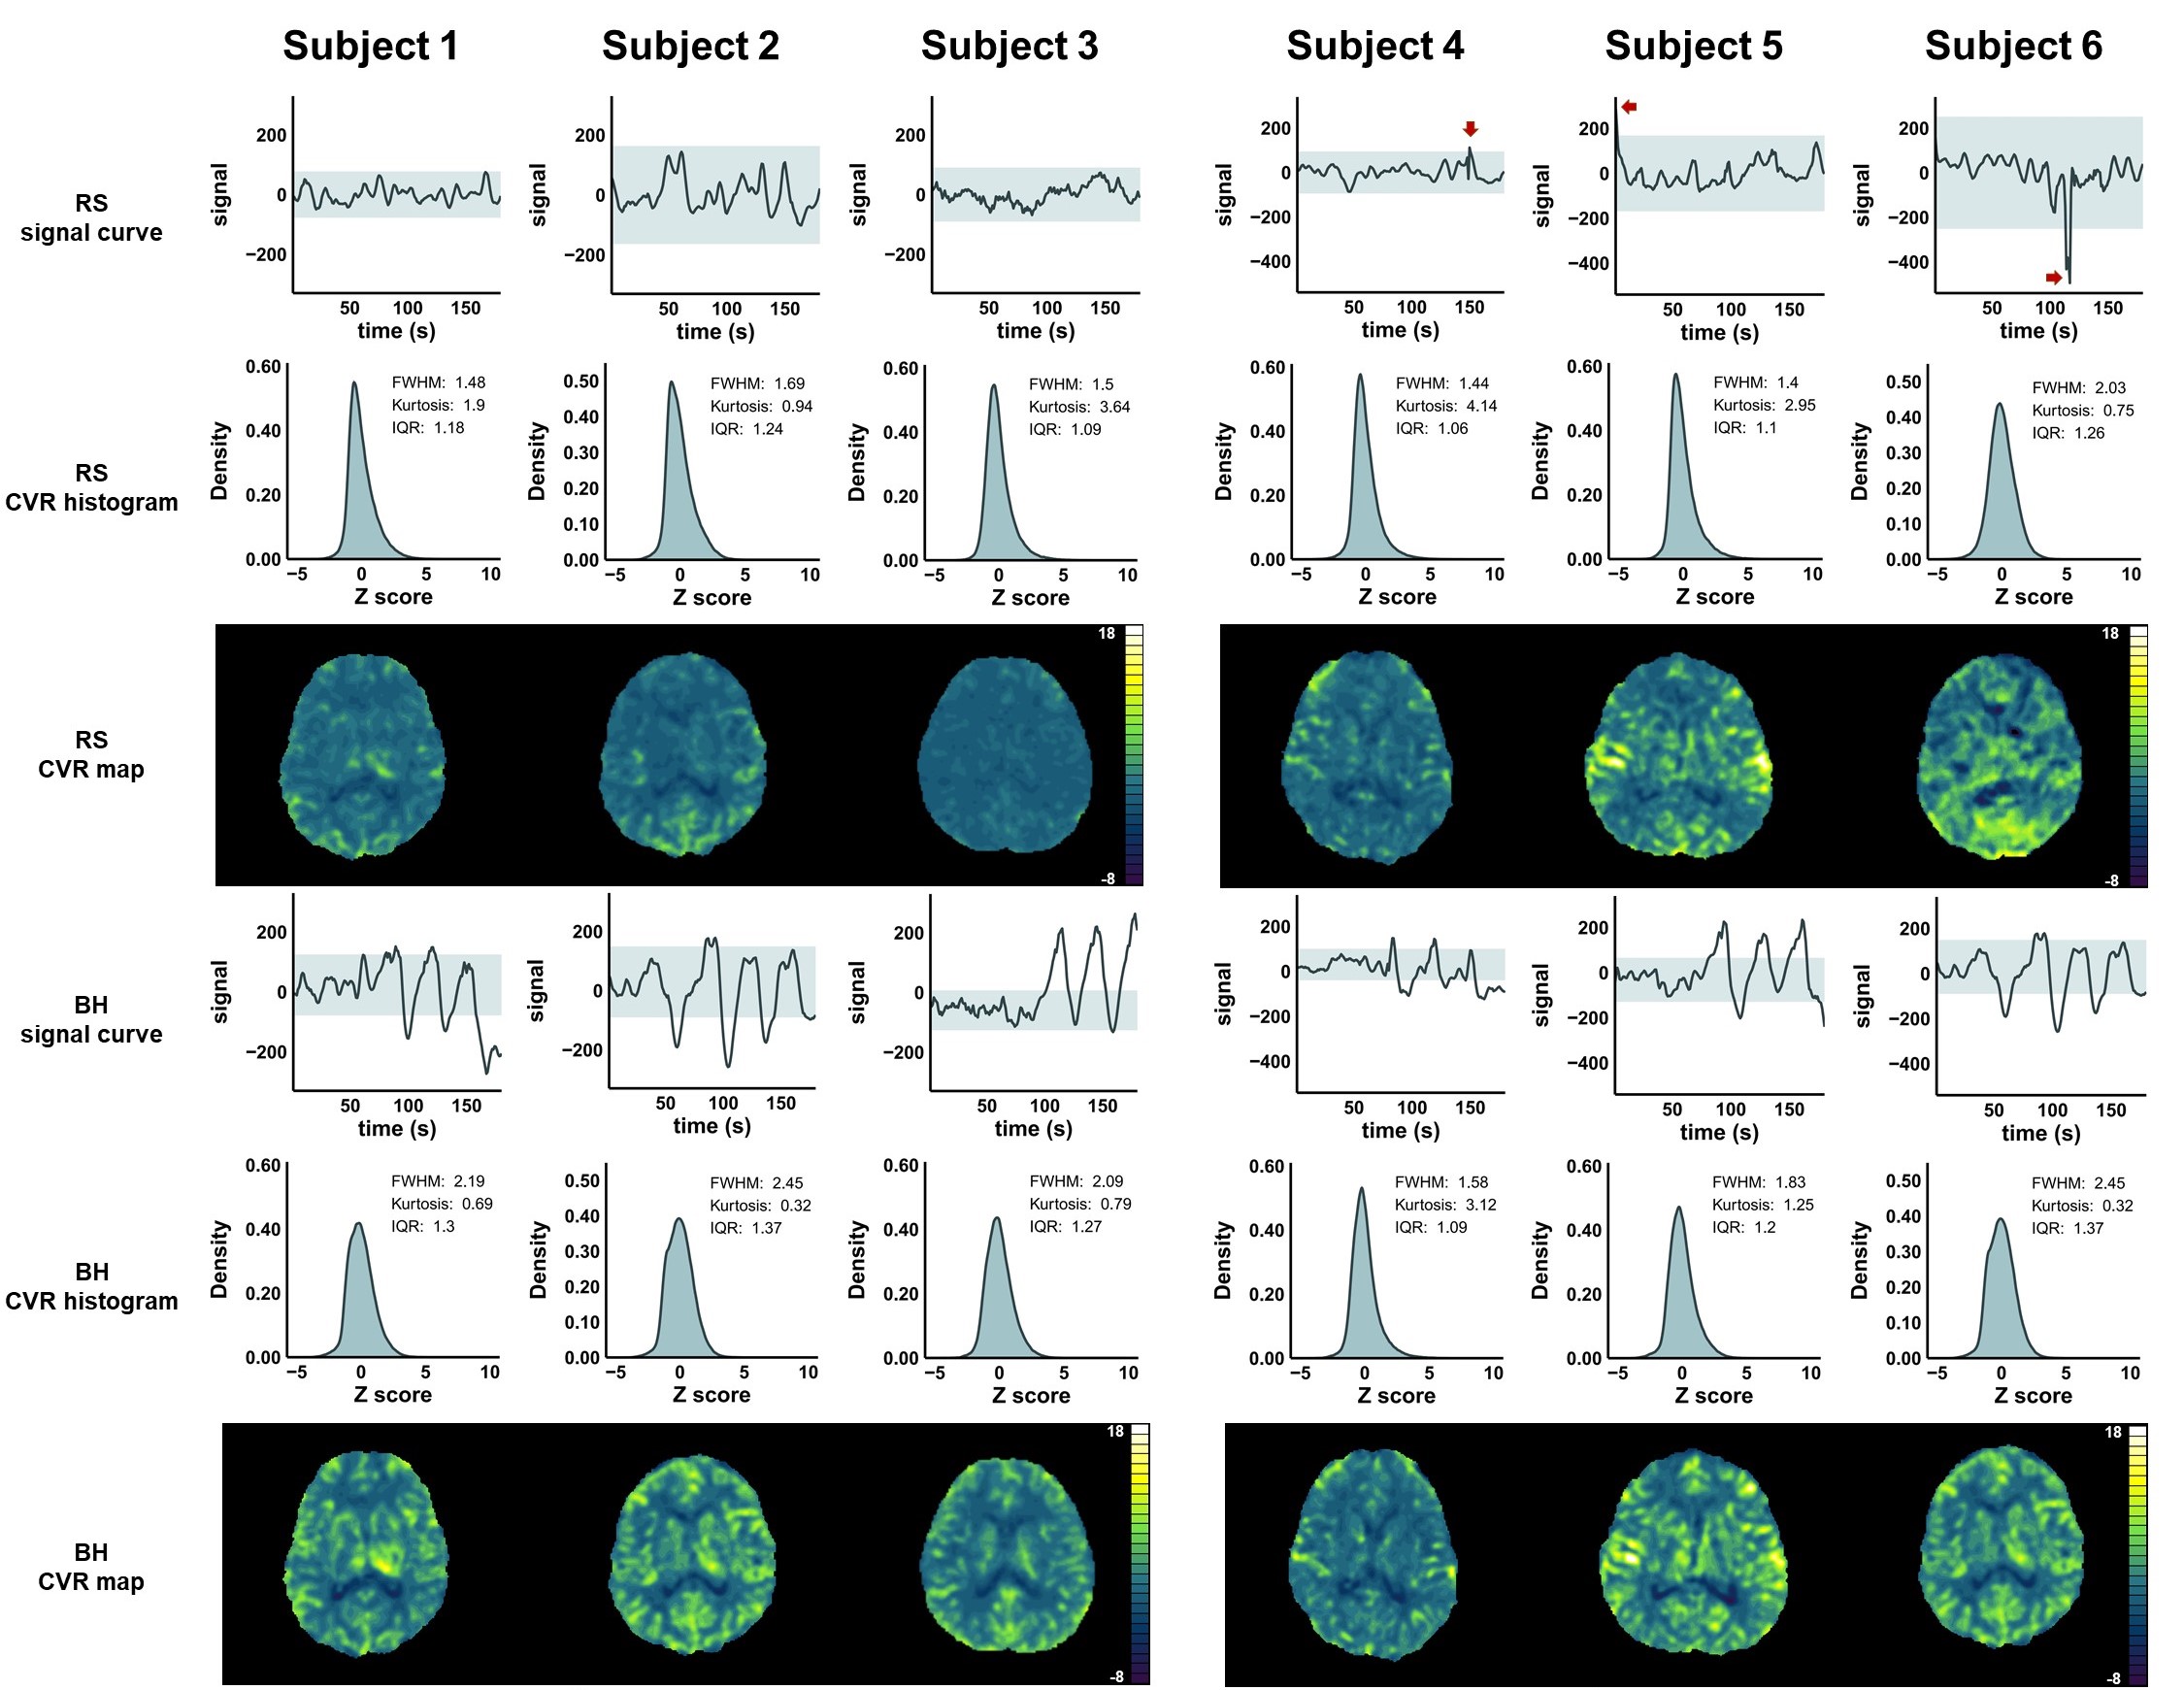
Figure 2 illustrates the impacts of various BOLD time windows on CVR mapping. In all the conditions, the lengths of BOLD series have no effect on the CVR results (F(1, 7) RS-outlier = 0.0950, pRS-outlier = 0.7670; F(1, 7) RS-no-outlier = 0.0270, pRS-no-outlier = 0.8740; F(1, 7) BH = 0.7000, pBH = 0.4300). Compared with BH-CVR, RS-CVR tends to yield lower CVR values (F(1, 14) = 6.3380, p = 0.0246 *). When outliers (signal intensity >3 or <3 standard deviations) are present in RS-BOLD, CVR values are higher than that calculated without outliers (F(1, 14) = 8.8060, p = 0.0102 *), approaching values from BH-BOLD (F(1, 14) = 1.7790, p = 0.2040). BOLD signal time curves and CVR mappings are shown for BH, RS with and without outliers.Figure 3 shows head-to-head quantitative comparisons of CVR distributions. BH-CVR mappings tend to show the highest dynamic range (F(2, 8) = 2.9280, p = 0.1110, meanFWHMBH = 2.0280±0.3347, meanFWHMRS-outlier = 1.6233±0.3528, meanFWHMRS-no-outlier = 1.5556±0.1159). FWHM of RS-CVR with BOLD outliers approximate BH-CVR (p = 0.0739), rather than RS-CVR without BOLD outliers (p = 0.0053 **).
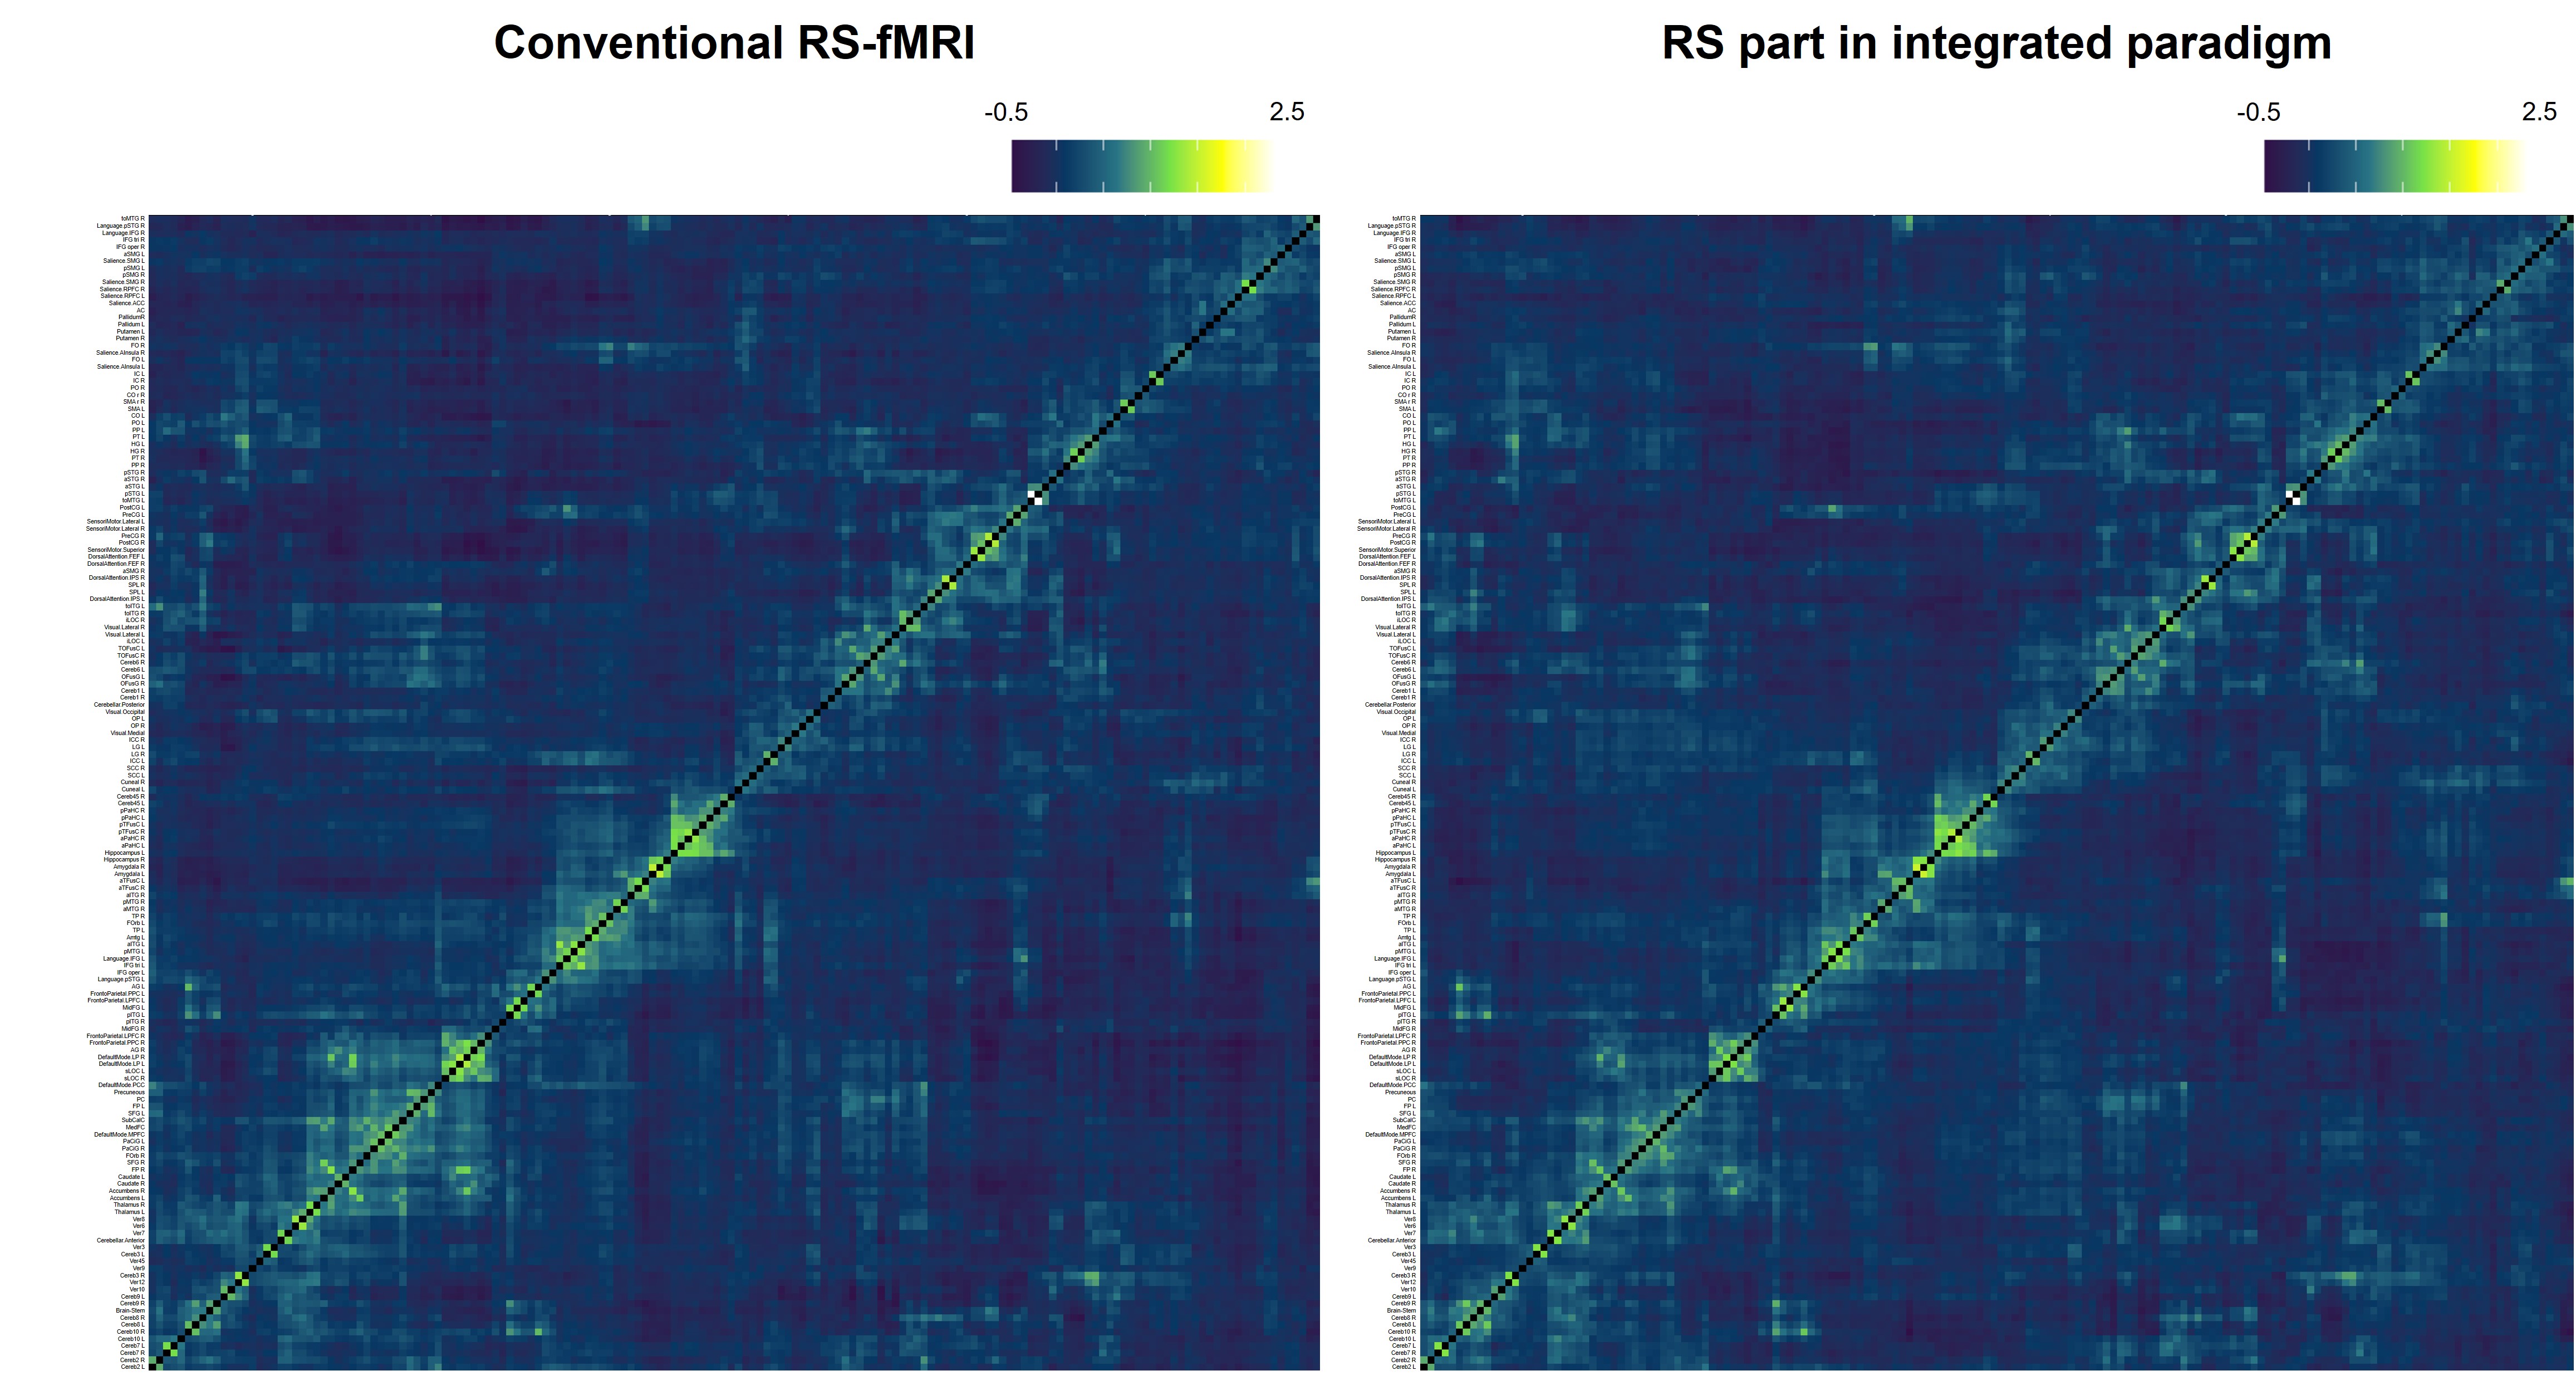
Figure 4 displays the global ROI-to-ROI analysis results on 4 subjects using 164 ROIs predefined in CONN. No significant connectivity change is observed between conventional RS-fMRI and the RS part in the integrated paradigm.
Discussion
Our integrated paradigm to acquire RS- and BH-BOLD signals in a single run was used to evaluate the stabilities of RS-CVR and BH-CVR at 7T. CVR mappings were obtained from RS-BOLD signals. BOLD outliers, potentially from irregular respiration, increased RS-CVR to levels near BH-CVR, influencing CVR results. BOLD outliers may result from irregular respiration; however, volunteers cannot be required to maintain steady breathing during RS acquisition. BH-CVR provides stable CVR mapping with a higher dynamic range for identifying small CVR differences. The time window had minimal impact on CVR mapping in all conditions, and the BH acquisition window can be shortened. Integrated data can be used for both CVR mapping and RS analysis. The study was limited by the number of participants.Conclusion
An integrated paradigm was proposed to acquire RS and BH BOLD signal for simultaneous stable CVR mapping and RS analysis.Acknowledgements
This work was supported in part by National Natural Science Foundation of China (82271985, 82001804, 81961128030), Youth Innovation Promotion Association CAS (2022093), National Science and Technology Innovation 2030 Major Program (2022ZD0211900, 2022ZD0211901), Ministry of Science and Technology of China grant (2019YFA0707103), and National Nature Science Foundation of China grant (31730039).References
[1] Sleight E, Stringer MS, Marshall I, et al. Cerebrovascular Reactivity Measurement Using Magnetic Resonance Imaging: A Systematic Review. Front Physiol. 2021;12:643468.
[2] Pinto J, Bright MG, Bulte DP, et al. Cerebrovascular Reactivity Mapping Without Gas Challenges: A Methodological Guide. Front Physiol. 2021;11:608475.
[3] Liu P, Li Y, Pinho M, et al. Cerebrovascular reactivity mapping without gas challenges. Neuroimage. 2017;146:320-326.
[4] Yeh MY, Chen HS, Hou P, et al. Cerebrovascular Reactivity Mapping Using Resting-State Functional MRI in Patients With Gliomas. J Magn Reson Imaging. 2022;56(6):1863-1871.
[5] Liu P, Liu G, Pinho MC, et al. Cerebrovascular Reactivity Mapping Using Resting-State BOLD Functional MRI in Healthy Adults and Patients with Moyamoya Disease. Radiology. 2021;299(2):419-425.
[6] Nir T, Jacob Y, Huang KH, et al. Resting-state functional connectivity in early postanaesthesia recovery is characterised by globally reduced anticorrelations. Br J Anaesth. 2020;125(4):529-538.
Figures