3152
Comparison of the spatial distribution of BOLD Regional Homogeneity (ReHo) and Cerebral Blood Flow at rest1Institute of Advanced Biomedical Technology (ITAB), "D'Annunzio" University of Chieti-Pescara, Chieti, Italy, 2Department of Neuroscience, Imaging, and Clinical Sciences, "D'Annunzio" University of Chieti-Pescara, Chieti, Italy, 3Cardiff University Brain Research Imaging Centre (CUBRIC), School of Psychology, Cardiff University, Cardiff, United Kingdom, 4Cardiff University Brain Research Imaging Centre (CUBRIC), School of Physics and Astronomy, Cardiff University, Cardiff, United Kingdom
Synopsis
Keywords: Data Processing, Brain Connectivity
Motivation: Regional Homogeneity (ReHO) of BOLD signal is a potential marker of brain activity at rest. CBF is coupled to metabolism in the human brain and it can be used to investigate the physiological significance of ReHo.
Goal(s): We aimed to assess the spatial correlation between ReHo and ASL-derived CBF and its temporal stability.
Approach: Twenty subjects underwent 28 minutes of simultaneously acquired BOLD-ASL resting-state fMRI. CBF and ReHo spatial associations at different times were estimated and compared.
Results: We found a modest but stable and significant spatial correlation between CBF and ReHo.
Impact: This study could be significant for diagnosis and treatment of neurological disorders. If ReHo is demonstrated to be a reliable marker of local brain metabolism, it could be used to develop new fMRI methods for detecting and monitoring brain disorders.
INTRODUCTION
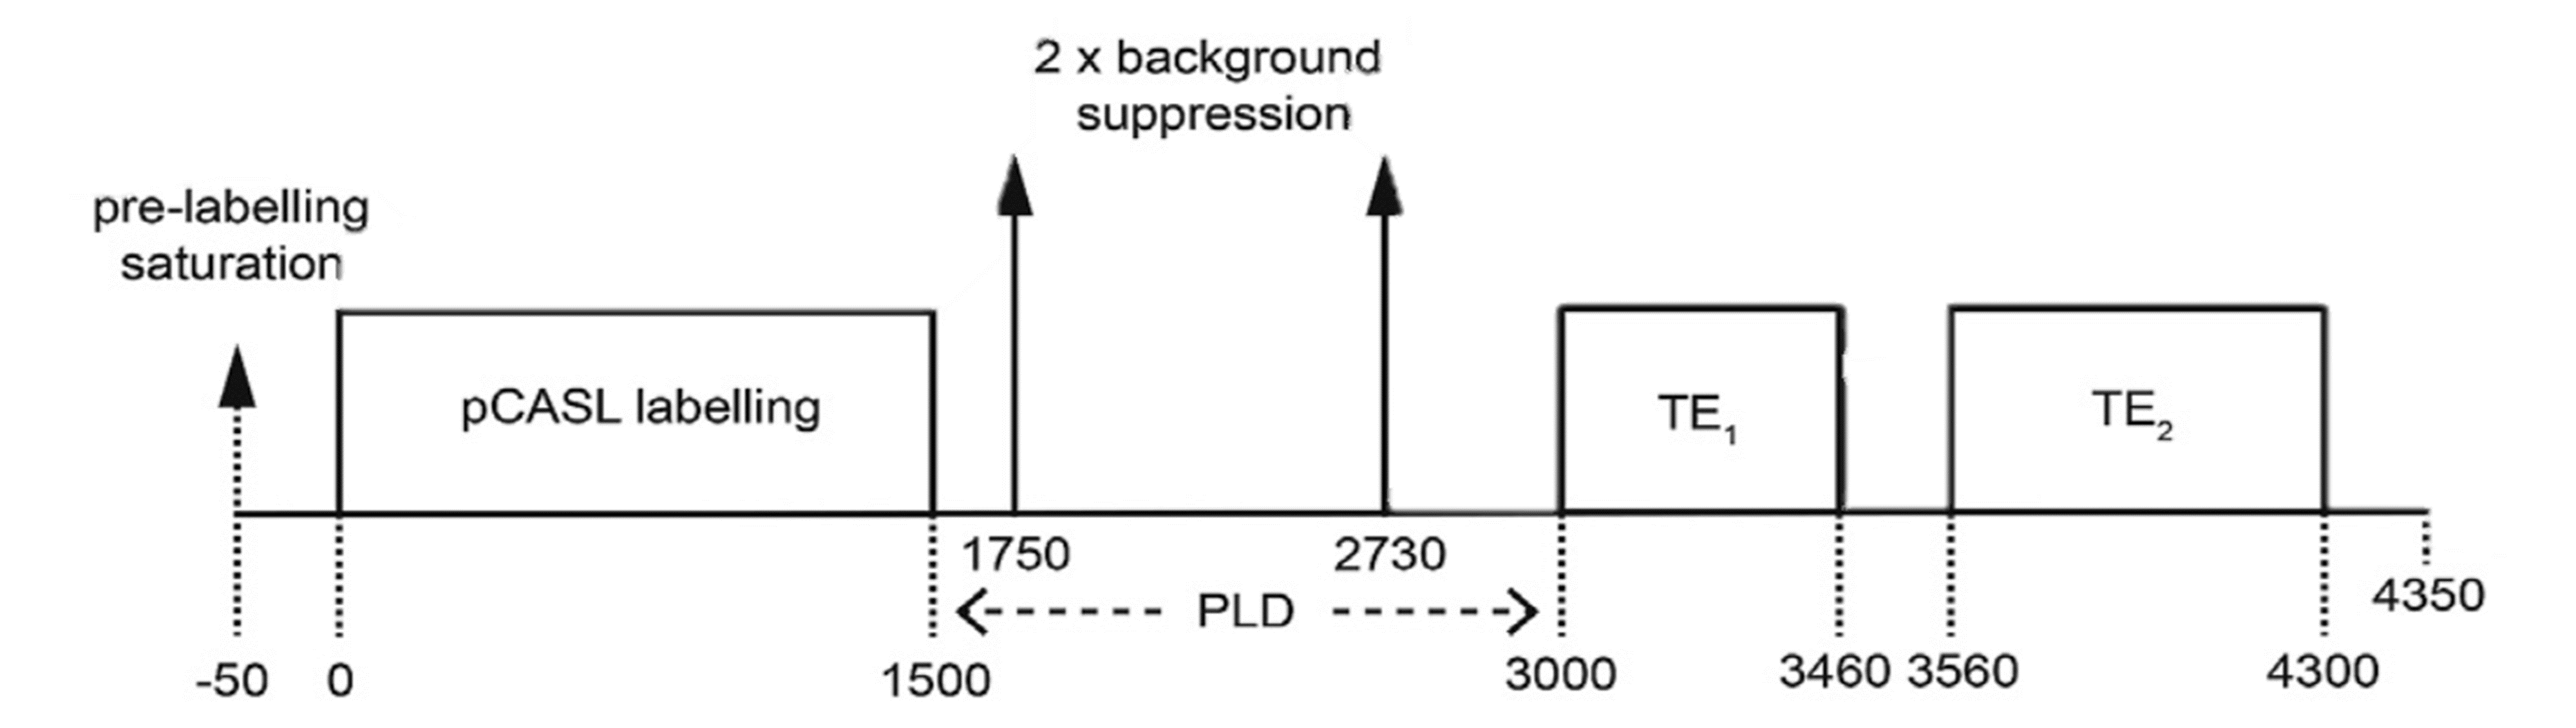
Regional Homogeneity (ReHo) is a voxel-wise parameter derived from the BOLD fMRI time-course variations at rest and is suggested to depict brain activity1. Specifically, ReHo is calculated using Kendal’s coefficient of concordance and estimates local synchronization of BOLD signal among neighboring voxels, indicating a co-varying cluster of voxels2. The spatial similarity of ReHo, blood flow and oxygen consumption in the resting state brain has been demonstrated with PET1,3. However, these results were obtained using quantitative maps from different modalities which may produce spatially different metabolic patterns1 and do not take into account the temporal variation in underlying metabolism and ReHo. We aimed to compare BOLD and CBF MRI signals using a custom pseudo-continuous arterial spin labelling (pCASL) acquisition with pre-saturation and background suppression4 and a dual-excitation (DEXI) readout5,6, producing a good ASL signal from the short echo-time data and BOLD contrast from the longer echo-time data (Fig. 1). This approach allowed us to obtain simultaneous CBF and ReHo maps.METHODS
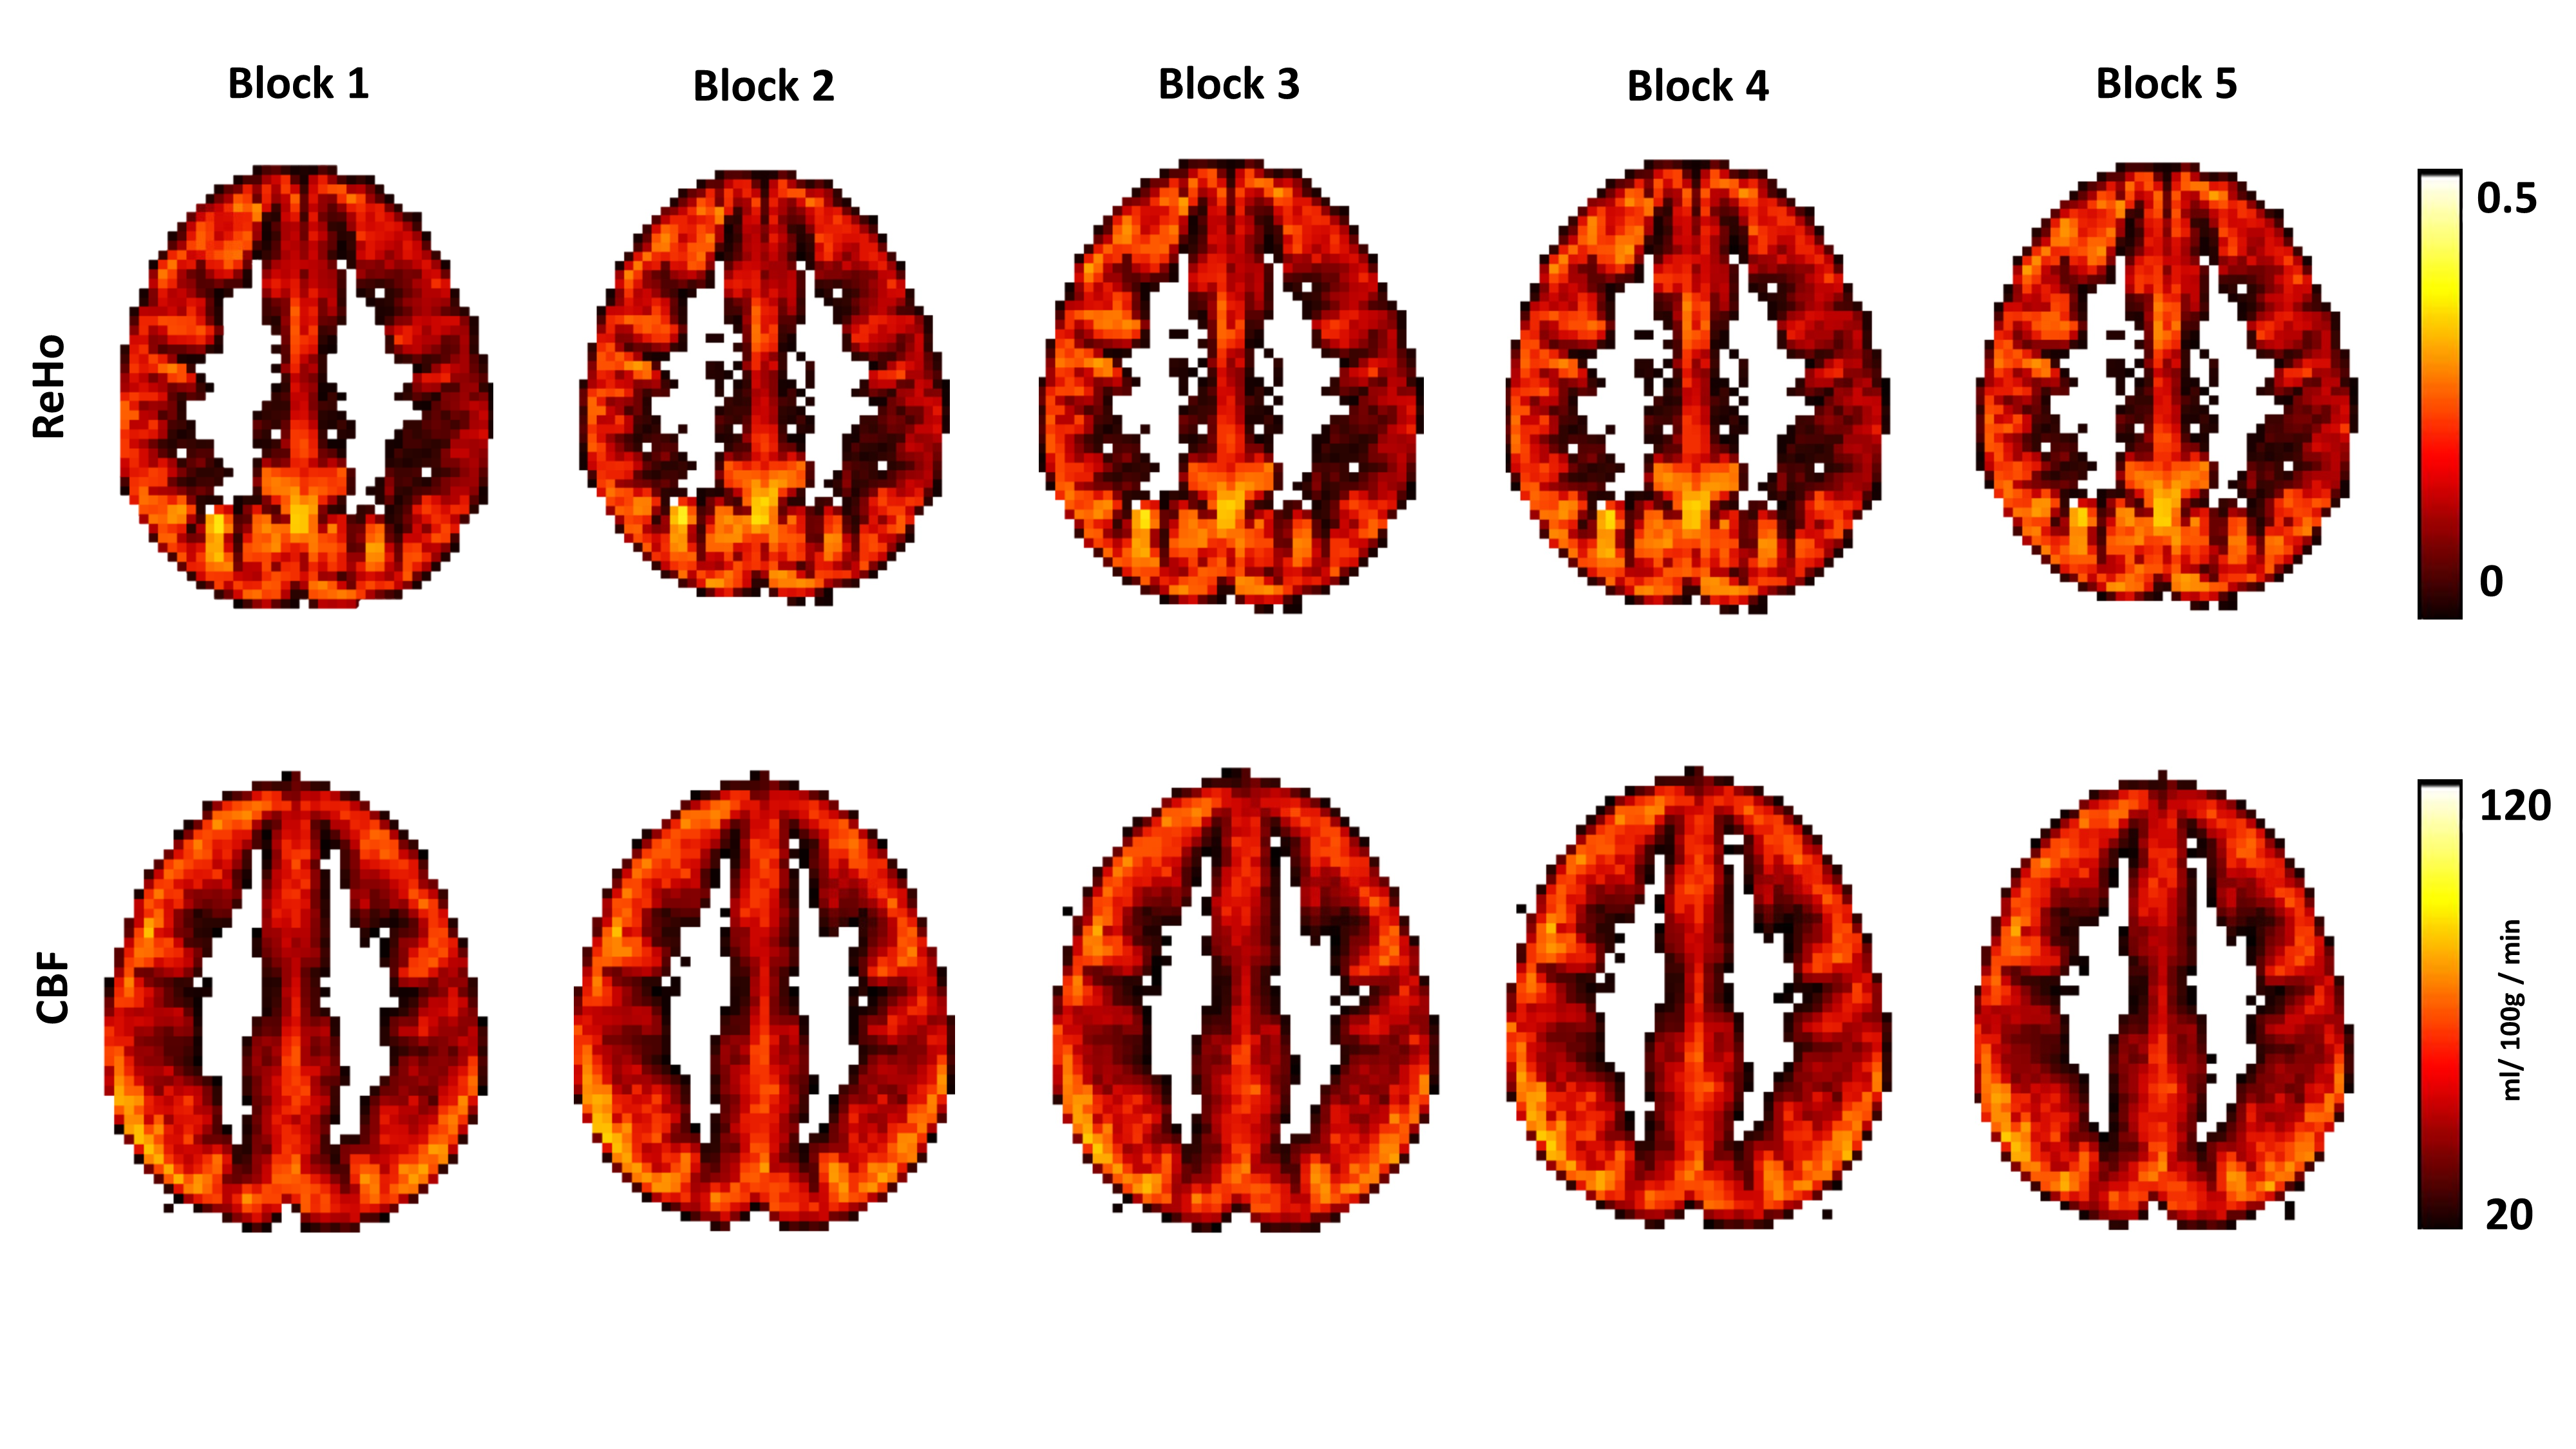
Resting-state data from 20 healthy subjects (age: 27.5±3.8 years; 11F/9M) were acquired on a Siemens Prisma 3T scanner (Siemens Healthineers, Erlangen, Germany), using a 32-channel head coil. A magnetization prepared rapid acquisition with gradient echo, T1-weighted scan was acquired for registration (1mm isotropic resolution, 200 slices, TR/TE = 2100/3.24ms). DEXI images were acquired using τ and PLD=1.5s, GRAPPA=3, TE1/ TE2=10/30ms, TR=4.9 s, number of slices=16, resolution 3.4 x 3.4 x 7mm with a 20% slice gap. 351 tag-control pairs resulted in 702 volumes being acquired over 28-min. A calibration (M0 image) was acquired for ASL quantification with pCASL and background suppression switched off, with TR/TE 6s/10ms. T1w images were firstly corrected for field inhomogeneities using the N4biasfieldcorrection algorithm in ANTS7 and skull stripped using FSL BET8. After skull stripping, the brains were registered into MNI space9 using Syn transformations in ANTs and segmented using FSL FAST10 algorithm to obtain tissue probability maps. DEXI images were split into the two echoes and processed separately: both echoes were motion corrected using AFNI 3dvolreg11 and registered to T1W image using rigid body (6 DOF) transformations with ANTs. TE2 images were detrended for nuisance covariates unrelated to neuronal activity (head motion and CSF). The 28-min long fMRI recording was split into 5 blocks of 70 volumes for both echoes (343 s). Then, TE1 images were used to calculate quantitative CBF maps using the single compartment kinetic model13. ReHo was calculated from TE2 using MATLAB (Mathworks Inc.) toolbox DPABI V5.314, using the subject specific gray matter mask and a neighborhood of 27. CBF and ReHo maps were then z-scored. AAL atlas labels were warped into subject space and used to calculate regional CBF and ReHo values as median grey matter values in the regions. The regional values were used to calculate the correlation across regions between CBF and ReHo for each subject. The spatial correlation coefficients were then averaged across subjects.RESULTS
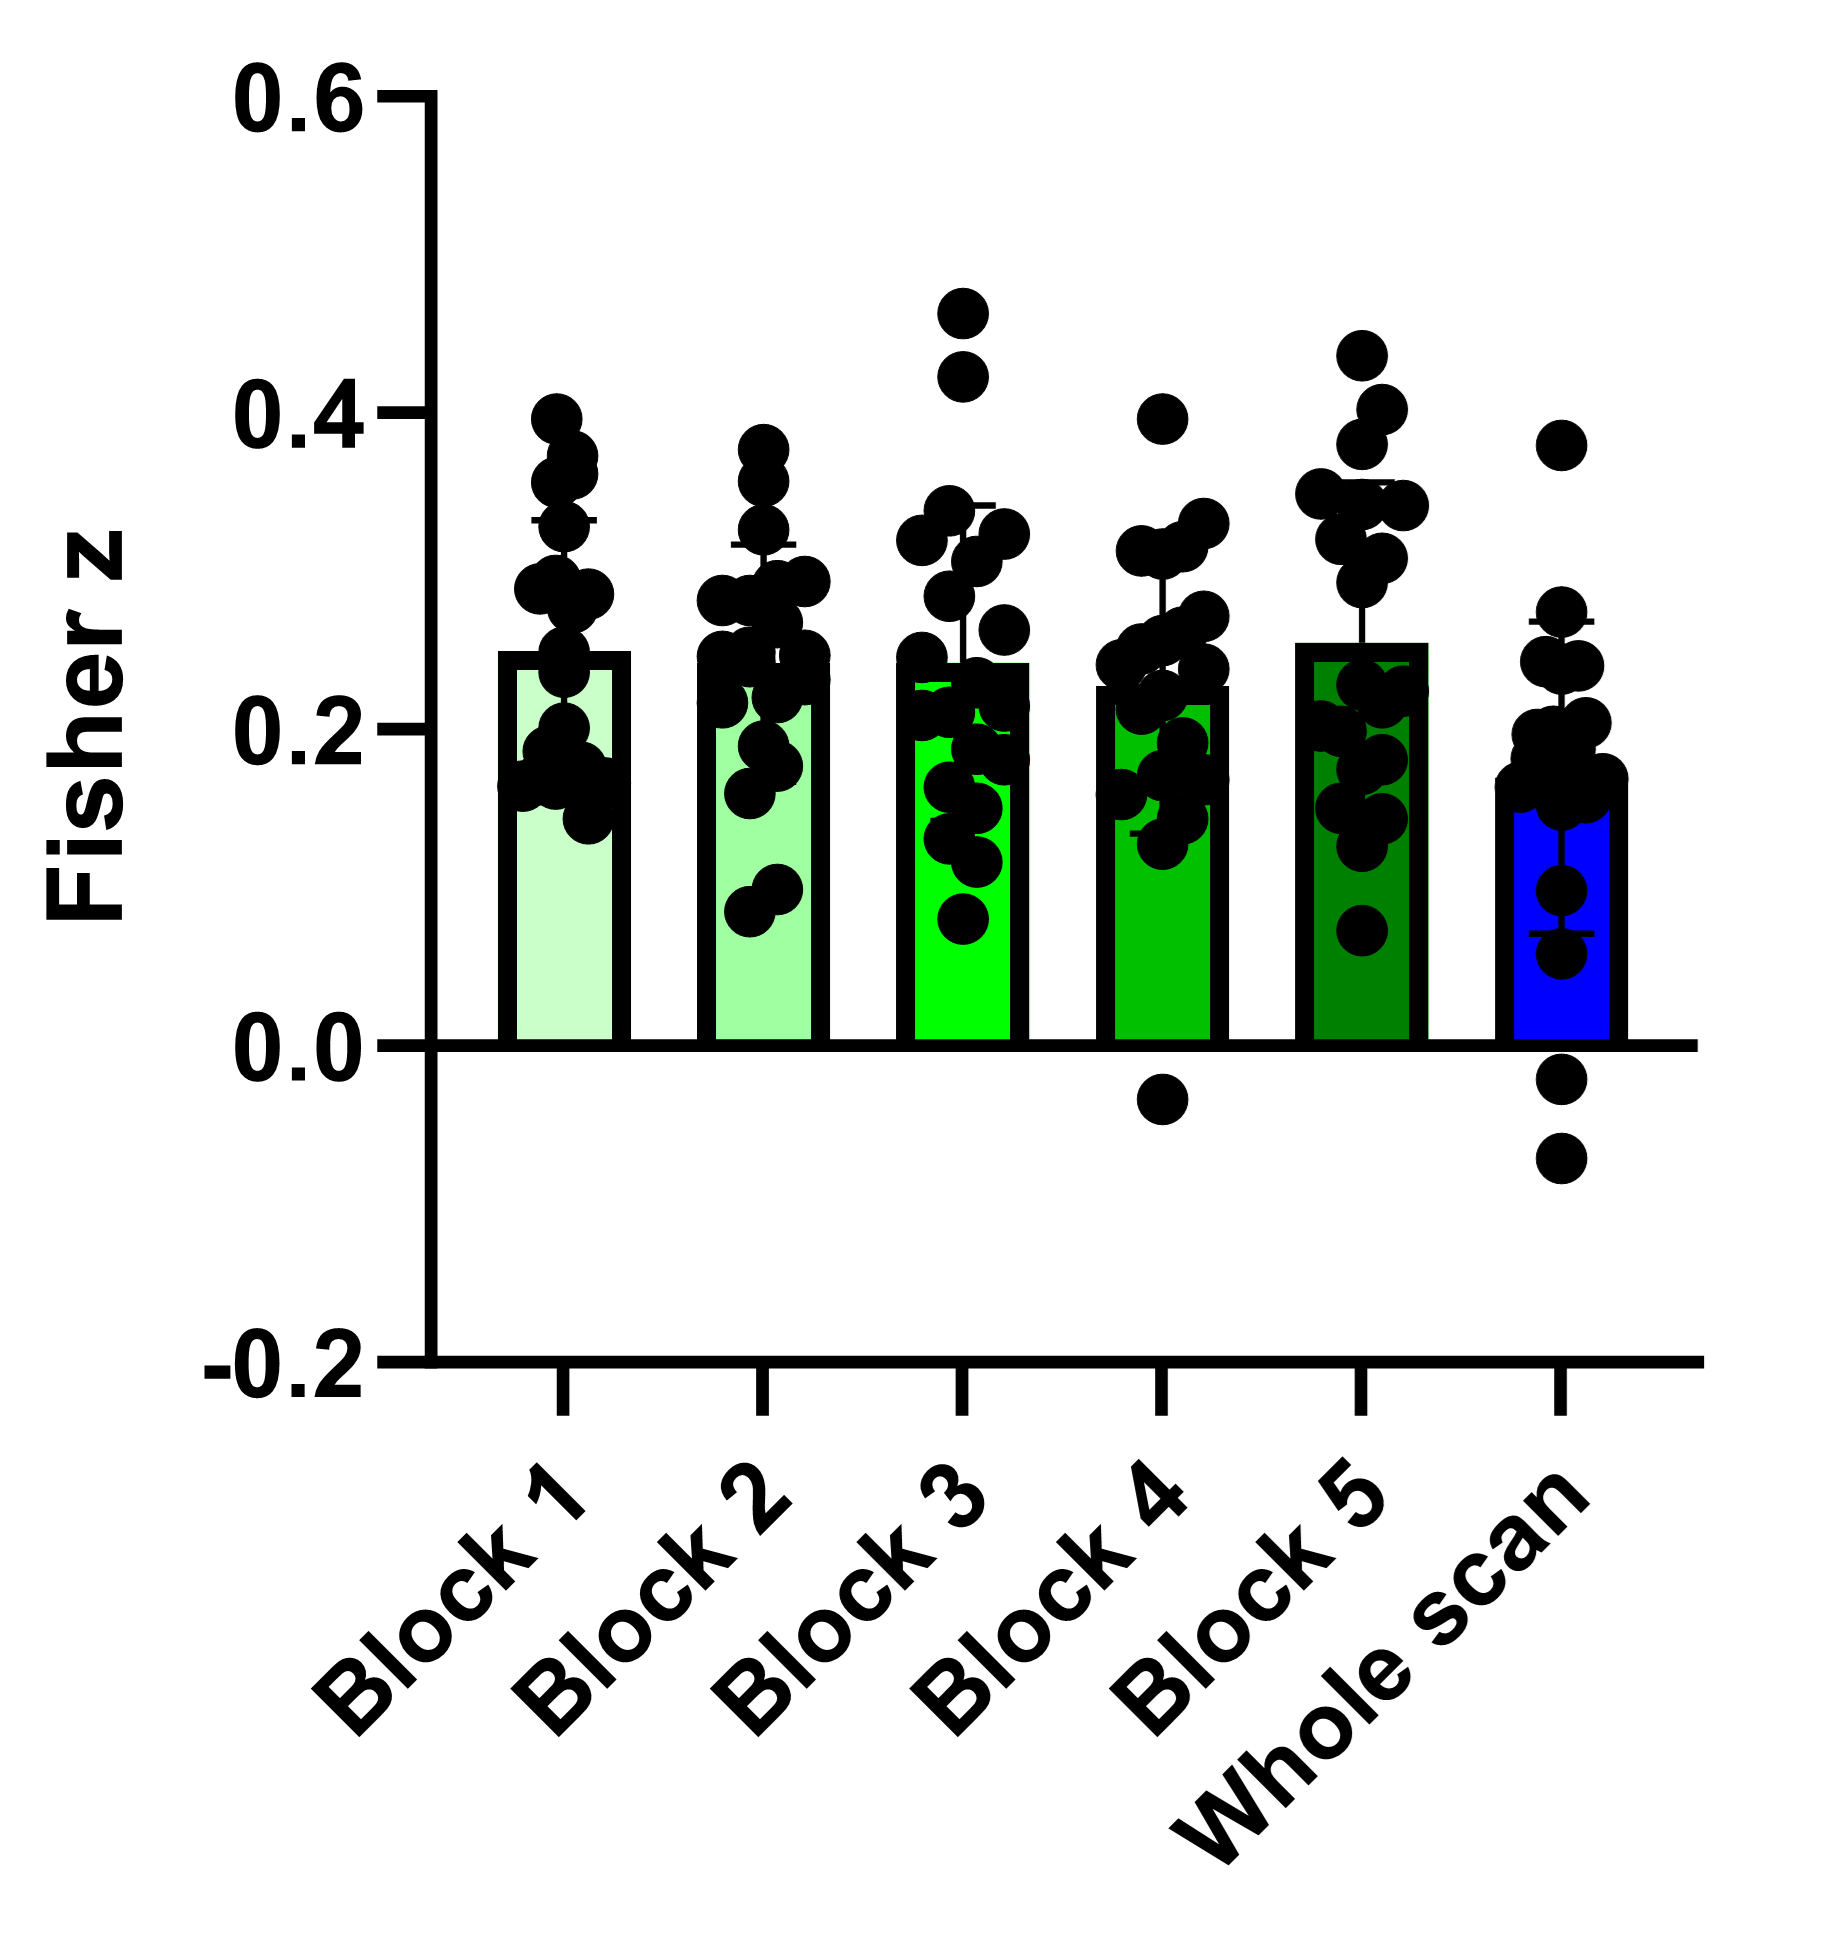
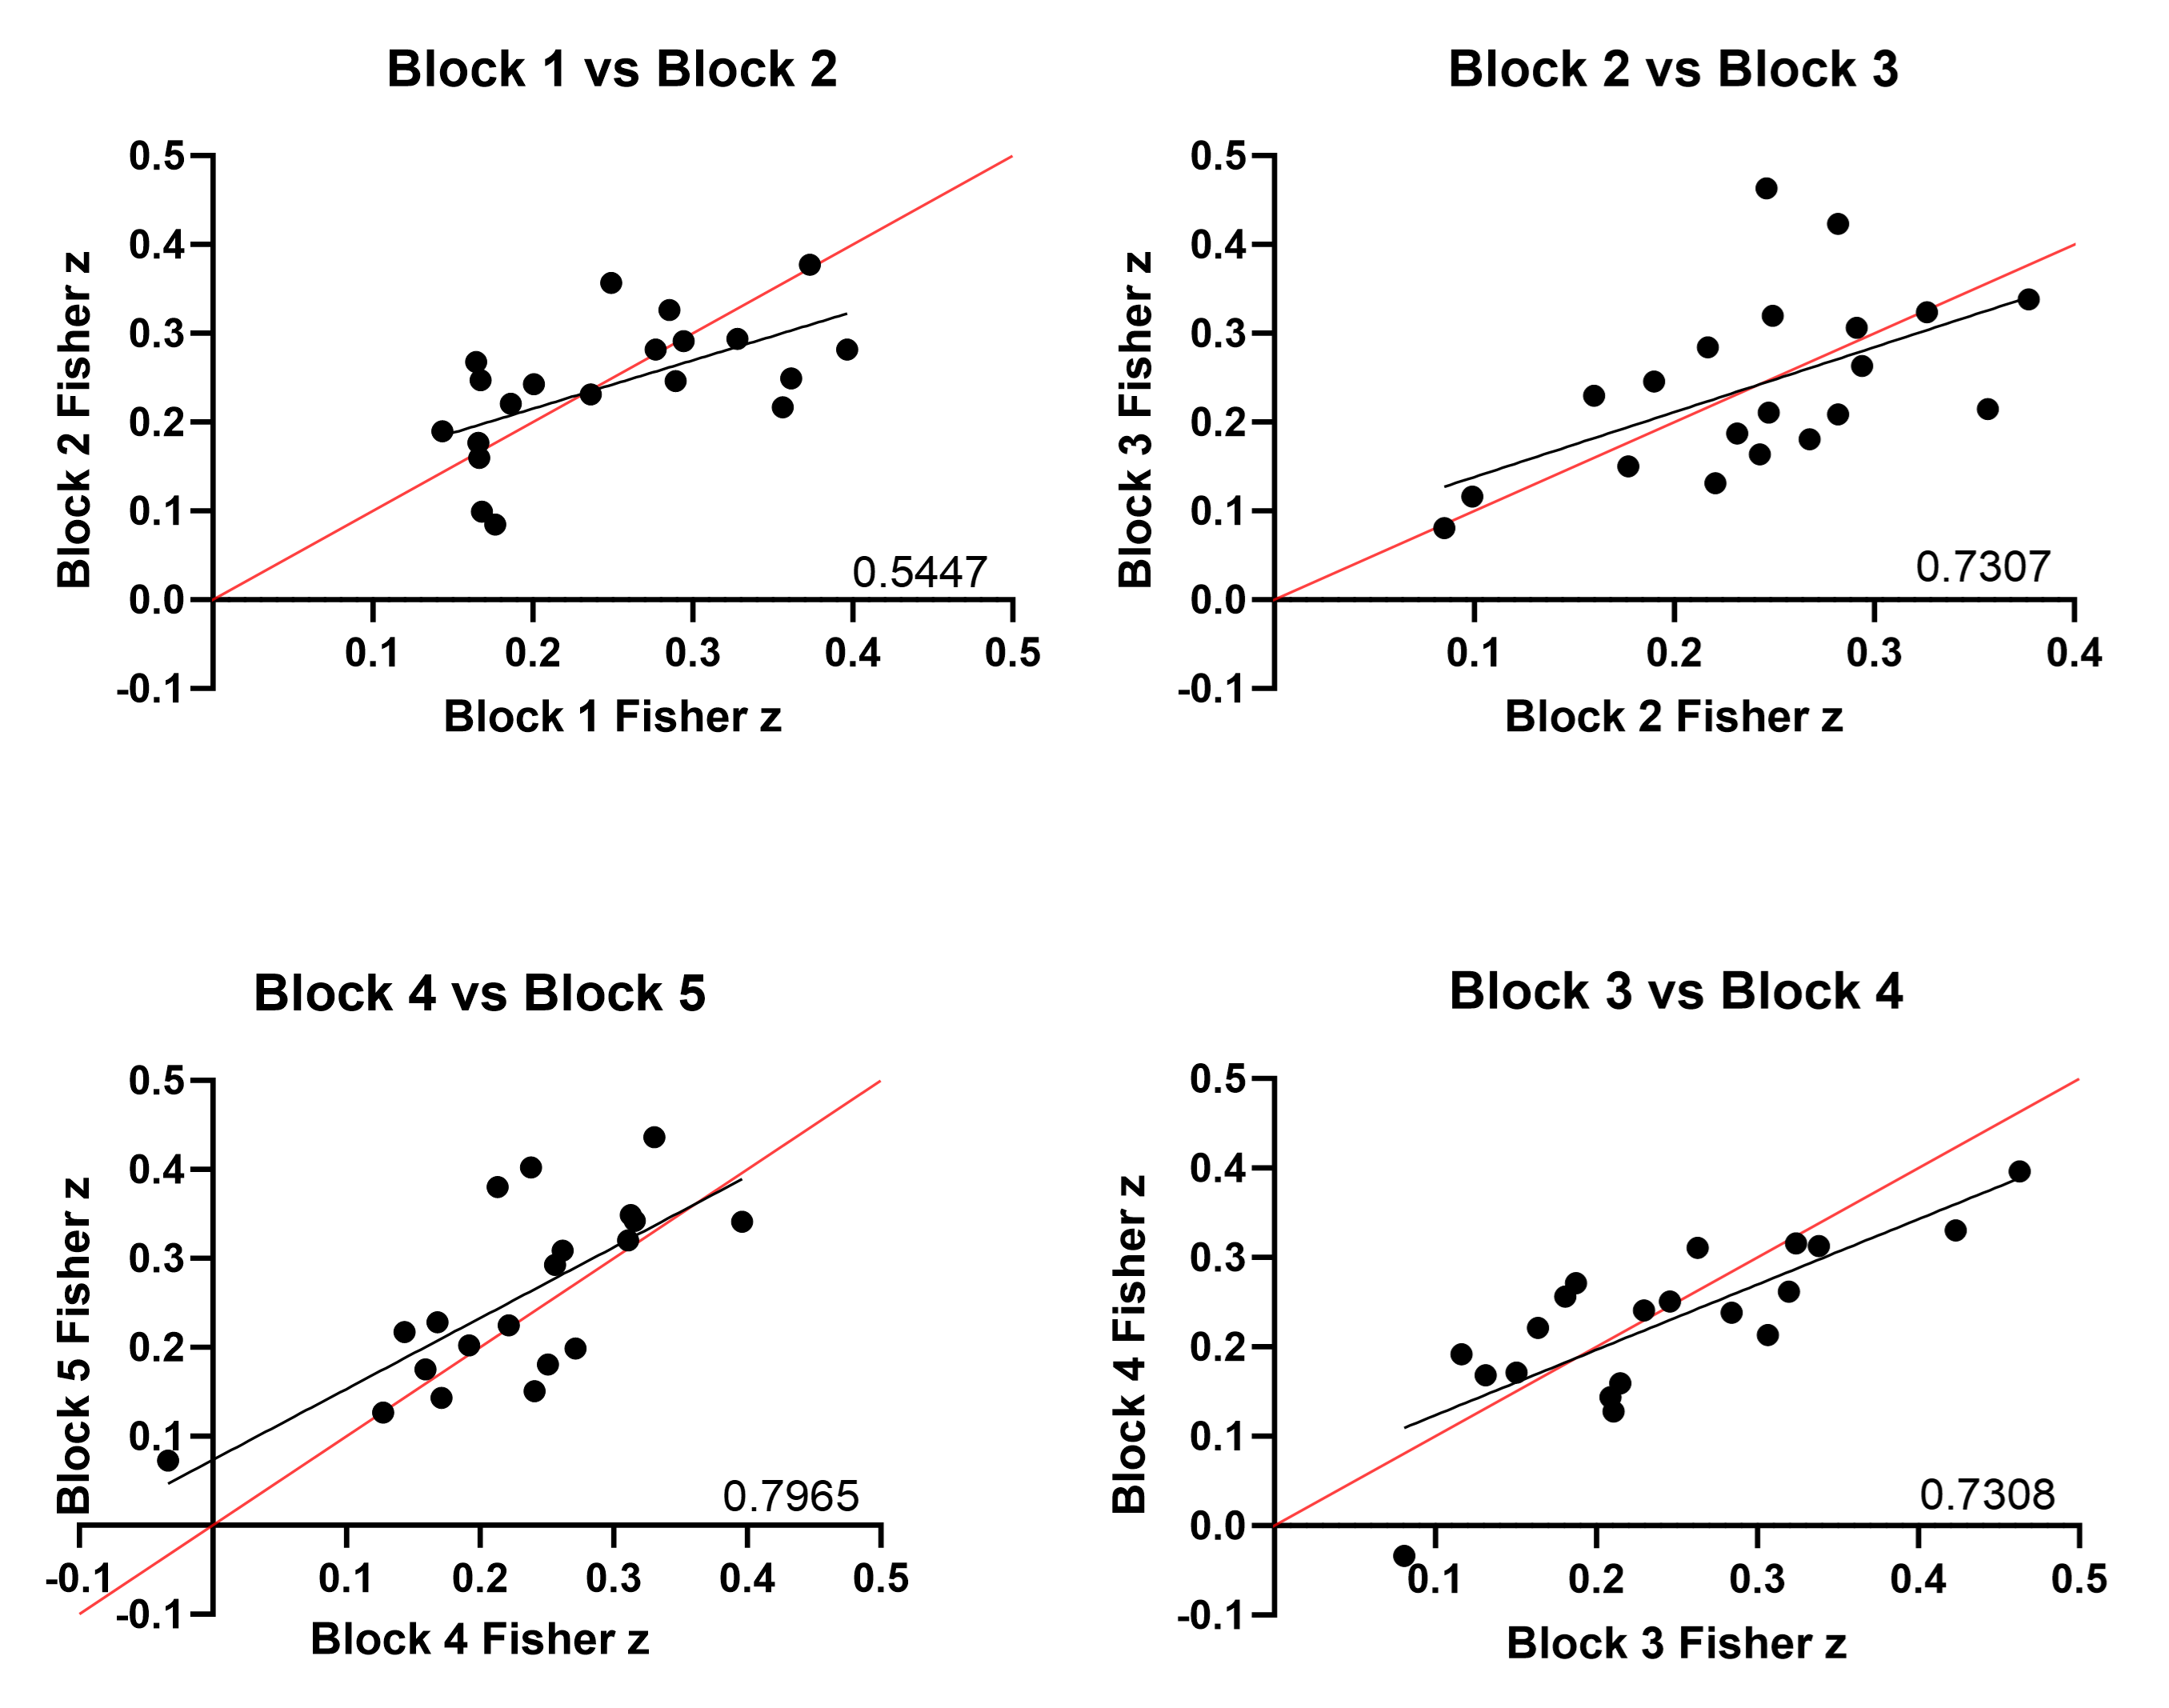
As shown in Fig. 2, we found a statistically significant average Pearson’s correlation between ReHo and CBF in all time blocks (r = 0.25 ± 0.08, 0.24 ± 0.08, 0.24 ± 0.1, 0.23 ± 0.09, 0.25 ± 0.1 respectively, all significantly different from 0 with p<0.001 one-sample t-test). The value of the spatial correlation remained stable over the five blocks but was slightly higher than that obtained for the whole scan (0.17 ± 0.1, p<0.001), although this difference was not significant.DISCUSSION AND CONCLUSION
Consistently with previous studies1,2, we showed that CBF and ReHo have a modest but significant spatial correlation in the resting brain, which remains stable over time. To the best of our knowledge, this is the first time that the spatial similarity between CBF and ReHo is assessed using simultaneously acquired BOLD and CBF data.Acknowledgements
The European Union - NextGenerationEU under the National Recovery and Resilience Plan (NRRP), Mission 4 Component 2 - M4C2, Investment 1.5 - Call for tender No. 3277 of 30.12.2021 Italian Ministry of Universities Award Number: ECS0000004, Project Title: “Innovation, digitalisation and sustainability for the diffused economy in Central Italy,” Concession Degree No. 1057 of 23.06.2022 adopted by the Italian Ministry of Universities, CUP: D73C22000840006.
Italian Ministry of University and Research, Research Projects of National Relevance (PRIN), Project Code: 2022BERM2F, Project Title: “Mapping Mitochondrial Function and Oxygen Metabolism in the Human Brain with Magnetic Resonance Imaging.” Concession decree No. 1065 of 18. 07.2023 adopted by the Italian Ministry of University and Research, ERC Sector LS7 “Prevention, Diagnosis and Treatment of Human Diseases”.
This project has received funding from the European Union’s Horizon Europe research and innovation programme under the Marie Skłodowska-Curie grant agreement No 101066055 – acronym HERMES. Views and opinions expressed are however those of the author(s) only and do not necessarily reflect those of the European Union or the European Research Executive Agency (REA). Neither the European Union nor the granting authority can be held responsible for them.
The UK EPSRC (ref: EP/S025901/1)
References
1 Deng S., Franklin C. G., O'Boyle M., Zhang W, Heyl BL, Jerabek PA, Lu H, Fox PT, 2022. Hemodynamic and metabolic correspondence of resting-state voxel-based physiological metrics in healthy adults. NeuroImage, Volume 250, doi: 10.1016/j.neuroimage.2022.118923.
2 Zang Y, Jiang T, Lu Y, He Y, Tian L, 2004. Regional homogeneity approach to fMRI data analysis. Neuroimage 22, 394–400.
3 Li Z, Zhu Y, Childress AR, Detre JA, Wang Z, 2012b. Relations between BOLD fMRI-derived resting brain activity and cerebral blood flow. PLoS One 7, e44556.
4 Okell TW, Chappell MA, Kelly ME, Jezzard P. Cerebral blood flow quantification using vessel-encoded arterial spin labeling. J Cereb Blood Flow Metab. 2013 Nov;33(11):1716-24. doi: 10.1038/jcbfm.2013.129.
5 Schmithorst VJ, Hernandez-Garcia L, Vannest J, Rajagopal A, Lee G, Holland SK. Optimized simultaneous ASL and BOLD functional imaging of the whole brain. J Magn Reson Imaging. 2014 May;39(5):1104-17. doi: 10.1002/jmri.24273.
6 Germuska M, Chandler HL, Stickland RC, Foster C, Fasano F, Okell TW, Steventon J, Tomassini V, Murphy K, Wise RG. Dual-calibrated fMRI measurement of absolute cerebral metabolic rate of oxygen consumption and effective oxygen diffusivity. Neuroimage. 2019 Jan 1;184:717-728. doi: 10.1016/j.neuroimage.2018.09.035.
7 Tustison NJ, Cook PA, Holbrook AJ, Johnson HJ, Muschelli J, Devenyi GA, Duda JT, Das SR, Cullen NC, Gillen DL, Yassa MA, Stone JR, Gee JC, AvANTs BB. The ANTs X ecosystem for quantitative biological and medical imaging. Sci Rep. 2021 Apr 27;11(1):9068. doi: 10.1038/s41598-021-87564-6.
8 Smith SM, 2022. Fast robust automated brain extraction. Human Brain Mapping, 17(3):143-155.
9 Evans AC, Collins DL, Mills SR, Brown ED, Kelly RL and Peters TM, "3D statistical neuroanatomical models from 305 MRI volumes," 1993 IEEE Conference Record Nuclear Science Symposium and Medical Imaging Conference, San Francisco, CA, USA, 1993, pp. 1813-1817 vol.3, doi: 10.1109/NSSMIC.1993.373602.
10 Zhang, Y. and Brady, M. and Smith, S. Segmentation of brain MR images through a hidden Markov random field model and the expectation-maximization algorithm. IEEE Trans Med Imag, 20(1):45-57, 2001.
11 Woolrich MW, Jbabdi S, Patenaude B, Chappell M, Makni S, Behrens T, Beckmann C, Jenkinson M, Smith SM, 2009. Bayesian analysis of neuroimaging data in FSL. NeuroImage, 45:S173-86. 12 Cox RW, 1996. AFNI: software for analysis and visualization of functional magnetic resonance neuroimages. Comput Biomed Res 29(3):162-173. doi:10.1006/cbmr.1996.0014
13 Alsop DC, Detre JA, Golay X, Günther M, Hendrikse J, Hernandez-Garcia L, Lu H, MacIntosh BJ, Parkes LM, Smits M, van Osch MJ, Wang DJ, Wong EC, Zaharchuk G, 2015. Recommended implementation of arterial spin-labeled perfusion MRI for clinical applications: A consensus of the ISMRM perfusion study group and the European consortium for ASL in dementia. Magn Reson Med. doi: 10.1002/mrm.25197. Epub 2014 Apr 8. PMID: 24715426; PMCID: PMC4190138.
14 Yan CG, Wang XD, Zuo XN, Zang YF, 2016. DPABI: Data Processing & Analysis for (Resting-State) Brain Imaging. Neuroinformatics 14, 339-351. doi: 10.1007/s12021-016-9299-4.
Figures