3151
Frequency-Domain Machine Learning Estimation of Maximum BOLD Modulation and Grey Matter Oxygen Consumption with Resting-State BOLD-ASL fMRI1Department of Neuroscience, Imaging and Clinical Sciences, University G. D'Annunzio of Chieti Pescara, Chieti Scalo, Italy, 2Cardiff University Brain Research Imaging Centre (CUBRIC), Cardiff University, Cardiff, United Kingdom, 3Department of Medical Sciences and Surgery, University of Catanzaro, Catanzaro, Italy
Synopsis
Keywords: fMRI Analysis, fMRI (resting state), Brain Oxygen Consumption, Neural Network
Motivation: Calibrated BOLD-arterial spin labelling (ASL) fMRI exploits isometabolic hypercapnic changes of brain physiology to map grey matter maximum BOLD modulation (M) and, through biophysical modelling, estimate the oxygen extraction fraction and the cerebral metabolic rate of oxygen. However, this approach requires a CO2 gas-challenge or breath-holding, limiting its clinical application.
Goal(s): It would be ideal to estimate M from low SNR, non-isometabolic resting-state (RS) BOLD-ASL fluctuations.
Approach: We investigate the ability of a frequency-domain, data-driven, neural network approach to estimate the physiological parameters of interest from RS data in comparison to a breath-hold approach.
Results: The proposed approach can map the desired parameters.
Impact: The ability to map oxygen consumption in the grey matter through resting state data using a calibrated fMRI framework would allow a simple implementation of such an approach in research settings paving the way to its utilization in clinical practice.
Introduction
Calibrated BOLD-ASL fMRI can map the maximum BOLD modulation (M) through BOLD and CBF changes during an isometabolic hypercapnic (CO2) or hyperoxic (O2) stimulus1. M can be used to evaluate fractional changes in oxygen extraction fraction (OEF) and cerebral metabolic rate of oxygen (CMRO2)2. We have developed an approach that, by integrating the Davis Model of BOLD with a biophysical model of oxygen transport, uses a hypercapnia-based measure of M to quantify OEF and CMRO23,4. This approach still requires a gas challenge or breath-holding (BH), limiting its applicability. It would be ideal to estimate M from resting-state (RS) data. However, the low SNR of ASL and the coupled modulation of RS brain metabolism and CBF at rest decrease the BOLD-CBF change ratio, hampering the estimation of M through time-domain modelling5,6.We here investigate the feasibility of using a frequency-domain data-driven approach to estimate M. The approach is implemented assuming a denoising effect of spectral analysis and a structured spectral dependance of the flow-metabolism coupling (e.g., frequencies where isometabolism can be approximated). M is then used to infer OEF and CMRO2 from modelling.
Methods
19 healthy volunteers (age: 27.5±3.8years; 10F/9M) underwent BH and RS fMRI. Data were acquired on a Siemens Prisma 3T scanner using a 32-channel head-coil. BOLD-ASL fMRI was acquired using pCASL with DEXI readout7 (τ and PLD=1.5s, GRAPPA=3, TE1/ TE2=10/30ms). A TR of 4.4s was implemented to record 15 slices (7mm thickness, 20% gap, 64x64 matrix and 3.4mm resolution). 122 and 140 volumes were acquired for BH and RS. An ASL calibration (M0) was recorded. Blood hemoglobin was estimated through measures of the blood T18 using a sequence with a nonselective inversion pulse followed by fast (TR/TE=150/22ms) acquisitions of a single slice (EPI-readout, 3mm slice thickness, 128x128 matrix, 1.8mm resolution) acquired for 6 seconds and intersecting the superior sagittal sinus (SSS, 16 inversions). The short TR highlighted the magnetization recovery of the inflowing blood. MPRAGE was acquired (1mm resolution, TR/TE = 2100/3.24ms). Finally, a measure of OEF in the SSS was performed using TRUST9. Expired CO2 and O2 traces were recorded using a nasal cannula and a gas analyser (AD Instruments).MRI data were pre-processed using FSL10 with motion-correction, segmentation and co-registration to M0. Further analysis was performed in Matlab. TE1 surround subtractions were converted into CBF through the single compartment kinetic model11. BOLD signal was estimated using TE2 2-points moving-average. BH-fMRI signals and end-tidal CO2 (EtCO2) were band-pass filtered (0.01Hz-0.1Hz). CO2 was used as regressor (10s lag allowed) to estimate BOLD-ASL hypercapnic modulations and infer M. BOLD-ASL amplitude and phase spectra were computed (32-points FFT). A neural network (NN, 10 neurons, sigmoid activations, 1 output regression layer) was trained to predict voxelwise BH-M relying on RS average CBF, EtCO2, EtO2, hemoglobin concentrations and ASL-BOLD spectra. A Levenberg-Marquardt training algorithm was implemented with a stopping criterion based on the validation performance. Data with a sufficient SNR were fed to the NN (BH-BOLD-ASL SNR>8, RS-BOLD-ASL tSNR>1.5). The generalization was evaluated on the test set in an iterative manner (training, validation and test set: 70%-15%-15%). OEF and CMRO2 were computed through modelling3.
Results
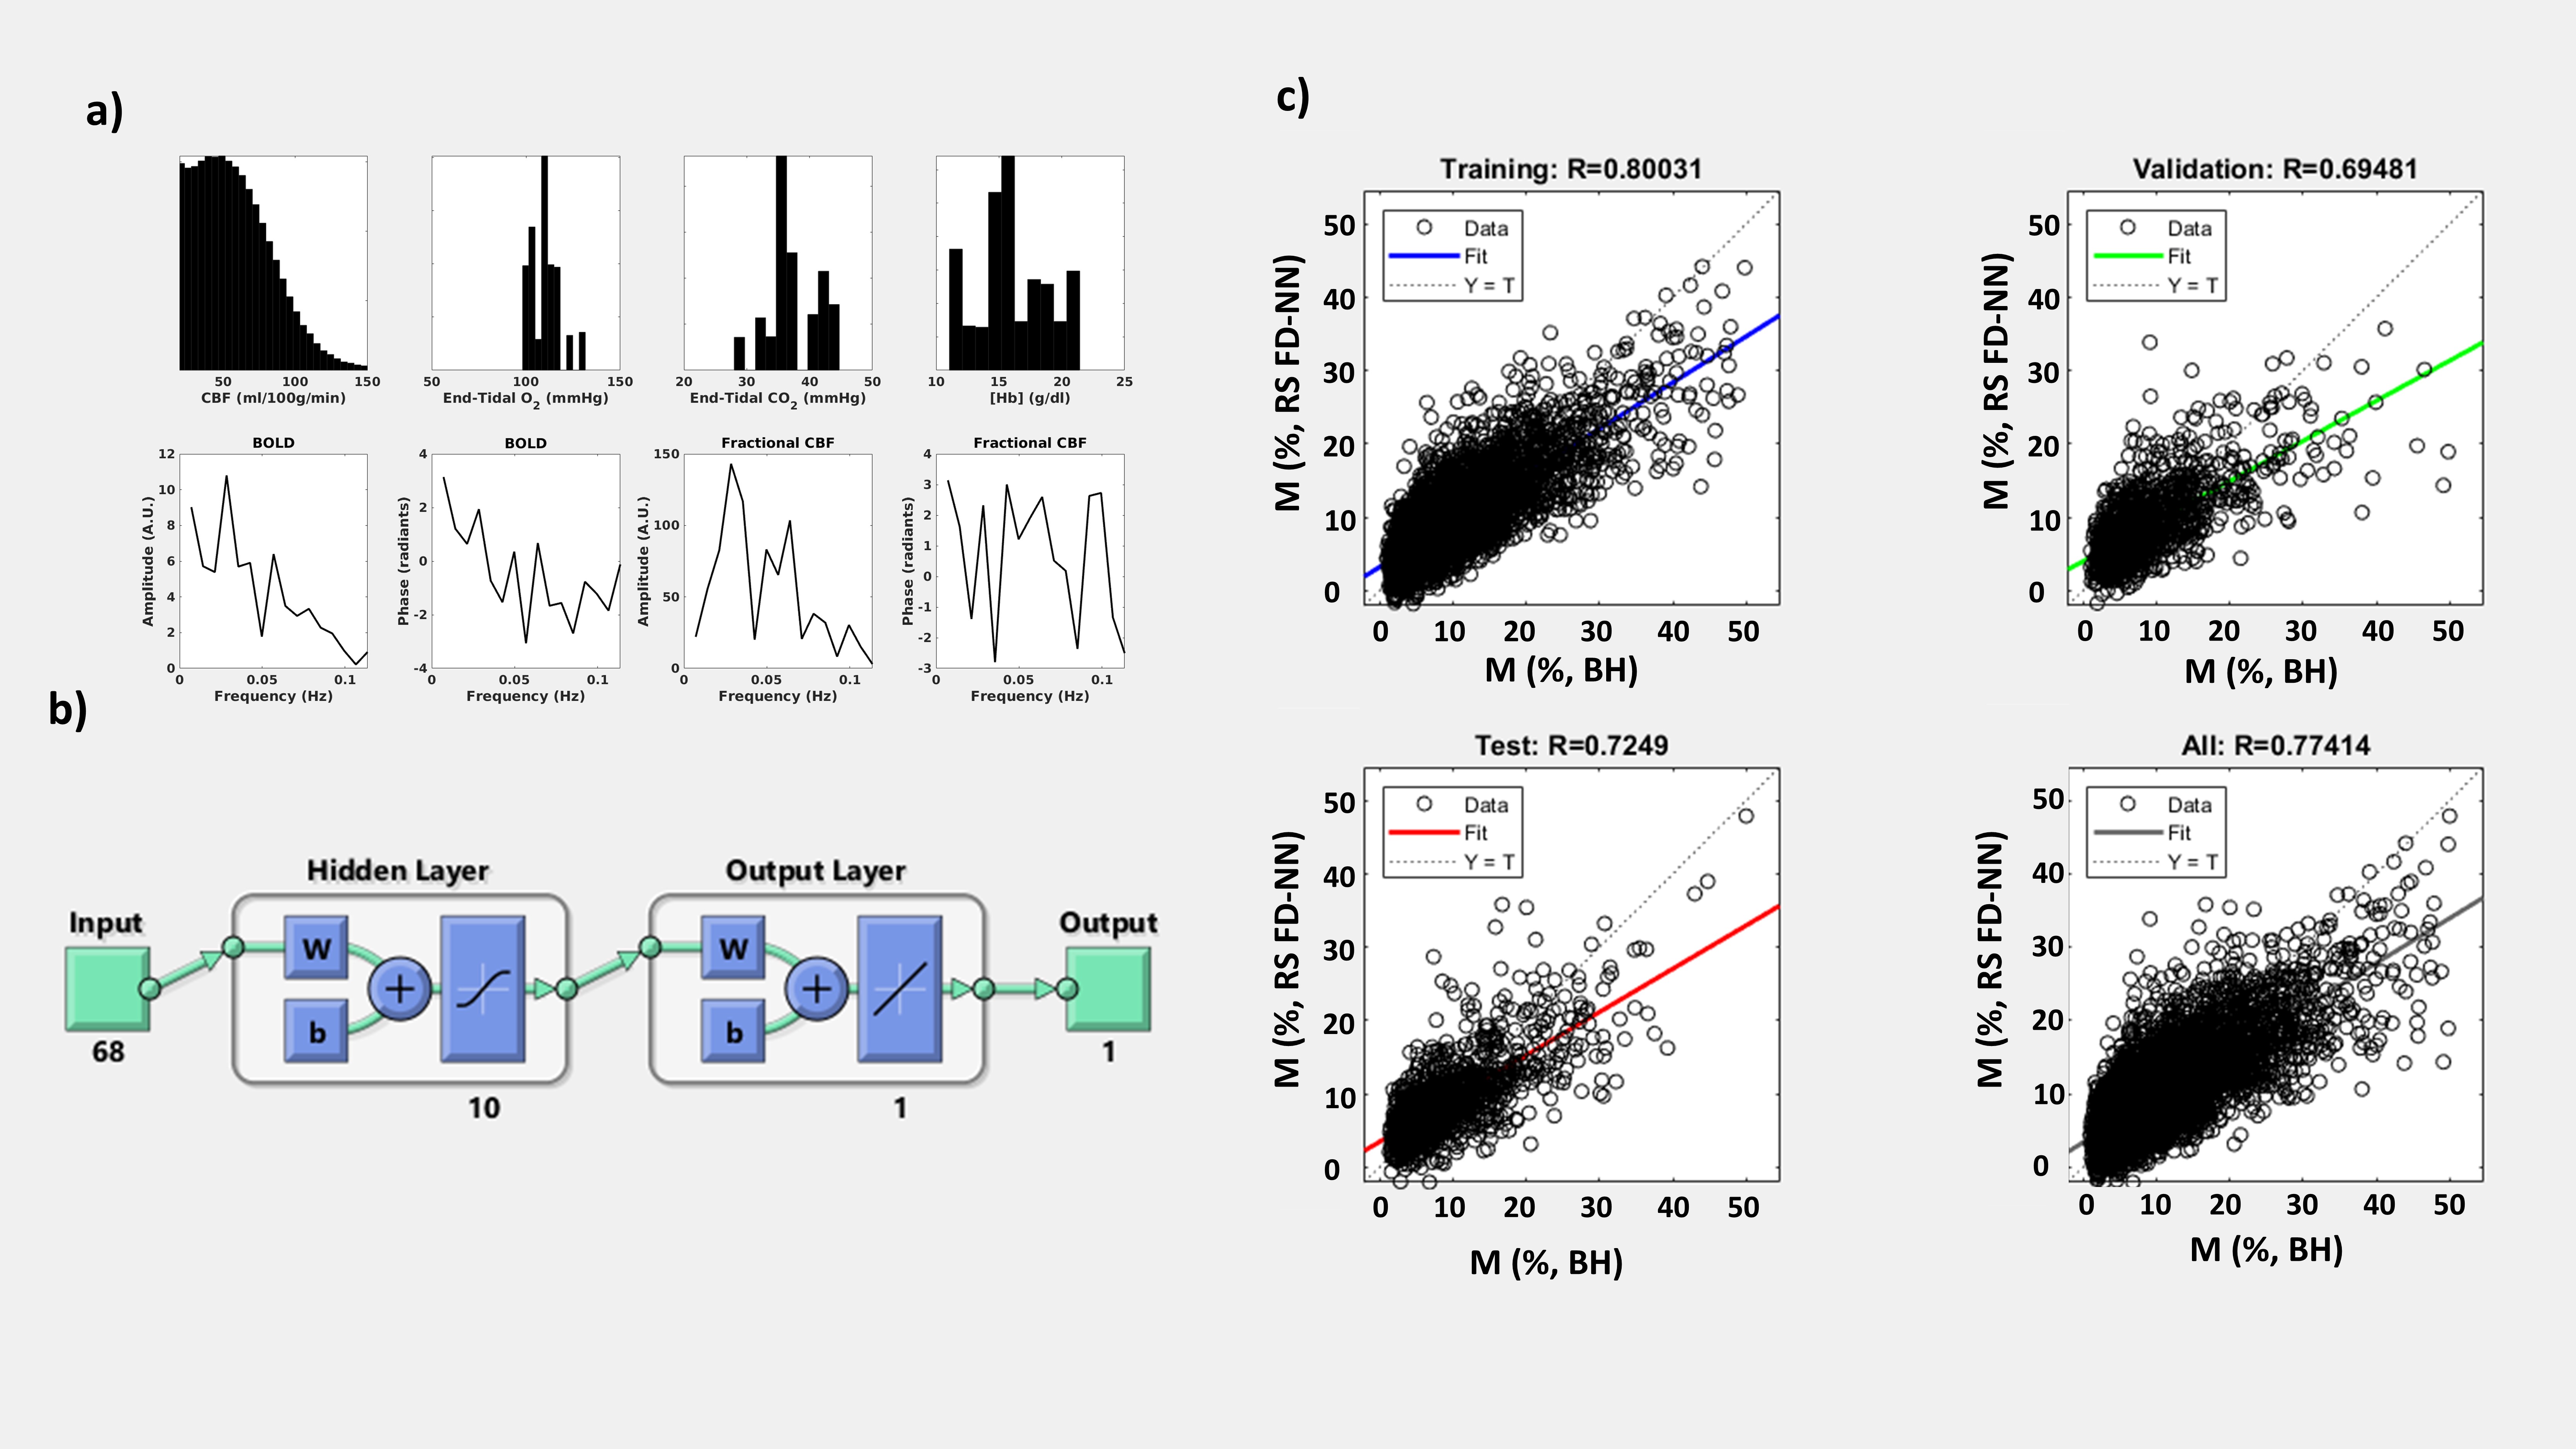
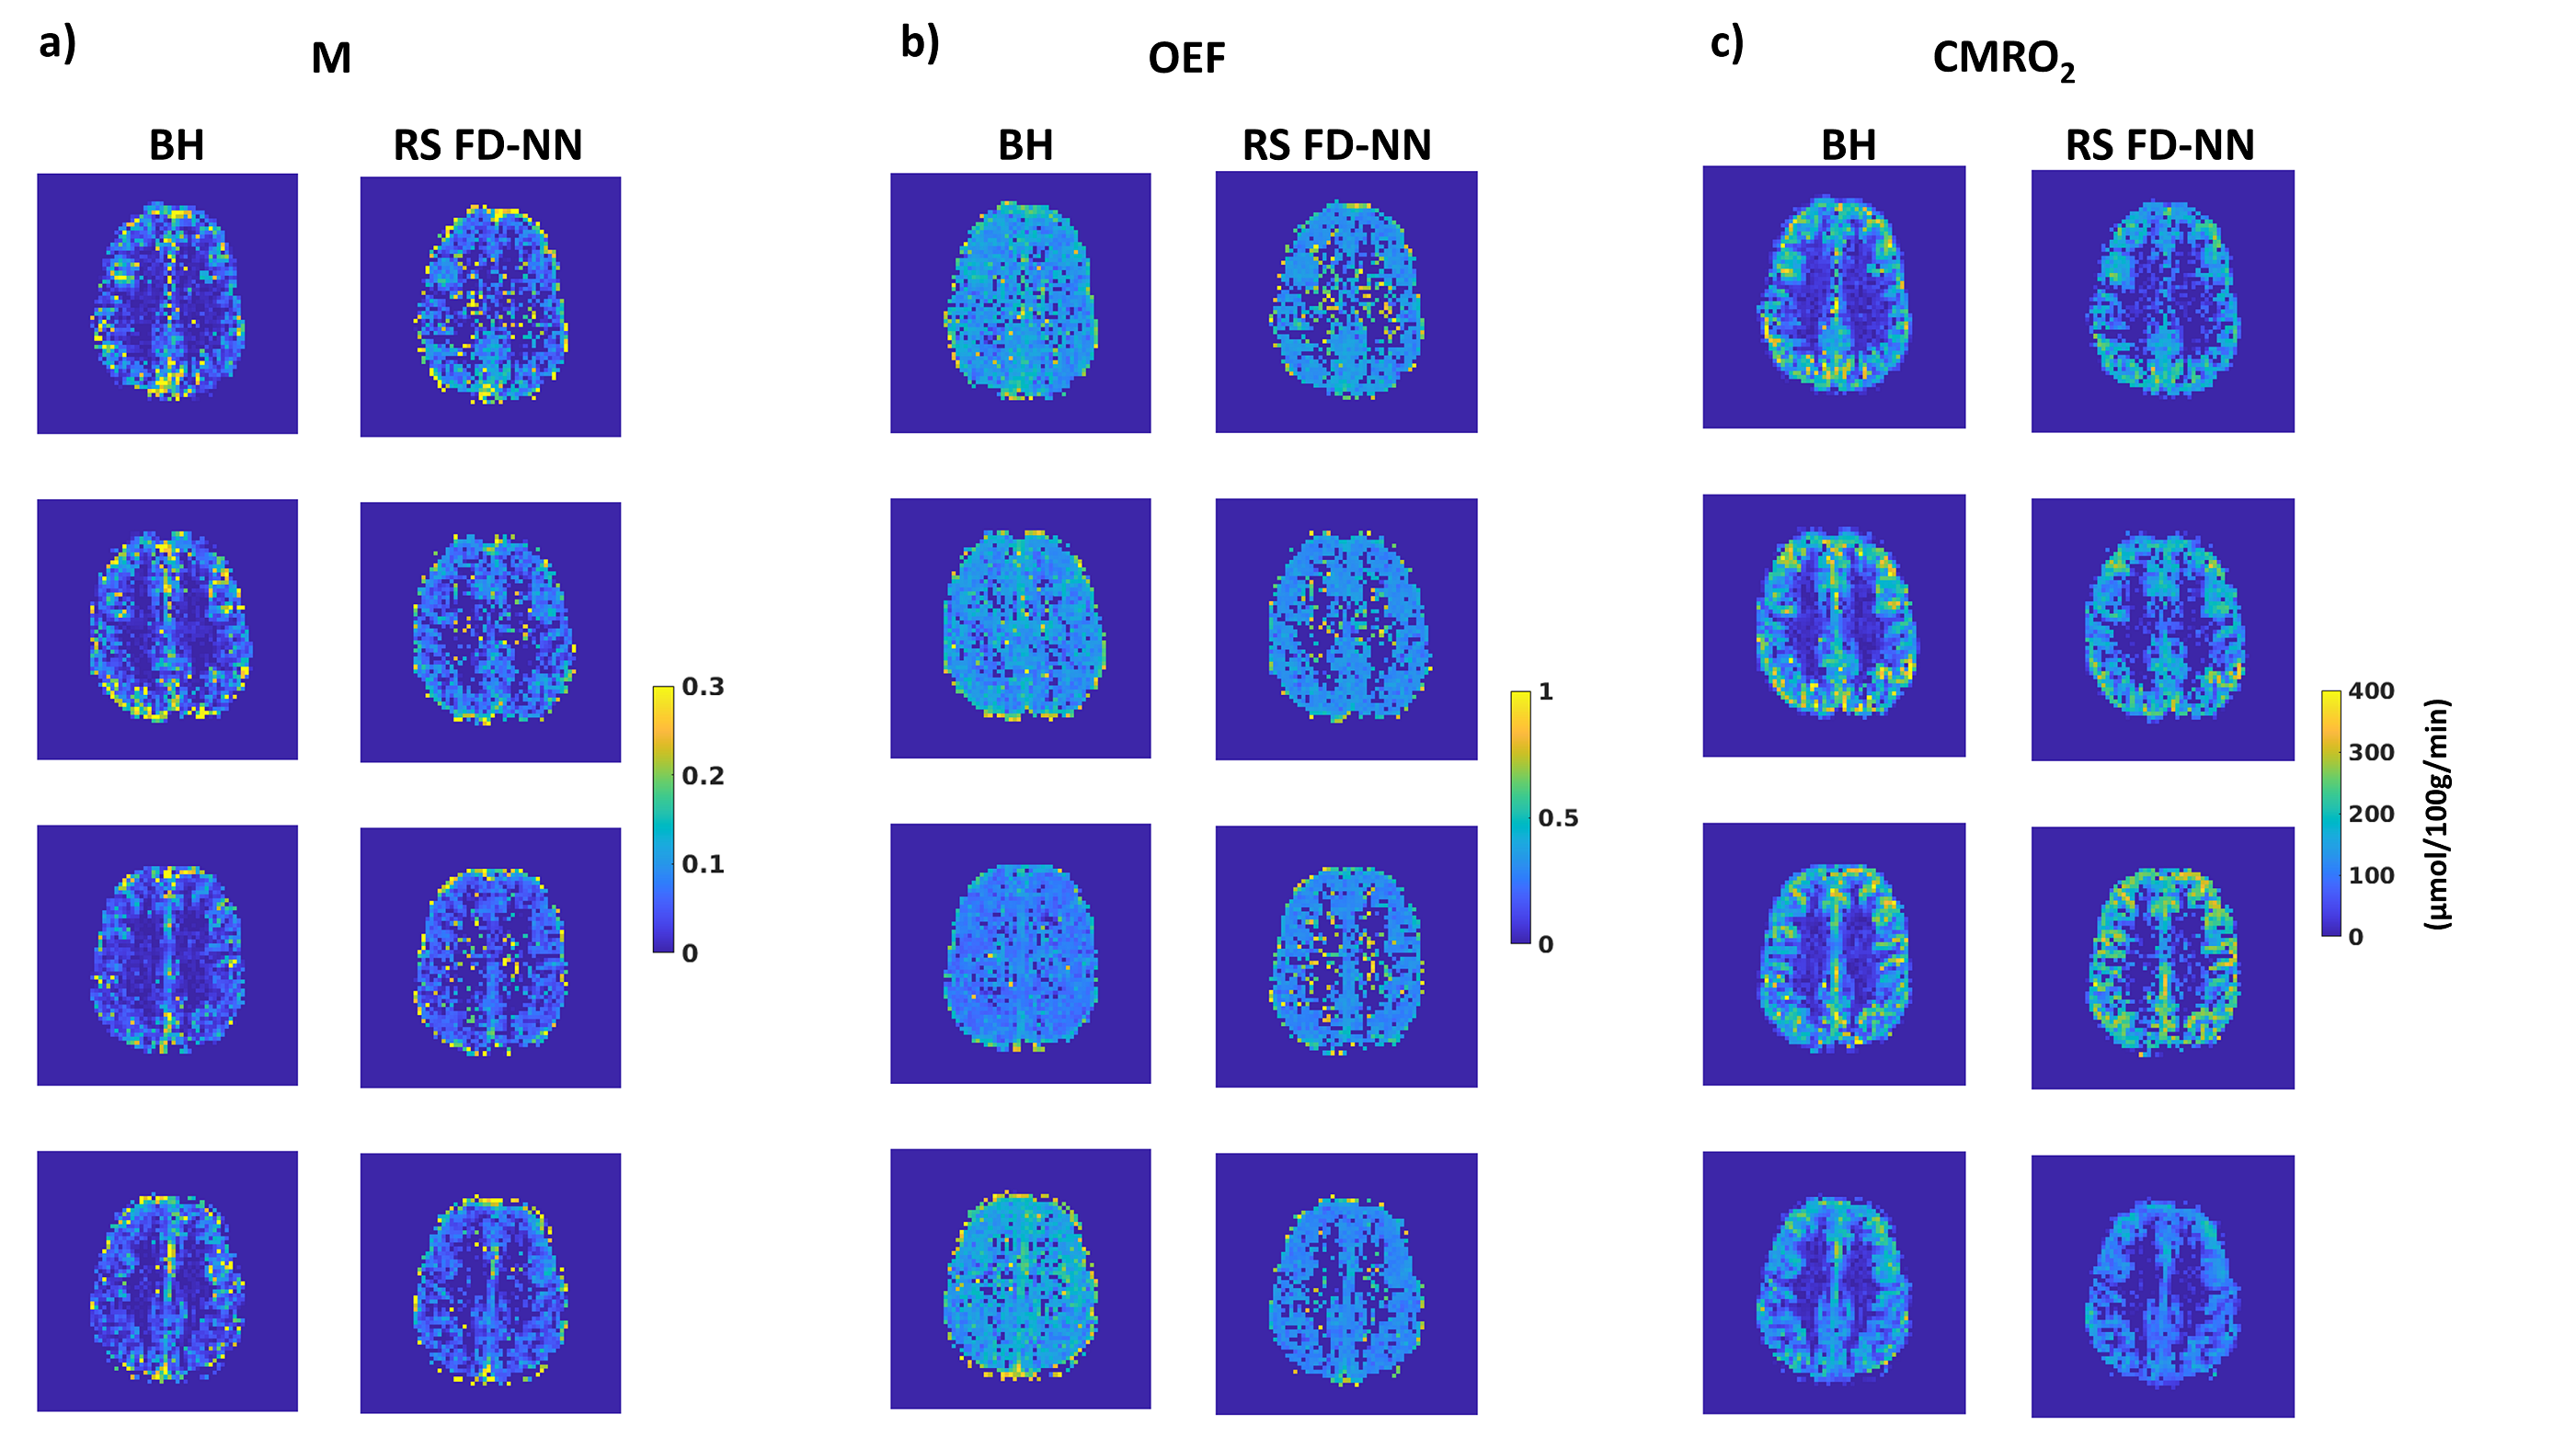
Figure 1a shows the NN inputs: the upper row reports the distribution of CBF, EtO2, EtCO2 and hemoglobin in blood. The lower row reports examples of BOLD and ASL spectra. Figure 1b and c report the NN architecture and the training performance, respectively.Figure 2a,b,c reports examples of M, OEF and CMRO2 maps obtained with BH and the RS frequency domain-neural network (RS FD-NN) approach.
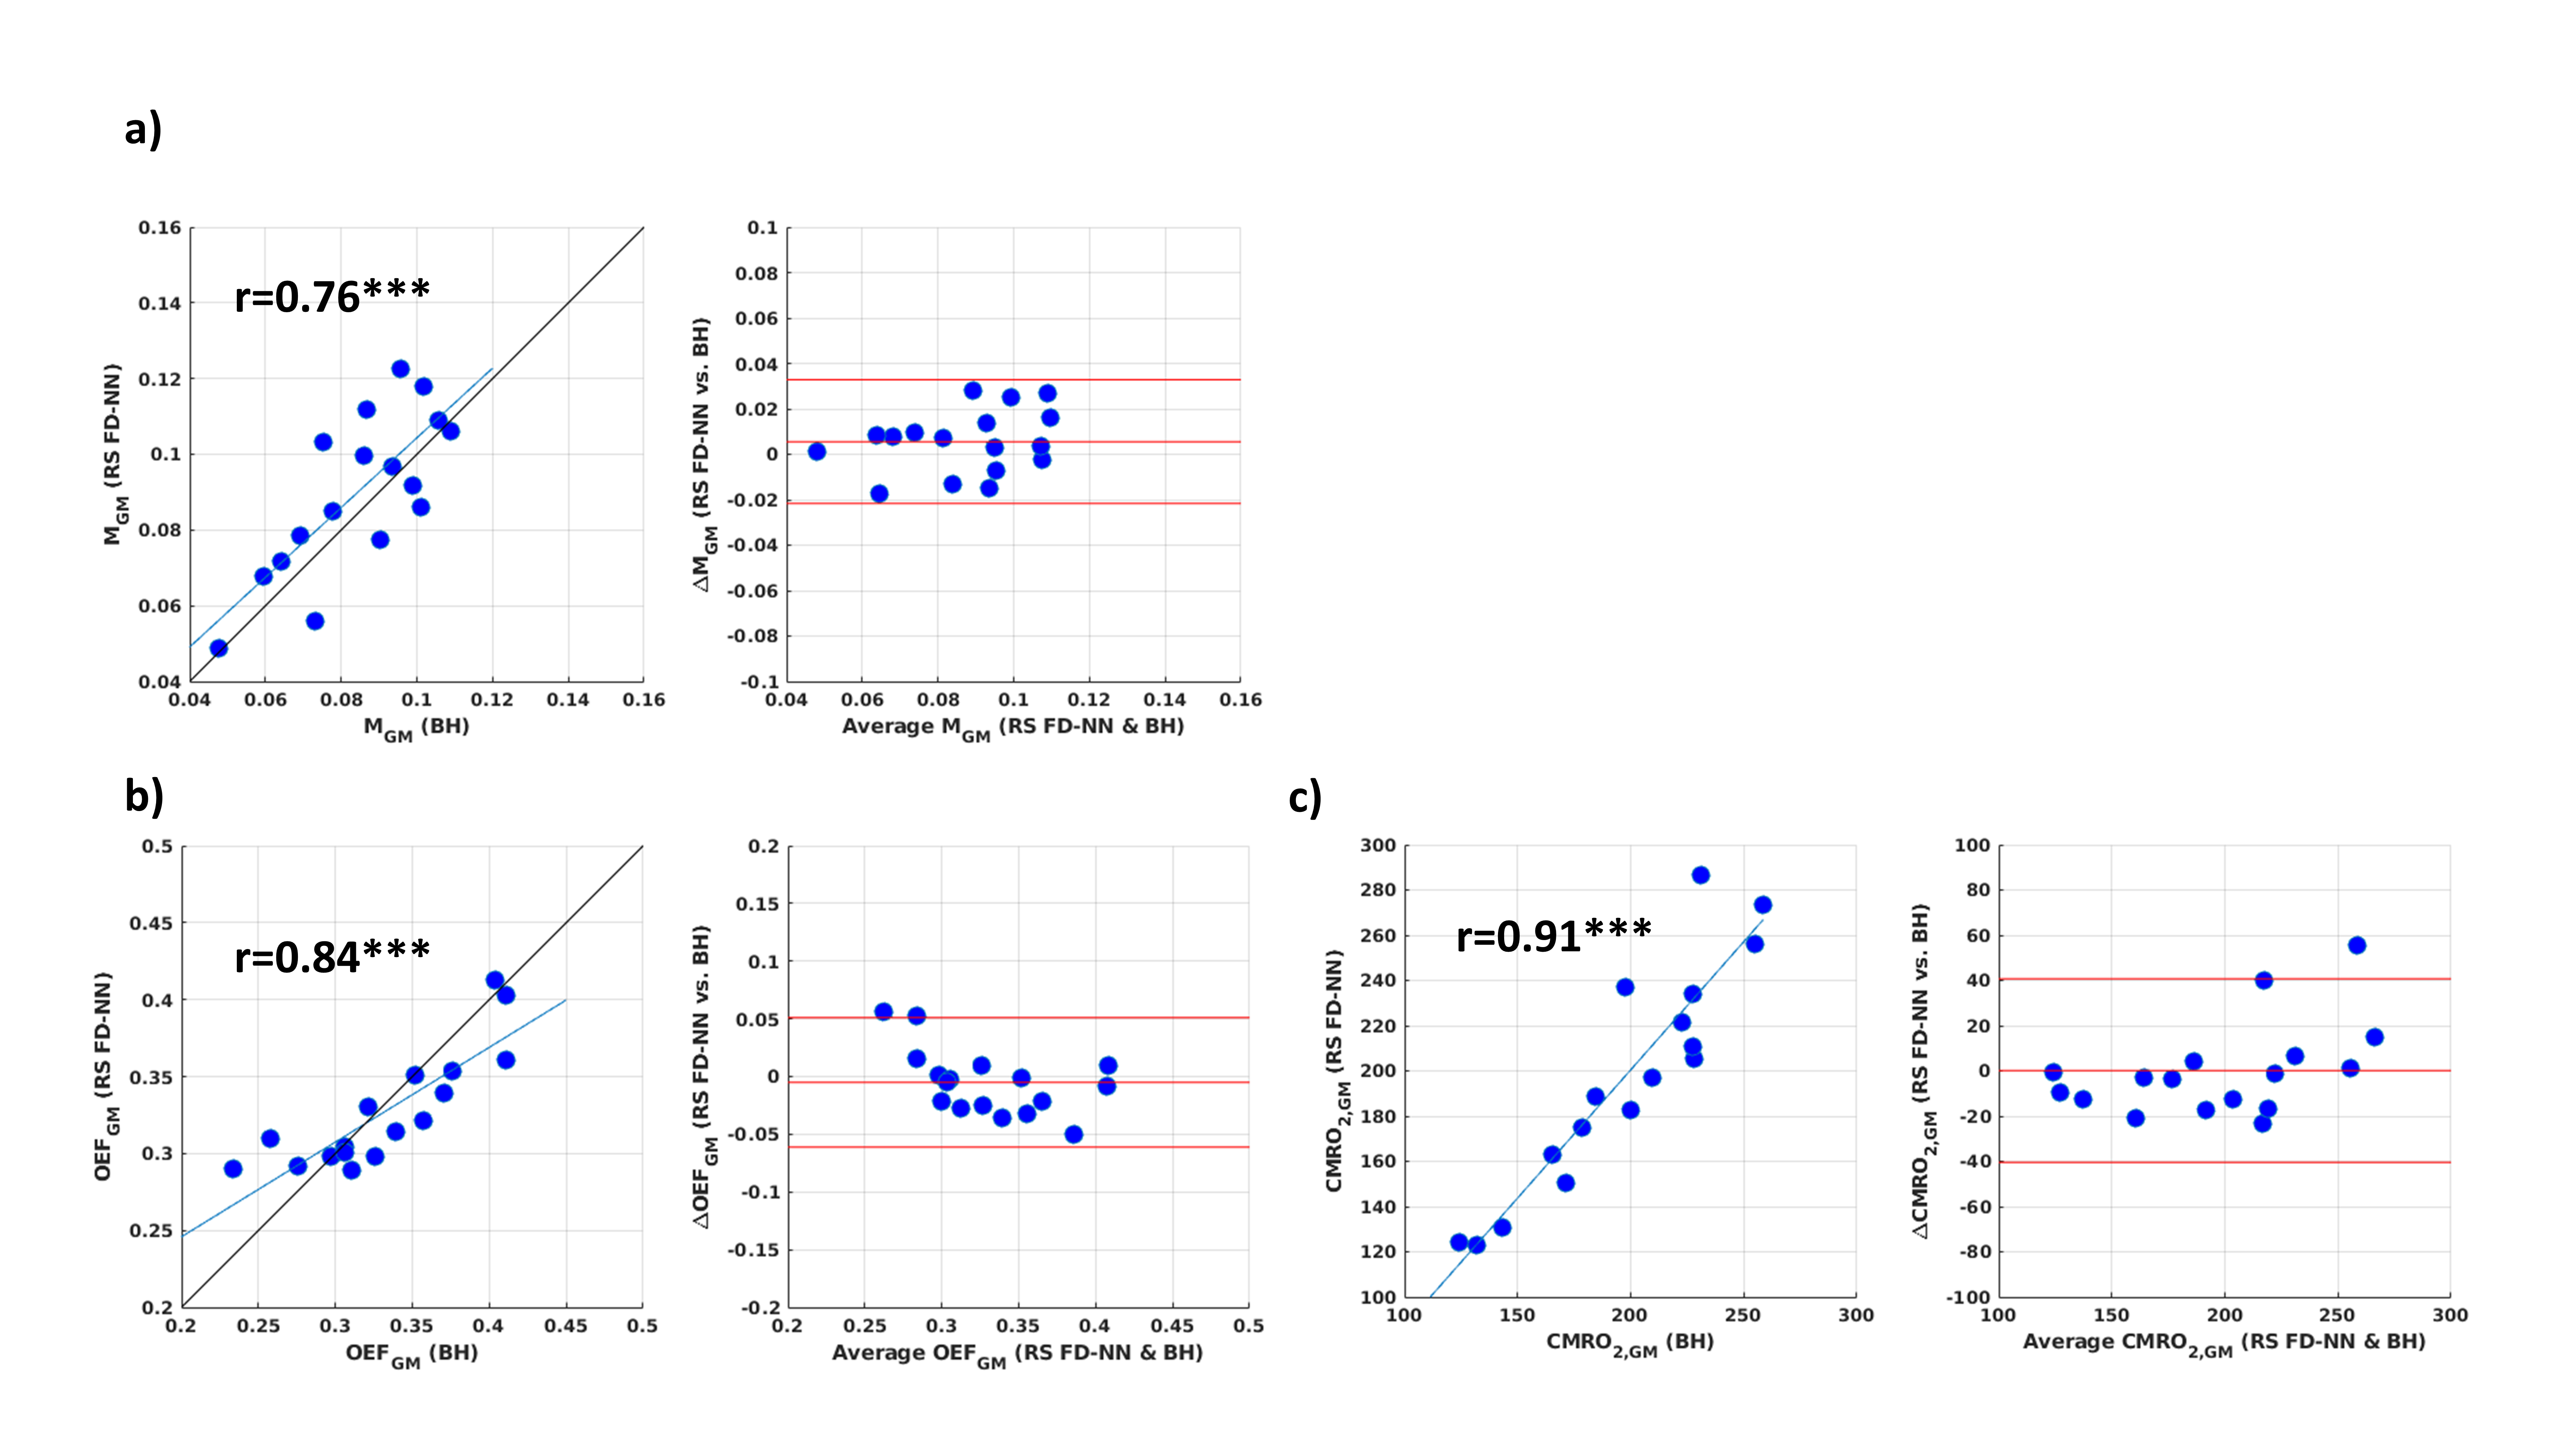
Figure 3a,b,c reports the scatter and Bland-Altmann plots comparing the average grey matter M, OEF and CMRO2 obtained with BH and RS FD-NN. The correlation were high (r=0.76, r=0.84, and r=0.91, all p’s<10-3) with no bias.
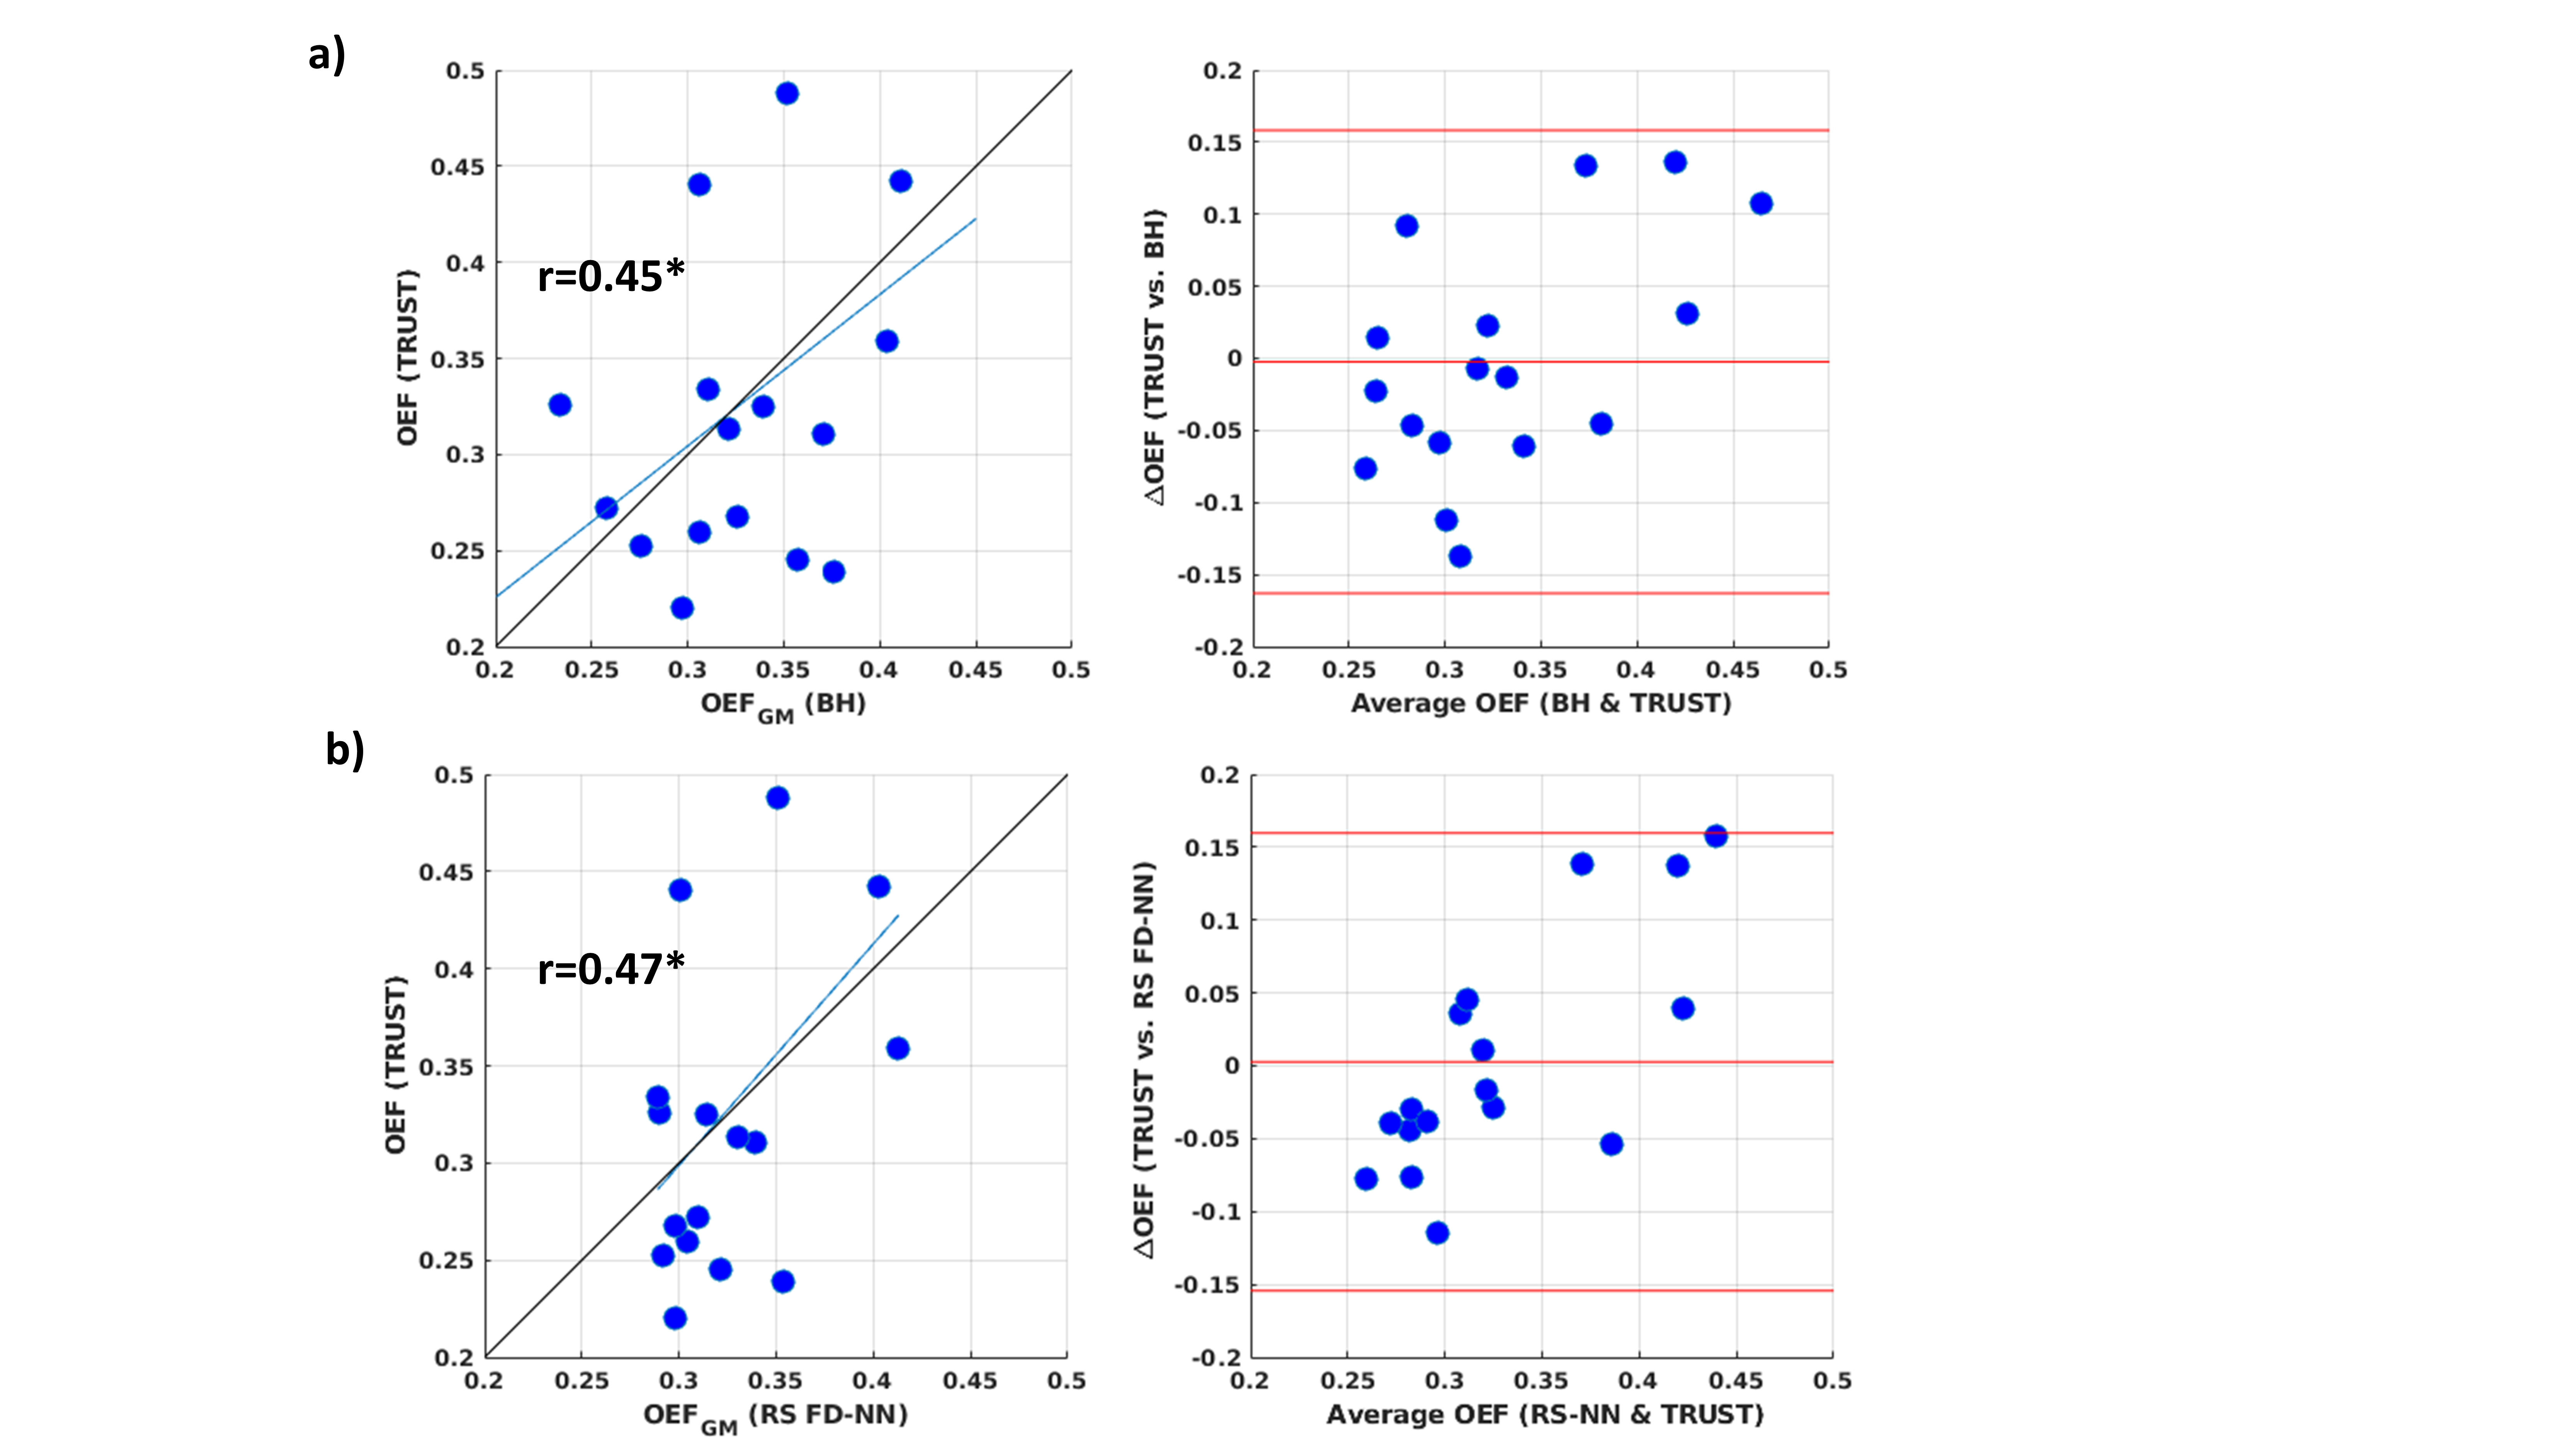
Figure 4a,b reports the scatter and Bland-Altmann plots comparing the grey matter OEF for BH and RS FD-NN with the global OEF obtained for TRUST. The correlations were significant (r=0.45 and r=0.47, both p’s<0.05) with no bias.
Discussion and Conclusion
Results suggest that the RS evaluation of M, OEF and CMRO2 using a FD-NN approach is feasible. Of note, the generalization of the NN was found to depend on the sample numerosity and the data SNR. Further investigation is warranted to improve the approach performance, through larger training sets and experiments with higher SNR (e.g., M for training obtained using gas challenges). The approach should be tested on diseases, where larger variability in the RS flow-metabolism coupling might affect the method performance. The simplified approach holds promise for clinical application.Acknowledgements
Funded by:
European Union – NextGenerationEU under the National Recovery and Resilience Plan (NRRP), Mission 4 Component 2 – M4C2, Investment 1.5 – Call for tender No. 3277 of 30.12.2021 Italian Ministry of Universities Award Number: ECS0000004, Project Title: “Innovation, digitalization and sustainability for the diffused economy in Central Italy,” Concession Decree No. 1057 of 23.06.2022 adopted by the Italian Ministry of University and Research , CUP: D73C2200084000
Italian Ministry of University and Research, Research Projects of National Relevance (PRIN), Project Code: 2022BERM2F, Project Title: “Mapping Mitochondrial Function and Oxygen Metabolism in the Human Brain with Magnetic Resonance Imaging.” Concession decree No. 1065 of 18. 07.2023 adopted by the Italian Ministry of University and Research, ERC Sector LS7 “Prevention, Diagnosis and Treatment of Human Diseases”.
European Union’s Horizon Europe research and innovation programme under the Marie Skłodowska-Curie grant agreement No 101066055 – acronym HERMES. Views and opinions expressed are however those of the author(s) only and do not necessarily reflect those of the European Union or the European Research Executive Agency (REA). Neither the European Union nor the granting authority can be held responsible for them.
References
1 Hoge RD. Calibrated fMRI. NeuroImage 2012; 62: 930–937.
2 Chen JJ, Uthayakumar B, Hyder F. Mapping oxidative metabolism in the human brain with calibrated fMRI in health and disease. J Cereb Blood Flow Metab 2022; 42: 1139–1162.
3 Chiarelli AM, Germuska M, Chandler H, Stickland R, Patitucci E, Biondetti E et al. A flow-diffusion model of oxygen transport for quantitative mapping of cerebral metabolic rate of oxygen (CMRO2) with single gas calibrated fMRI. J Cereb Blood Flow Metab 2022; 42: 1192–1209.
4 Buxton RB. Introduction to Functional Magnetic Resonance Imaging: Principles and Techniques. Cambridge University Press, 2009.
5 Liu TT. Neurovascular factors in resting-state functional MRI. NeuroImage 2013; 80: 339–348.
6 Chiarelli PA, Bulte DP, Gallichan D, Piechnik SK, Wise R, Jezzard P. Flow-metabolism coupling in human visual, motor, and supplementary motor areas assessed by magnetic resonance imaging. Magn Reson Med 2007; 57: 538–547.
7 Schmithorst VJ, Hernandez-Garcia L, Vannest J, Rajagopal A, Lee G, Holland SK. Optimized Simultaneous ASL and BOLD Functional Imaging of the Whole Brain. J Magn Reson Imaging JMRI 2014; 39: 1104–1117.
8 Lu H, Clingman C, Golay X, van Zijl PCM. Determining the longitudinal relaxation time (T1) of blood at 3.0 Tesla. Magn Reson Med 2004; 52: 679–682.
9 Lu H, Ge Y. Quantitative evaluation of oxygenation in venous vessels using T2-Relaxation-Under-Spin-Tagging MRI. Magn Reson Med 2008; 60: 357–363.
10 Jenkinson M, Beckmann CF, Behrens TEJ, Woolrich MW, Smith SM. FSL. NeuroImage 2012; 62: 782–790.
11 Alsop DC, Detre JA, Golay X, Günther M, Hendrikse J, Hernandez-Garcia L et al. Recommended implementation of arterial spin-labeled perfusion MRI for clinical applications: A consensus of the ISMRM perfusion study group and the European consortium for ASL in dementia. Magn Reson Med 2015; 73: 102–116.
Figures