3150
Altered Voxel-Wise Degree Centrality of Brain Network in Chronic Rhinosinusitis Patients: A Resting-State Functional MRI Study1Xiamen Cardiovascular Hospital of Xiamen University, Xiamen, China, 2Fujian Provincial Key Laboratory of Ophthalmology and Visual Science, Eye Institute of Xiamen University, Xiamen, China, 3Zhongshan Hospital of Xiamen University, Xiamen, China
Synopsis
Keywords: Functional Connectivity, Inflammation
Motivation: Patients with chronic rhinosinusitis (CRS) have an increased risk of emotional and cognitive disorders.
Goal(s): We aim to explore the neural mechanisms in CRS patients using the voxel-wise degree centrality (DC) approach.
Approach: Here we collected resting-state functional MRI data to assess the voxel-wise DC values in patients with CRS.
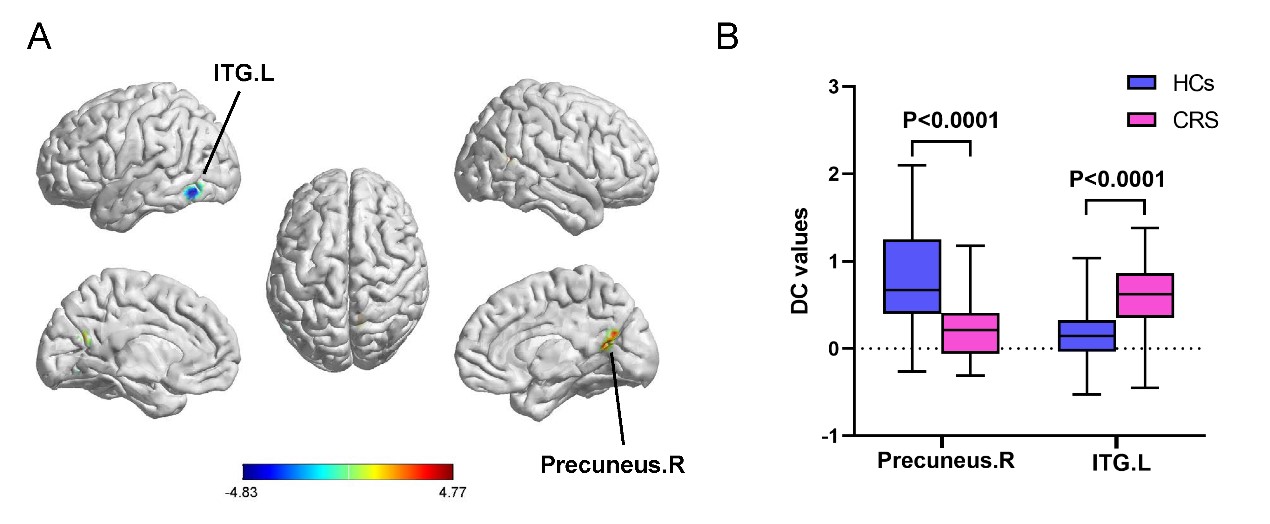
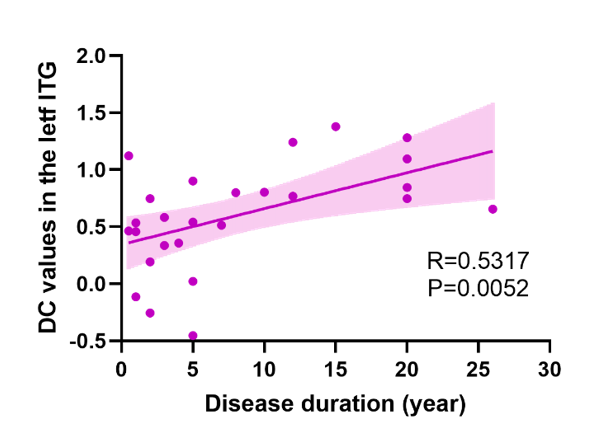
Results: Compared with HCs, CRS patients indicated decreased DC values in the right precuneus and increased DC values in the left inferior temporal gyrus (ITG). In addition, a positive correlation between the DC values in the left inferior temporal gyrus and disease duration was observed.
Impact: CRS patients showed intrinsic abnormal DC values in the right precuneus and the left ITG, both of which are involved in cognitive processing and emotional regulation. These results reveal new insights into the neuropathological mechanisms in CRS patients.
Introduction
Chronic rhinosinusitis (CRS) is a common chronic inflammatory disease with a prevalence of more than 10% worldwide and characterized by symptoms lasting more than 12 weeks 1. The challenge is not only constantly coping with CRS-related symptoms, but also brain-related symptoms, such as cognitive dysfunction, depression and anxiety as recent reports 2-6. But the neural mechanism of CRS-related brain impairments still remains unclear 7-9. Resting-state functional MRI (rs-fMRI) is a non-invasive technology used to detect neural activity and progress has already been made in understanding the brain functions observed in CRS 10,11. Recently, a study investigated the functional connectivity (FC) of brain networks in CRS involved in cognitive processing by independent component analysis 9. Another recent investigation studied brain activity and FC and found increased neural activity in the orbital superior frontal cortex and hypoconnectivity in the precuneus 10. Degree centrality (DC), a network analysis technique based on graph theory, measures the centrality of voxels by counting the temporal correlations between one voxel and the other voxels at the whole-brain level 12. DC analysis contributes to assessing the importance of nodes in the brain network as well as the connectivity strength of each voxel 13,14. It has been widely applied in pathophysiology research for many neurological or psychiatric diseases, such as schizophrenia 15, Parkinson’s disease 16, and anxiety 17. It has also been used in some chronic conditions, including diabetes 18, chronic shoulder pain 19, and irritable bowel syndrome 20. To date, little is known about the resting-state degree centrality in CRS patients. In this study, we hypothesized that the aberrant degree centrality in CRS patients might contribute to brain dysfunction in CRS patients.Methods
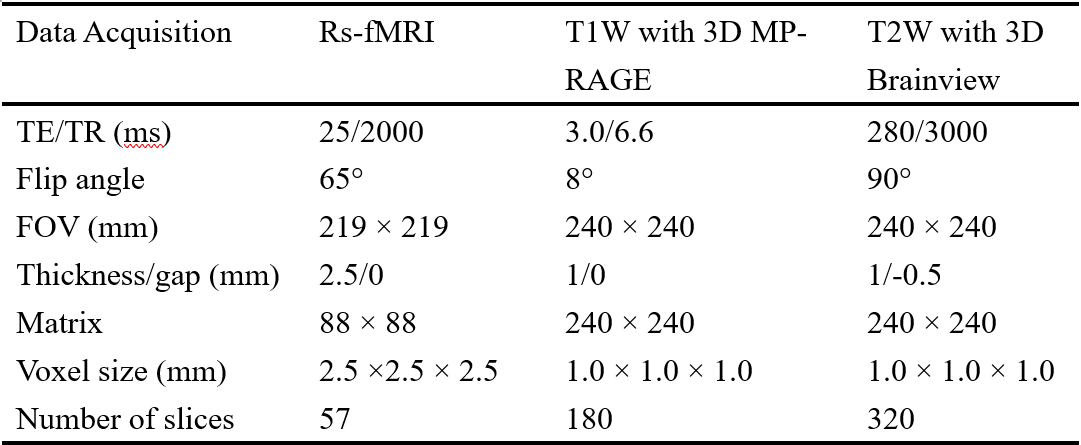
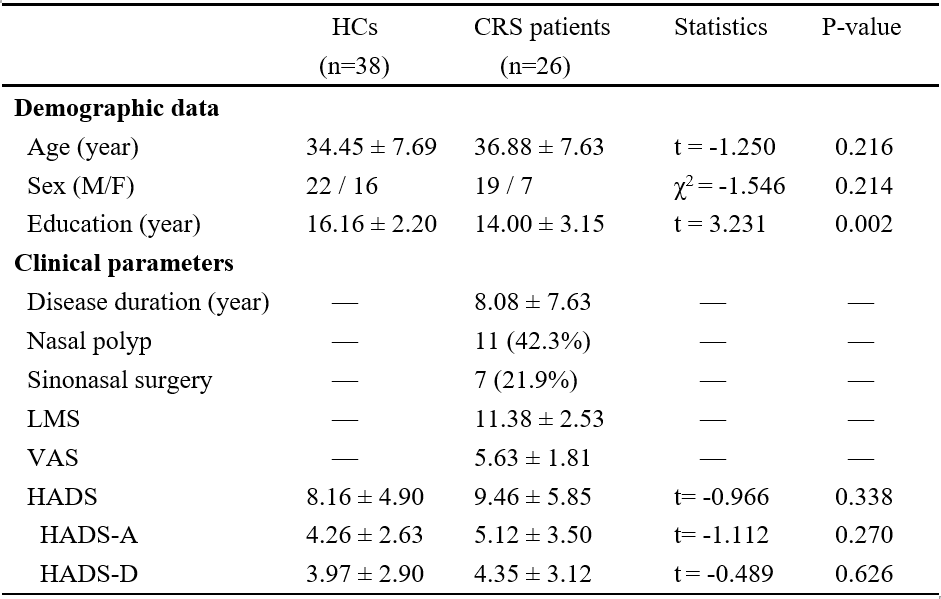
A total of 26 patients with CRS and 38 age and gender-matched healthy control subjects (HCs) were included in this study. The experiment was authorized by the Ethics Committee of Zhongshan Hospital of Xiamen University. Demographic and clinical basic data were collected. The Lund-Mackay score (LMS), the visual analog scale (VAS) score, the hospital anxiety and depression scale (HADS) scores were collected. All data were obtained using the Philips Ingenia 3.0 T CX (Philips Healthcare, Best, the Netherlands). The scanning parameters of data are shown in Table 1. Rs-fMRI data were preprocessed by DPABI software with slicing timing correction, motion correction, normalization, linear detrending, and nuisance covariate regression, and filtering. Based on preprocessing, the blood-oxygen-level dependent time course for each voxel was extracted, and the Pearson correlation coefficients (defined as correlation coefficient r > 0.25 ) with each other voxel in the brain were then calculated to determine the DC 16. We estimated the whole-brain network's binary DC values in this research. To improve normality, the Fisher r to z transformation was used on the voxel-wise DC values to create a z-score map. Subsequently, each individual DC was spatially smoothed using a 4 × 4 × 4 mm full-width half maximum (FWHM) Gaussian filter. Differences in DC values between CRS and HCs were compared by two-sample t-test with age, sex, and education levels as covariates. The statistical significance between the two groups was set to the cluster-level False Discovery Rate (FDR) corrected cluster-wise threshold of P < 0.05. Correlation analysis was applied to investigate the relationship between DC values and clinical parameters.Results
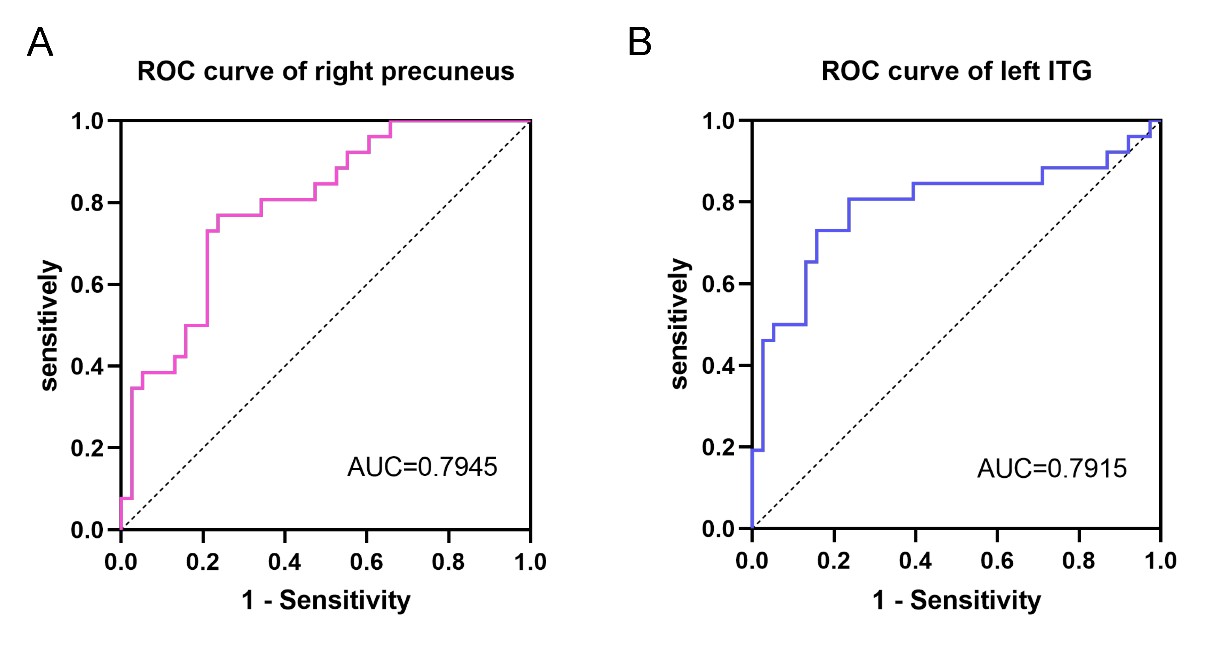
Twenty-eight CRS patients and 38 HCs were recruited for the current study. Details are summarized in Table 2. Compared with the HCs, the DC values were lower in the right precuneus and higher in the left inferior temporal gyrus (ITG) in CRS patients (Figures 1A, 1B). Spearman's correlation analysis showed a positive correlation between the DC values of the left ITG and the duration of the disease (Figure 2). The receiver operating characteristic (ROC) curves were analyzed for DC values in the right precuneus and the left ITG to find the potential imaging biomarkers to diagnose CRS. The area under the ROC curve (AUC) of the DC values of the right precuneus and the left ITG were 0.7945 (Figure 3A) and 0.7915 (Figure 3B), respectively, showing good accuracy in diagnosing CRS.Discussion and Conclusion
The present investigation indicated that CRS patients showed intrinsic abnormal DC values in the right precuneus and the left ITG, both of which are involved in cognitive processing and emotional regulation. Furthermore, a positive correlation was found between DC values in the left ITG and disease duration. These results reveal new insights into the neuropathological mechanisms in CRS patients.Acknowledgements
We thank all participants in this study, and this work was supported by grants from the Natural Science Foundation of Fujian Province, China (Grant No. J01535).References
1. Sedaghat AR, Kuan EC, Scadding GK. Epidemiology of Chronic Rhinosinusitis: Prevalence and Risk Factors. Journal of Allergy and Clinical Immunology-in Practice. 2022;10(6):1395-1403.
2. Smith KA, Alt JAJCOiO, Head, Surgery N. The relationship of chronic rhinosinusitis and depression. 2020;28(1):1-5.
3. Kim J, Ko I, Kim M, Yu M, Cho B, Kim DJJOHNS. Association of chronic rhinosinusitis with increased risk of depression and anxiety in a nationwide insurance population [published online February 7, 2019].
4. Kim J-Y, Ko I, Kim MS, et al. Relationship of chronic rhinosinusitis with asthma, myocardial infarction, stroke, anxiety, and depression. 2020;8(2):721-727. e723.
5. Jung HJ, Lee JY, Choi YS, Choi HG, Wee JH. Chronic rhinosinusitis and progression of cognitive impairment in dementia. European Annals of Otorhinolaryngology-Head and Neck Diseases. 2021;138(3):147-151.
6. Alt JA, Smith TL, Mace JC, Soler ZMJTl. Sleep quality and disease severity in patients with chronic rhinosinusitis. 2013;123(10):2364-2370.
7. Tarasidis GS, DeConde AS, Mace JC, et al. Cognitive dysfunction associated with pain and quality of life in chronic rhinosinusitis. Paper presented at: International forum of allergy & rhinology2015. 8. Jung H-J, Lee J-Y, Choi Y-S, Choi H-G, Wee J-HJEAoO, Head, Diseases N. Chronic rhinosinusitis and progression of cognitive impairment in dementia. 2021;138(3):147-151.
9. Jafari A, de Lima Xavier L, Bernstein JD, Simonyan K, Bleier BSJJOH, Surgery N. Association of sinonasal inflammation with functional brain connectivity. 2021;147(6):534-543.
10. Lin S, Nie M, Wang B, et al. Intrinsic brain abnormalities in chronic rhinosinusitis associated with mood and cognitive function. 2023;17:1131114.
11. Zhu J, Zhang Y, Zhang B, et al. Abnormal coupling among spontaneous brain activity metrics and cognitive deficits in major depressive disorder. 2019;252:74-83.
12. Buckner RL, Sepulcre J, Talukdar T, et al. Cortical hubs revealed by intrinsic functional connectivity: mapping, assessment of stability, and relation to Alzheimer's disease. 2009;29(6):1860-1873. 13. Zuo X-N, Ehmke R, Mennes M, et al. Network centrality in the human functional connectome. 2012;22(8):1862-1875.
14. Cañete-Massé C, Carbó-Carreté M, Peró-Cebollero M, et al. Abnormal degree centrality and functional connectivity in Down syndrome: A resting-state fMRI study. 2023;23(1):100341.
15. Chen C, Wang H-L, Wu S-H, et al. Abnormal degree centrality of bilateral putamen and left superior frontal gyrus in schizophrenia with auditory hallucinations: a resting-state functional magnetic resonance imaging study. 2015;128(23):3178-3184.
16. Li M-g, Bian X-b, Zhang J, Wang Z-f, Ma LJNl. Aberrant voxel-based degree centrality in Parkinson’s disease patients with mild cognitive impairment. 2021;741:135507.
17. Liu Y, Lai C-HJIJoMS. The alterations of degree centrality in the frontal lobe of patients with panic disorder. 2022;19(1):105.
18. Liu D, Duan S, Zhou C, et al. Altered brain functional hubs and connectivity in type 2 diabetes mellitus patients: a resting-state fMRI study. 2018;10:55.
19. Yan C-Q, Huo J-W, Wang X, et al. Different degree centrality changes in the brain after acupuncture on contralateral or ipsilateral acupoint in patients with chronic shoulder pain: a resting-state fMRI study. 2020;2020.
20. Li J, He P, Lu X, et al. A resting-state functional magnetic resonance imaging study of whole-brain functional connectivity of voxel levels in patients with irritable bowel syndrome with depressive symptoms. 2021;27(2):248.
Figures