3149
Tumor-induced modifications of resting-state networks in patients with glioma1Radiology, Memorial Sloan Kettering Cancer Center, New York City, NY, United States, 2Ospedale Pediatrico Bambino Gesù, Roma, Italy, 3Roma Tre University, Roma, Italy, 4Memorial Sloan Kettering Cancer Center, NYC, NY, United States
Synopsis
Keywords: Functional Connectivity, Brain Connectivity, Glioma; fMRI
Motivation: Gliomas affect the whole brain causing widespread network modifications.
Goal(s): This study investigated the tumor effect on multiple brain networks using resting-state functional MRI.
Approach: 147 glioma patients and 200 healthy controls (HCs) were included. After pre-processing, group-independent and group information-guided component analyses were used to extract brain networks. The cosine similarity of each patient’s network was compared to HCs. Chi-squared test was used to test associations with tumor location and grade.
Results: Cognitive networks are selectively vulnerable to tumor growth. Functional alterations extend beyond tumor boundaries, and increase with WHO-grade. Tumor location in known eloquent areas exerts widespread effects on brain networks.
Impact: We developed a methodology to quantify tumor-induced alterations of individual brain networks. These alterations extend beyond tumor boundaries, vary with network’s function, tumor location and grade. Understanding such abnormalities is crucial for managing cognitive disabilities before and after surgery.
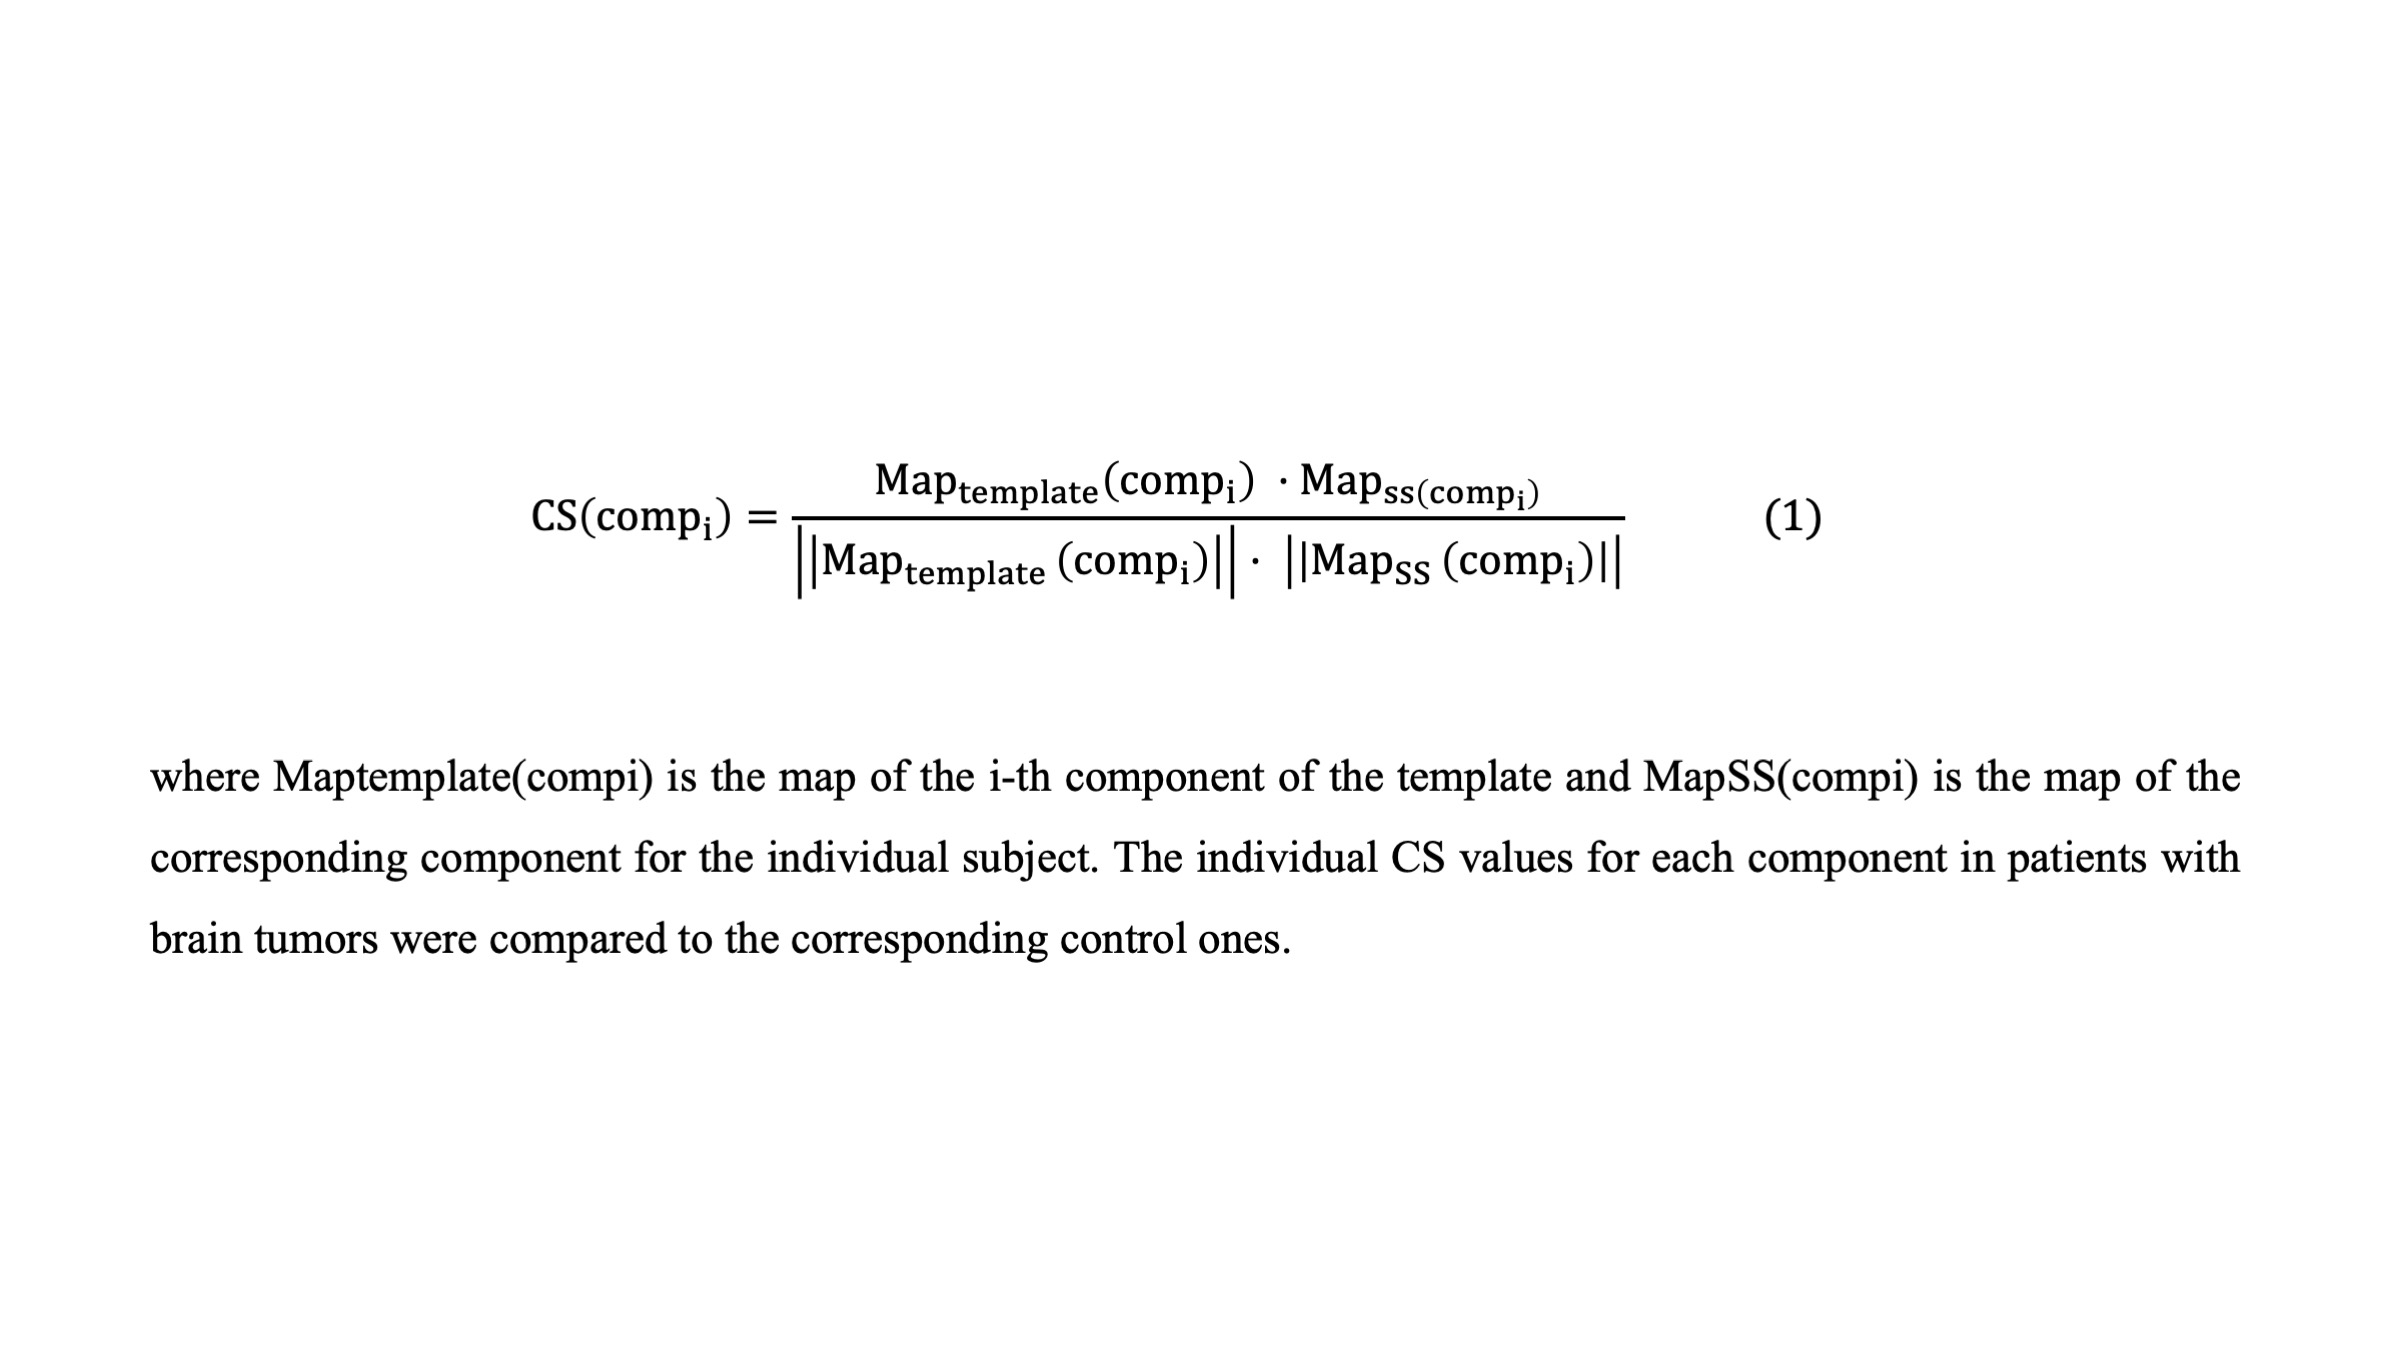
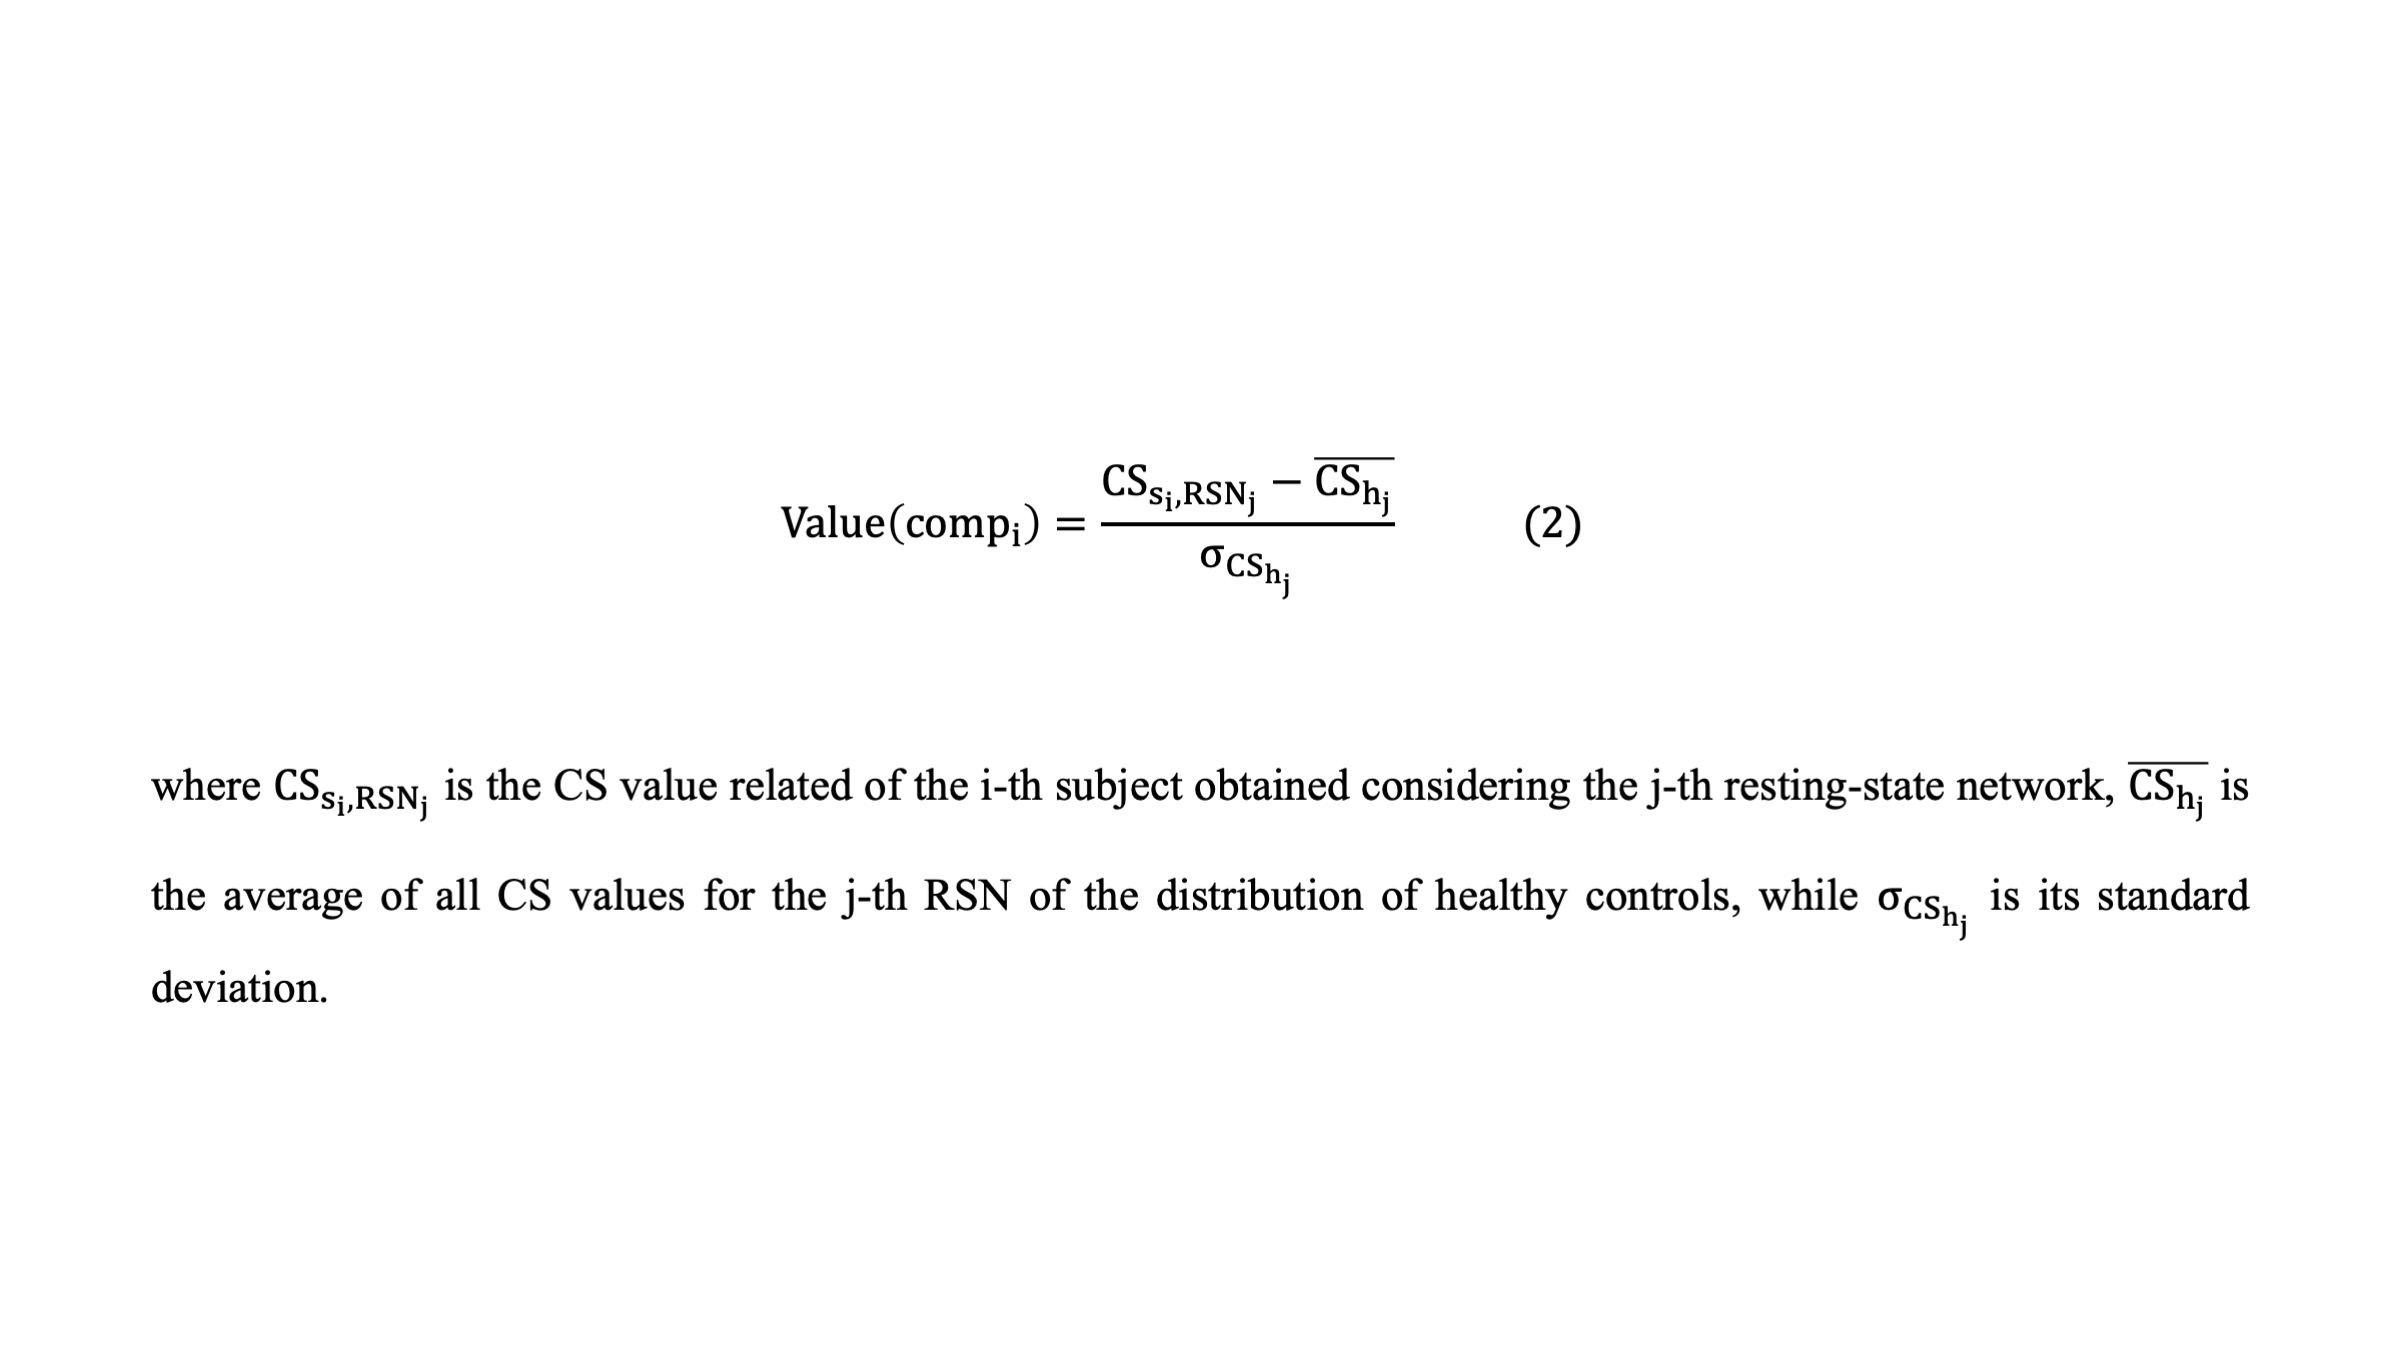
METHODS: The study received IRB approval. We recruited 147 glioma patients (89M, 50.95±16.13y, 92 high-grade, 55 low-grade) and 200 healthy controls (HCs) with rs-fMRI. The dataset included FLAIR, T1-weighted (T1w), and resting-state sequences acquired with TR = 2500 ms and 160 volumes. The subject data was pre-processed to eliminate motion artifacts and aligned to a common standard space (MNI152) using SPM12 on MATLAB4. Fully automated glioma segmentation was performed using the DeepSeg tool in 3Dslicer5. Tumor boundaries were segmented using a pre-trained deep learning model validated with the MICCAI Brain Tumor Segmentation Challenge 2020 (BraTS) dataset6. The Group ICA of fMRI Toolbox (GIFT) was used to extract the independent components (ICs), and a reference template was created using data from 200 healthy controls through Group Independent Component Analysis (G-ICA)7,8. This template served as a guide during Group information-guided ICA (GIG-ICA) to extract the corresponding independent components for each subject and label them with their respective resting-state networks (RSNs) using NeuroMark fMRI 1.0 atlas9-11. To determine alterations of specific ICs in single patients, we computed the cosine similarity (CS) between the two vectors as in equation (Fig 1), and ran a permutation test to compare, for each IC, the CS of each patient against the distribution of CS values in HCs12. The alterations were identified using a thresholding technique based on the standardization in Fig 2. The information regarding the alteration of ICs was subsequently used to conduct the contingency analysis with a chi-squared test to verify the significance of these alterations, as well as tumor location and grade. The statistical threshold was set at p<0.05.
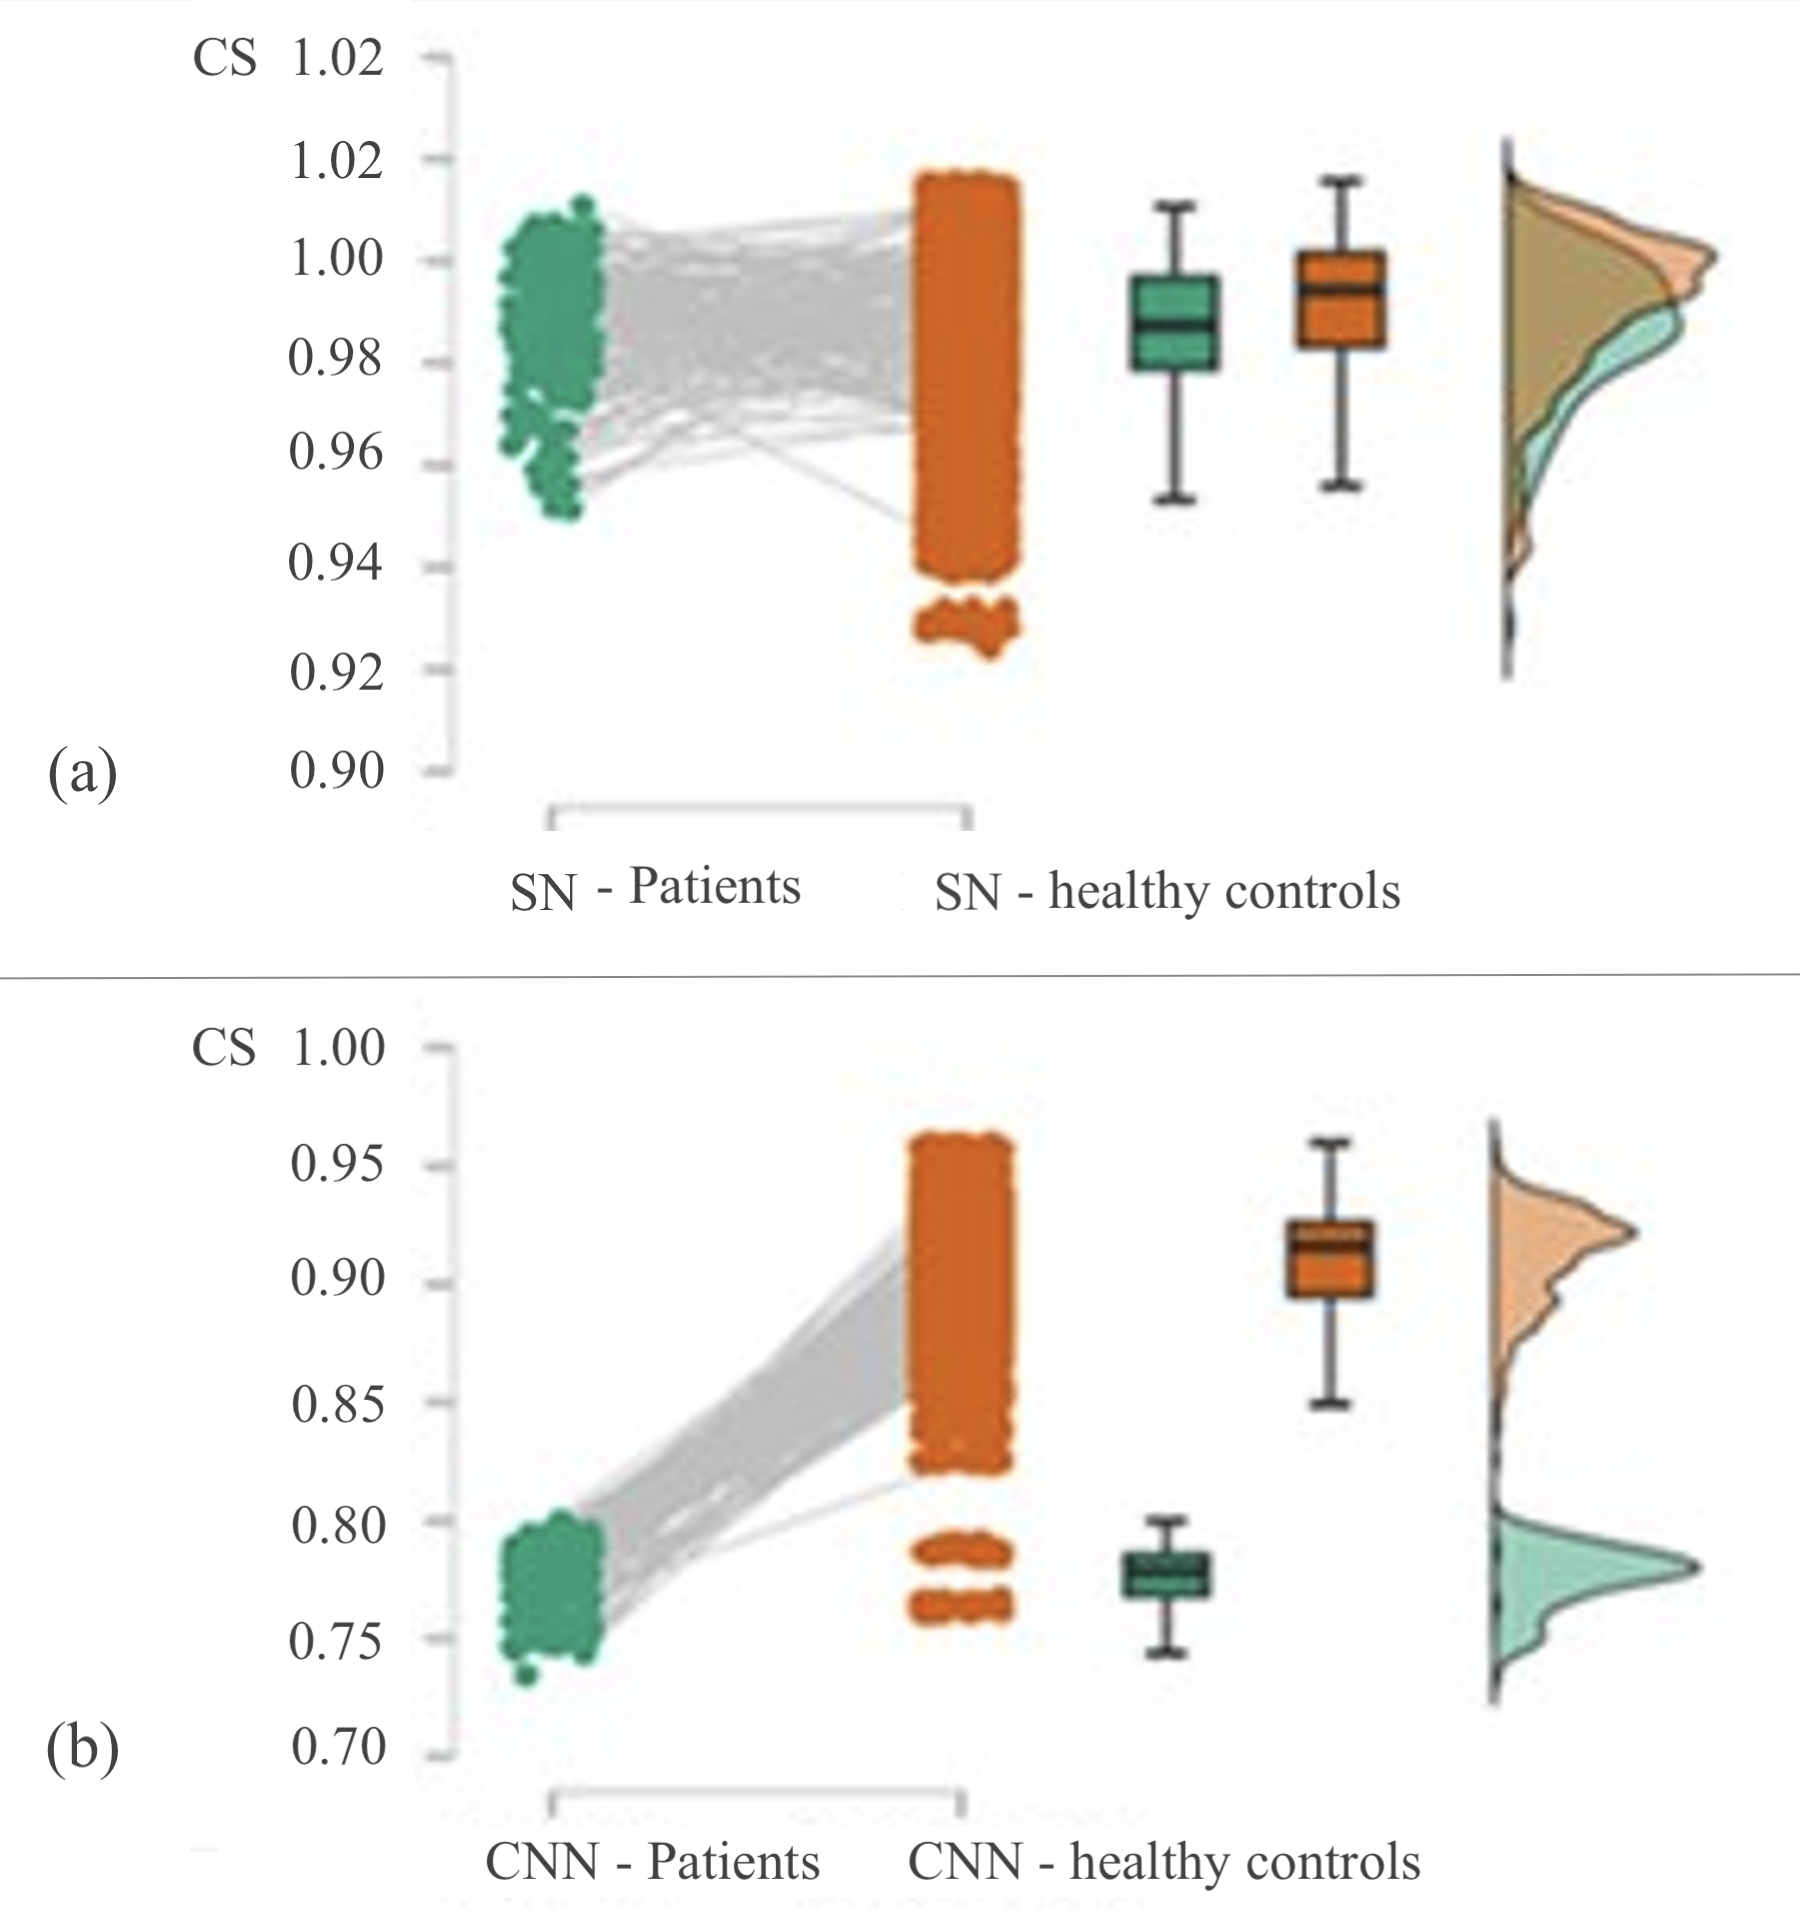
RESULTS: Out of the 20 network components in HCs, 10.38±1.43 resulted altered in patients, including cognitive control network (CCN); default mode network (DMN); sensorimotor network; visual network (VN). Auditory network and subcortical network did not show any significant difference. The most pronounced effect was noted in the CCN network, with significant alteration of every component (3/3). Additionally, CCN showed significant alterations with tumors in the temporal lobe (p=0.005), Broca's (p=0.01), and Wernicke's area (p=0.041). Tumors in Wernicke's area also altered the DMN (p=0.04). Networks alterations persisted with increased distance from the tumor and were more pronounced with higher WHO-grade (p<0.001).
DISCUSSION: In this study, we developed a methodology to study the effects of gliomas on brain networks, utilizing G-IGA and GIG-ICA for analysis. This methodology can quantify the alteration induced by the tumor at the individual network level, allowing to image the functional damage through rs-fMRI in each subject. Our results indicate specific vulnerability of cognitive networks to tumor growth. Functional alterations extend beyond tumor boundaries, and increase with WHO-grade. Tumor location in known eloquent areas exerts widespread effects on brain networks. Limitations of the study include retrospective design and lack of complete neuropsychological testing.
CONCLUSION: Understanding specific network abnormalities in patients with brain tumors is crucial for managing cognitive disabilities before and after surgery.
Acknowledgements
No acknowledgement found.References
1. Hadjiabadi DH, Pung L, Zhang J, et al. Brain tumors disrupt the resting-state connectome. Neuroimage Clin 2018;18:279–89.
2. Lee MH, Smyser CD, Shimony JS. Resting-state fMRI: A review of methods and clinical applications. American Journal of Neuroradiology 2013;34:1866–72.
3. Briganti C, Sestieri C, Mattei PA, et al. Reorganization of functional connectivity of the language network in patients with brain gliomas. American Journal of Neuroradiology 2012;33:1983–90.
4. Tzourio-Mazoyer N, Landeau B, Papathanassiou D, et al. Automated anatomical labeling of activations in SPM using a macroscopic anatomical parcellation of the MNI MRI single-subject brain. Neuroimage 2002;15:273–89.
5. Fedorov A, Beichel R, Kalpathy-Cramer J, et al. 3D Slicer as an image computing platform for the Quantitative Imaging Network. Magn Reson Imaging 2012;30:1323–41.
6. Menze BH, Jakab A, Bauer S, Kalpathy-Cramer J, Farahani K, Kirby J, et al. The Multimodal Brain Tumor Image Segmentation Benchmark (BRATS). IEEE Transactions on Medical Imaging 2015;34:1993-2024.
7. Ghumman S, Fortin D, Noel-Lamy M, Cunnane SC, Whittingstall K. Exploratory study of the effect of brain tumors on the default mode network. Journal of Neuro Oncology 2016;128:437-444.
8. Du Y, Fan Y. Group information guided ICA for fMRI data analysis. Neuroimage. 2013;69:157-197.
9. Salman MS, Du Y, Lin D, Fu Z, Fedorov A, Damaraju E, Sui J, Chen J, Mayer AR, Posse S, Mathalon DH, Ford JM, Van Erp T, Calhoun VD. Group ICA for identifying biomarkers in schizophrenia: ‘Adaptive’ networks via spatially constrained ICA show more sensitivity to group differences than spatio-temporal regression. Neuroimage: Clinical 2019;22:101747.
10. Du Y, Fan Y. Group information guided ICA for fMRI data analysis Neuroimage 2013; 69:157-197.
11. Calhoun VD, Adali T, Pearlson GD, Pekar J. A method for making group inferences from functional MRI data using independent component analysis. Human Brain Mapping 2001;14:140-151, 2001.
12. Muflikhah L, Baharudin B. Document Clustering Using Concept Space and Cosine Similarity Measurement in: International conference on computer technology and development 2009.
Figures