3146
Dysregulated functional network interactions in the brain of depression: From the perspective of the triple-network model1China-Japan-Friendship-Hospital, Beijing, China, 2Huazhong University of Science and Technology Union Shenzhen Hospital, Shenzhen, China
Synopsis
Keywords: Functional Connectivity, Brain, Major depressive disorder; resting state functional magnetic resonance imaging; network interaction index; functional network connectivity; dynamic functional network connectivity
Motivation: Major Depressive Disorder (MDD) has a high incidence and disability rate. However, the etiology remains unclear, and objective diagnostic markers are lacking.
Goal(s): We hypothesize the presence of static and dynamic abnormal connectivity patterns in three core networks of MDD patients.
Approach: We employ static functional network connectivity (FNC) analysis, dynamic functional network connectivity (dFNC), the network interaction index (NII), and the dynamic functional network connectivity (dNII) to investigate interactions among Default Mode Network (DMN), Salience Network (SN), and Executive Control Network (ECN).
Results: MDD patients have abnormal network functional interactions that can be captured by static and dynamic NII indicators.
Impact: The abnormal network functional interactions deepen our understanding of the abnormal activity of the three networks in MDD patients, helps to reveal the pathogenesis of MDD, and provides ideas for its intervention.
Introduction
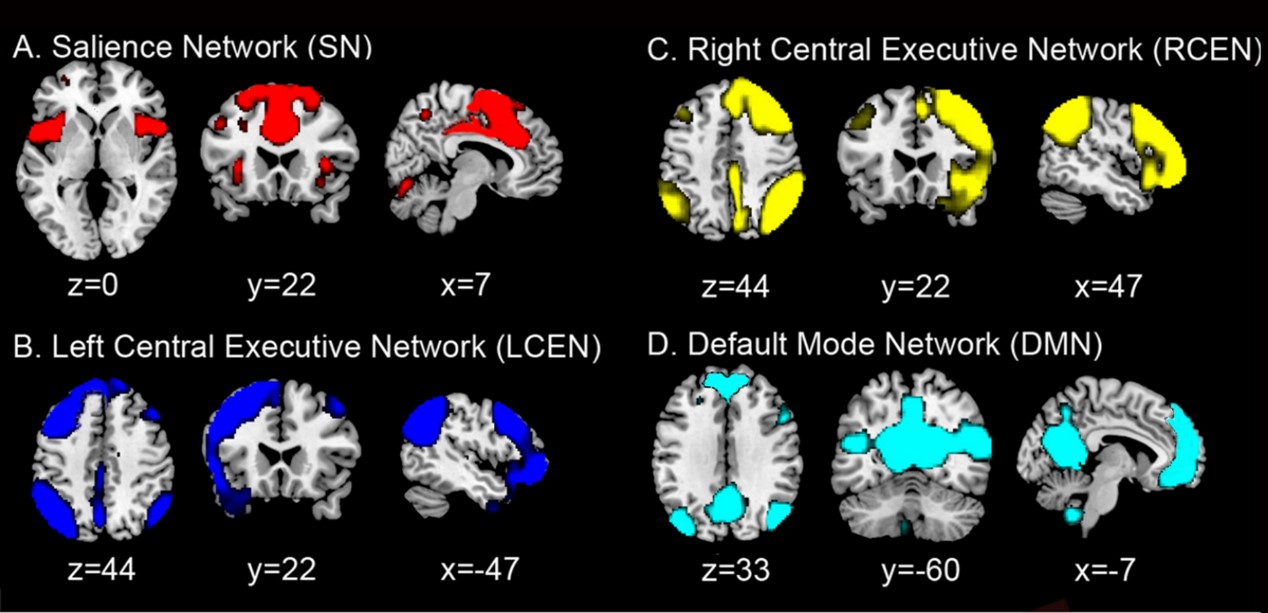
Major Depressive Disorder (MDD) is characterized by persistent feelings of sadness and loss of interest. It has a high incidence and disability rate, imposing a significant economic burden on families and society. However, the etiology remains unclear, and objective diagnostic markers are lacking. Studies have shown alterations in functional connectivity within three interrelated neurocognitive networks: the Default Mode Network (DMN), Salience Network (SN), and Executive Control Network (ECN), which play a crucial role in MDD onset, symptoms, and response to antidepressant treatment. We hypothesize the presence of static and dynamic abnormal connectivity patterns in these core networks of MDD patients. To test this, we employ static functional network connectivity (FNC) analysis, dynamic functional network connectivity (dFNC), the network interaction index (NII), and the dynamic functional network connectivity (dNII) to investigate interactions among DMN, SN, and ECN, proposing reliable indicators.Methods
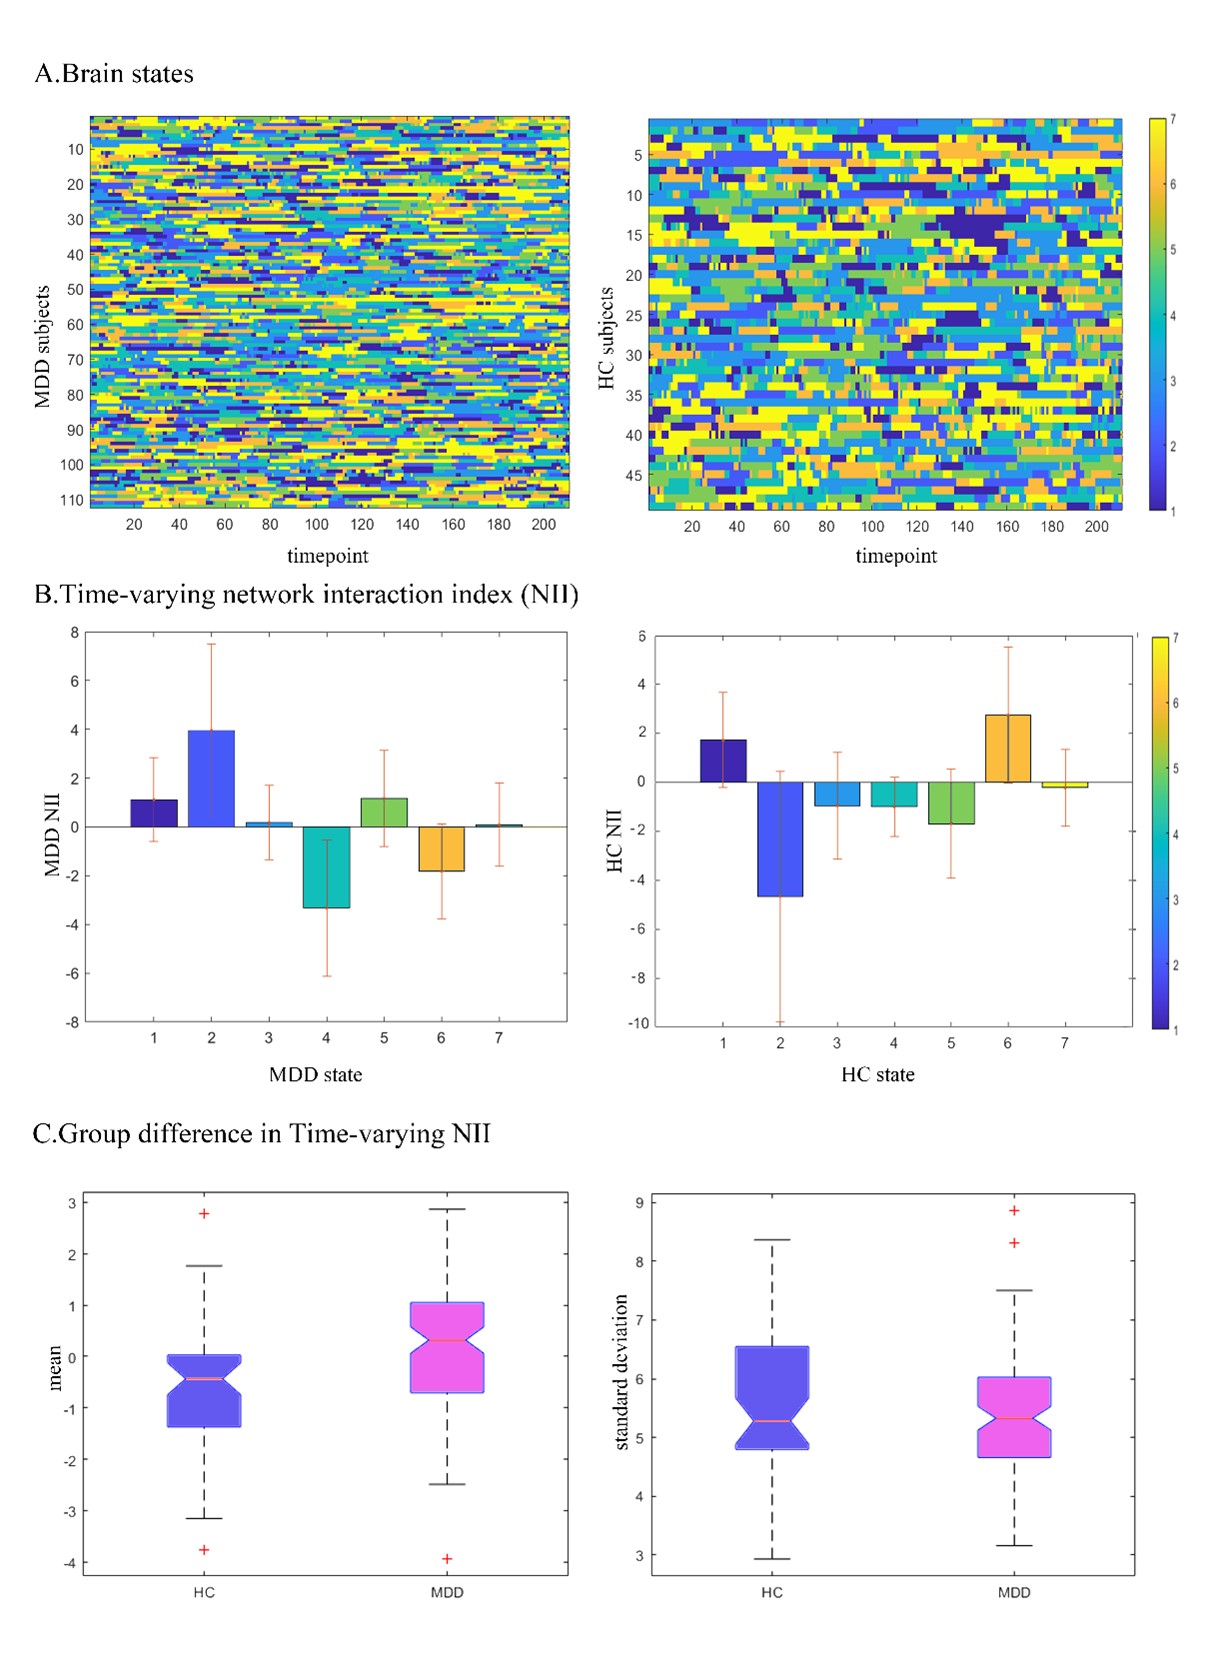
This study included 112 MDD patients diagnosed according to DSM-5 criteria and 49 healthy controls (HC). All participants underwent independent component analysis, and NII and FNC were computed based on the identified independent components. dFNC was derived using the sliding window method, followed by K-means clustering of windowed dFNC. Mean dynamic network interaction index (mdNII) and the variance of dynamic network interaction index (vardNII) were calculated.Results
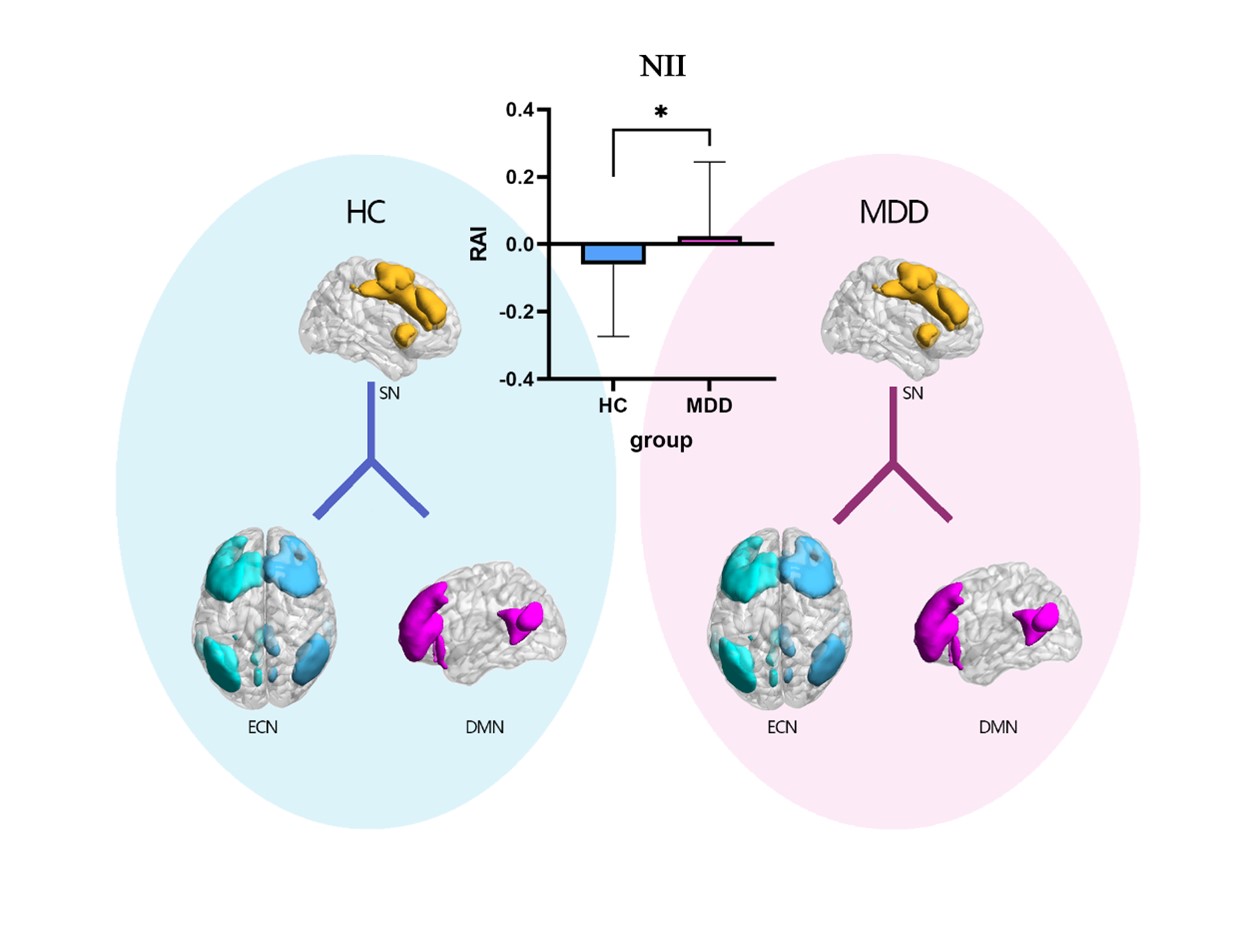
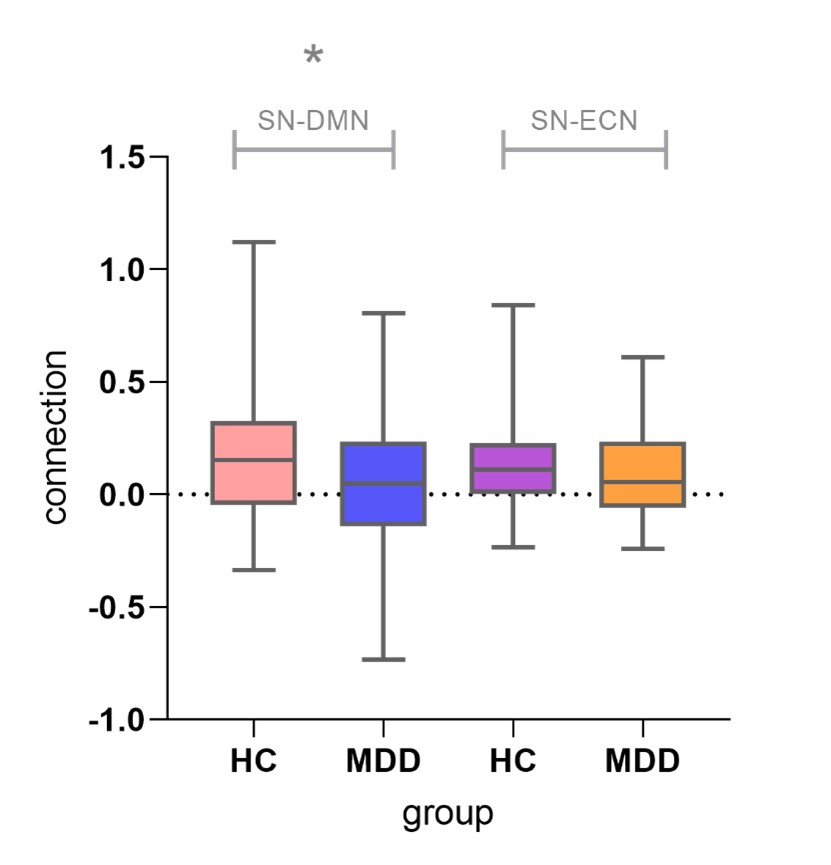
The results of static functional network connectivity show that compared to HC, NII of MDD patients significantly increase (T=-2.24; P=0.03). Further research find that the abnormality of NII in MDD patients is caused by a decrease in SN-DMN connectivity (T=2.19; P=0.03); The results of dynamic functional network connectivity show that after controlling for confounding factors, mdNII of the MDD patient group significantly increase compared to the control group (T=-3.68, P<0.001). Further research find that the abnormality of mdNII in MDD patients is caused by differences in SN-DMN connectivity (reduction), and this change is not affected by the clustering form.Conclusion
MDD patients have abnormal network functional interactions that can be captured by static and dynamic NII indicators. The abnormal network interactions are mainly caused by reduced SN-DMN connectivity. This deepens our understanding of the abnormal activity of the three networks in MDD patients, helps to reveal the pathogenesis of MDD, and provides ideas for its intervention.Acknowledgements
First of all, I would like to thank Professor Ma Guolin of the China-Japan Friendship Hospital for guiding my research as my doctoral supervisor. In addition, I would like to express my sincere respect and gratitude to the team led by Hou Gangqiang from the Radiology Department of Shenzhen Kangning Hospital for their support in providing imaging data and clinical materials to our research institute, as well as to Professor Qiu Yingwei from Huazhong University of Science and Technology and Shenzhen Hospital for his guidance and suggestions during the experimental process.References
[1] First MB. Diagnostic and statistical manual of mental disorders, 5th edition, and clinical utility. J Nerv Ment Dis. 201(9):727-729, 2013.[2] Nordentoft M, Mortensen PB, Pedersen CB. Absolute risk of suicide after first hospital contact in mental disorder. Arch Gen Psychiatry. 68(10):1058-1064, 2011.[3] Williams LM, Rush AJ, Koslow SH, Wisniewski SR, Cooper NJ, Nemeroff CB, Schatzberg AF, Gordon E. International Study to Predict Optimized Treatment for Depression (iSPOT-D), a randomized clinical trial: rationale and protocol. Trials. 5;12:4, 2011.[4] Wang L, Hermens DF, Hickie IB, Lagopoulos J. A systematic review of resting-state functional-MRI studies in major depression. J Affect Disord. 15;142(1-3):6-12, 2012.[5] Díez-Cirarda M, Strafella AP, Kim J, Peña J, Ojeda N, Cabrera-Zubizarreta A, Ibarretxe-Bilbao N. Dynamic functional connectivity in Parkinson's disease patients with mild cognitive impairment and normal cognition. Neuroimage Clin. 9;17:847-855, 2017.[6] Guo, Y. and G. Pagnoni, A unified framework for group independent component analysis for multi-subject fMRI data. Neuroimage, 42(3): 1078-1093, 2008.[7] Zhang JT, Ma SS, Yan CG, Zhang S, Liu L, Wang LJ, Liu B, Yao YW, Yang YH, Fang XY. Altered coupling of default-mode, executive-control and salience networks in Internet gaming disorder. Eur Psychiatry. 45:114-120, 2017.[8] Lerman C, Gu H, Loughead J, Ruparel K, Yang Y, Stein EA. Large-scale brain network coupling predicts acute nicotine abstinence effects on craving and cognitive function. JAMA Psychiatry. 71(5):523-30, 2014.[9] Supekar K, Cai W, Krishnadas R, Palaniyappan L, Menon V. Dysregulated Brain Dynamics in a Triple-Network Saliency Model of Schizophrenia and Its Relation to Psychosis. Biol Psychiatry. 1;85(1):60-69, 2019.Figures