3142
Atypical functional connectome hierarchy in early-blind adolescents1Shenzhen Kangning Hospital/Shenzhen Mental Health Center, Shenzhen, China
Synopsis
Keywords: Functional Connectivity, Brain Connectivity, gradient
Motivation: Blind people are a good biological model for studying brain plasticity.
Goal(s): e examined the brain reorganization of the macroscale hierarchy in early-blind adolescents (EBA) compared with normal-sighted controls (NSC).
Approach: Twenty EBA and 20 age-and sex-matched NSC were included. We calculated the vertex-wise functional connectomes of each individual and compared the top 2 gradient scores between the EBA and NSC groups.
Results: The comparison between groups revealed increases in the first two gradients in the visual, sensorimotor, control, and default-mode networks in EBA.
Impact: The macroscale integration and segregation in unimodal and transmodal network is converged and strengthened in EBA relative to NSC.
Introduction
The human brain is a very sophisticated system, and its plasticity is extremely flexible and creative. Blind people, due to their lack of visual information stimulation, are a good biological model for studying brain plasticity. Here, we examined the brain reorganization of the macroscale hierarchy in early-blind adolescents compared with normal-sighted controls.Methods
In this study, 20 early-blind adolescents( EBA,13 males and 7 females, age range 11-18 years, 15.15±1.93 years) and 20 age-and sex-matched normal-sighted controls (NSC, 10 males and 10 females, age 14.90±2.67 years) were included. High-resolution T1 structural images (voxel size: 1*1*1 mm3) and resting-state functional magnetic resonance images (rs-fMRI) of the whole brain were collected for all participants. We applied an unsupervised nonlinear dimensionality reduction algorithm, diffusion map embedding[1], to the functional connectomes of the cerebral cortex derived from rs-fMRI data of each individual. After aligning the subjective gradients of all subjects to the HCP reference template[2], we used a surface-based linear model to compare the top 2 gradient scores between the EBA and NSC groups.Results
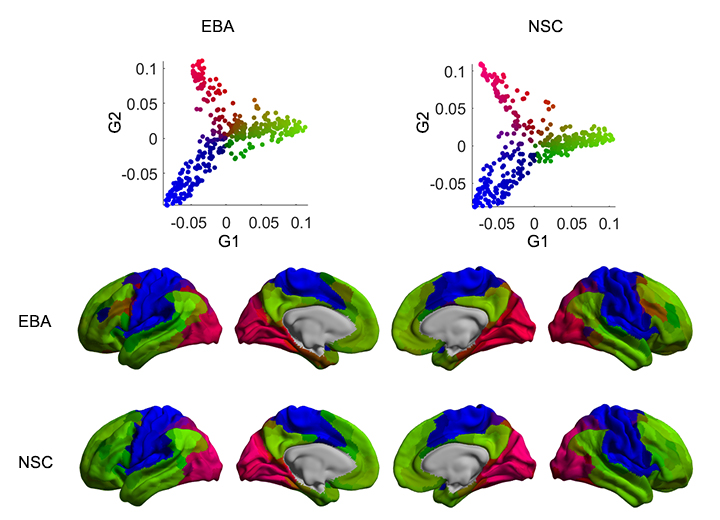
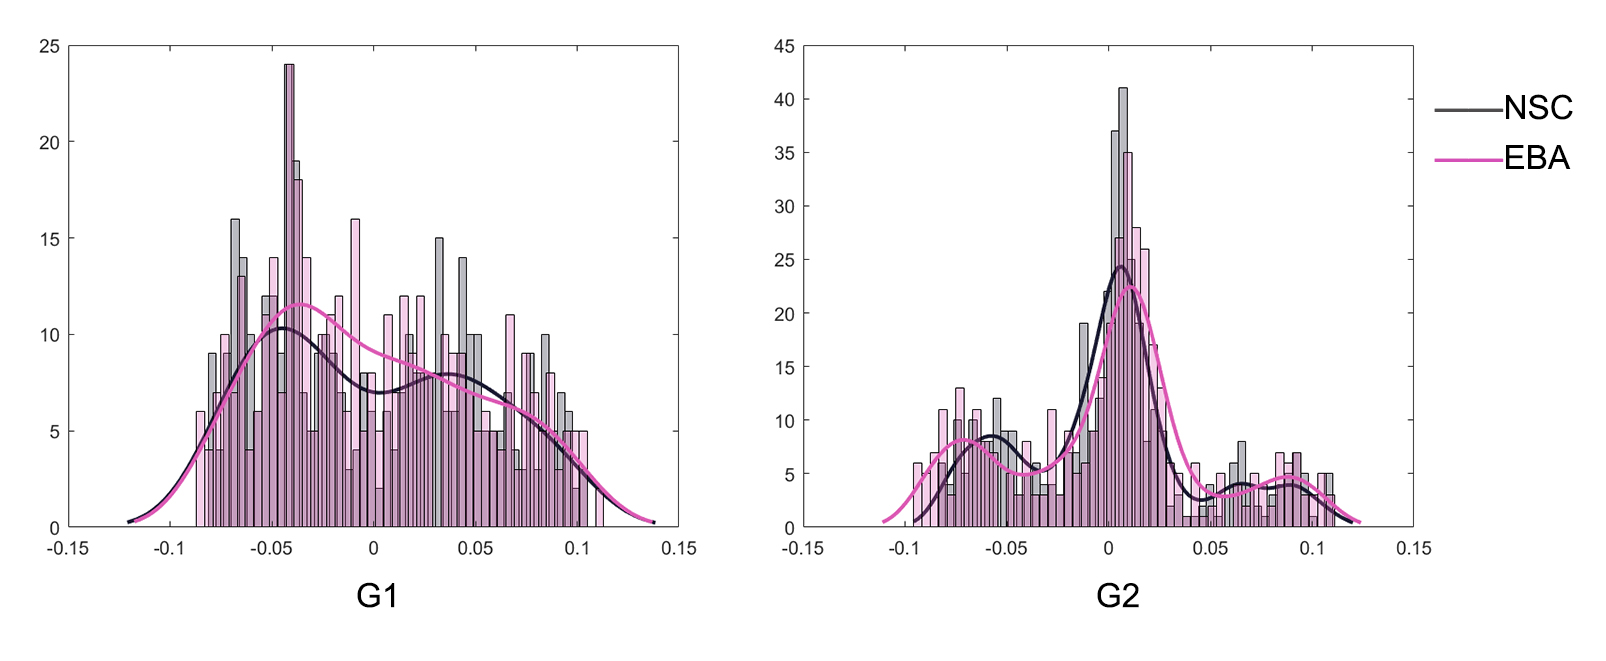
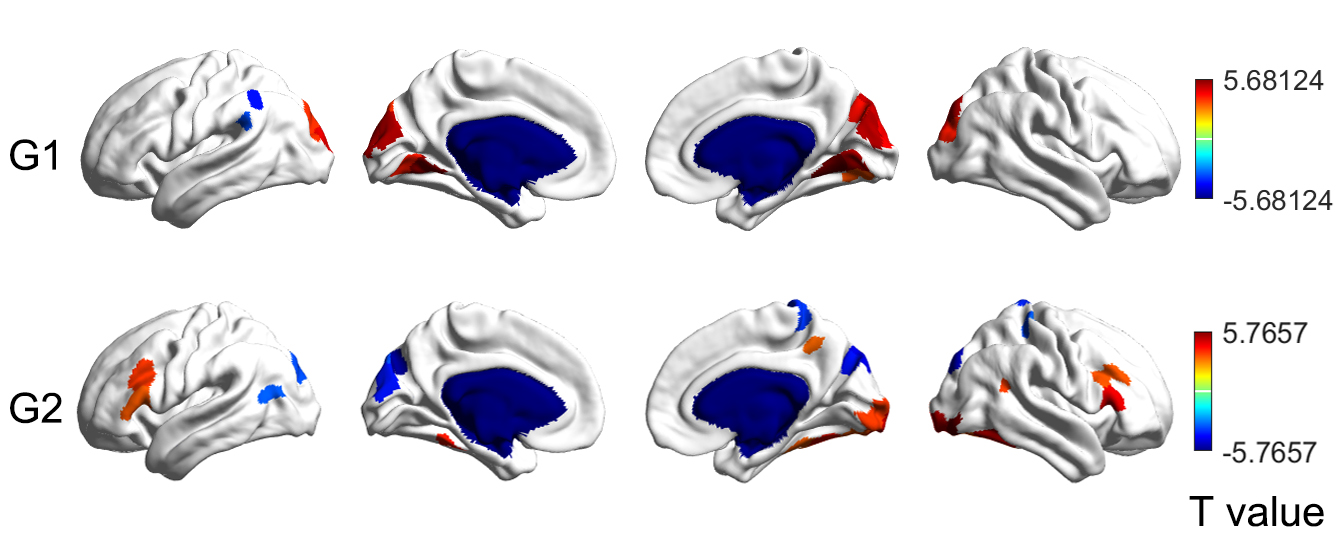
The results showed that there was no significant difference in the range of gradient scores between the two groups (p values > 0.05 in both gradients). The first principal gradient (G1) explained 15.7 % of connectome variance in the EBA group, which was significantly higher than that in the NSC group (14.5 %) (t = 2.380, p = 0.022, FDR-corrected). We did not observe any difference of explainable variance ratio between EBA and NSC groups for the second gradient (G2). The standard deviation of the G2 in EBA group was higher than that in NSC group (t = 2.077, p = 0.045, FDR-corrected). The vertex-wise comparison between groups revealed increases in G1 in the bilateral unimodal visual network (extrastriate cortex) and increases in G2 in the right visual network ( striate cortex and extrastriate cortex ), the bilateral default-mode network ( prefrontal and precuneus), the bilateral sensorimotor network, and bilateral control network ( parietal and prefrontal cortex ) in EBA, together with decreases in G1 in the left dorsal attention network and control network, and decreases in G2 in the bilateral visual network (extrastriate cortex) and the sensorimotor network (p < 0.05, FDR-corrected ).Discussion
Globally, the cortical gradient range of EBA was similar to that of NSC group for G1 and G2, but the gradient scores of bilateral visual network in G1 of EBA group was significantly increased, and the gradient dispersion of bilateral visual network and somatosensory motor network in G2 was greater than NSC group. The gradient scores of the bilateral default-mode network, bilateral sensorimotor network, and bilateral control network in G2 of the EBA group were significantly increased. This may be due to the fact that the visual network of blind tends to process other non-visual information, thus strengthening the connection with other unimodal and transmodal networks.Conclusion
Together, our connectome gradient results revealed that the macroscale integration and segregation in unimodal and transmodal network is converged and strengthened in EBA relative to NSC.Acknowledgements
No acknowledgement found.References
[1] Coifman R R, Lafon S, Lee A B, et al. Geometric diffusions as a tool for harmonic analysis and structure definition of data: Diffusion maps[J]. Proc Natl Acad Sci U S A, 2005, 102(21): 7426-7431.
[2] Vos de Wael R, Benkarim O, Paquola C, et al. Brainspace: A toolbox for the analysis of macroscale gradients in neuroimaging and connectomics datasets[J]. Commun Biol, 2020, 3(1): 103.
Figures