3140
Neighborhood disadvantage is associated with altered cortical connectivity in frontoparietal brain regions1University of Wisconsin, Madison, WI, United States
Synopsis
Keywords: Preclinical Image Analysis, Preclinical, Cortical network, Neighborhood disadvantage, Alzheimers disease
Motivation: Neighborhood disadvantage measured using an area deprivation index(ADI) has shown to impact cognitive outcomes,with alterations in regional volumetric and cortical assessment. Connectivity based approaches could further identify cortical network patterns associated with cognitive decline and neighborhood disadvantage
Goal(s): We evaluated associations between neighborhood disadvantage,cognitive impairment and changes in morphological similarity network(MSN)features.
Approach: For unimpaired cohort(n=297)with lowest and highest ADI ranks,cortical thickness based MSN features were computed and associations between ADI,cognitive performance and network features were assessed using linear regression and mediation analysis
Results: Disorganization of frontoparietal regions was associated with ADI and demonstrated marginal mediating effect between cognitive impairment and neighborhood disadvantage status.
Impact: Our findings of association between neighborhood disadvantage status and cortical disorganization in Alzheimer’s-related fronto-parietal brain regions, support the impact of neighborhood disadvantage on cognitive outcomes, and provide a connectivity based mechanism that may explain risk for cognitive decline and dementia.
Introduction
Living in a disadvantaged neighborhood has been shown to impact health and cognitive outcomes1. Area deprivation index (ADI) is a measure of neighborhood disadvantage and includes factors such as income, education, employment, and housing quality in a specific geographic area2 . Recent neuroimaging studies have reported that changes in brain volume3 and cortical thickness4 in certain regions of the brain, are associated with ADI and cognitive decline. Given that the human brain is a highly integrated network, there is an opportunity to go beyond individual measures (e.g. volume, cortical thickness) of brain regions, and explore the network patterns of these measures across different brain regions and their associations with cognitive decline and ADI. Our study is based on the hypothesis that morphological similarity networks (MSN), that elucidate the organization of similarities in cortical thickness across different brain regions via a graph network, can capture the potential effects of neighborhood disadvantage on sfunctional relationships between brain regions and potentially explain risk for later life cognitive decline among individuals who live in disadvantaged contexts.Methods:
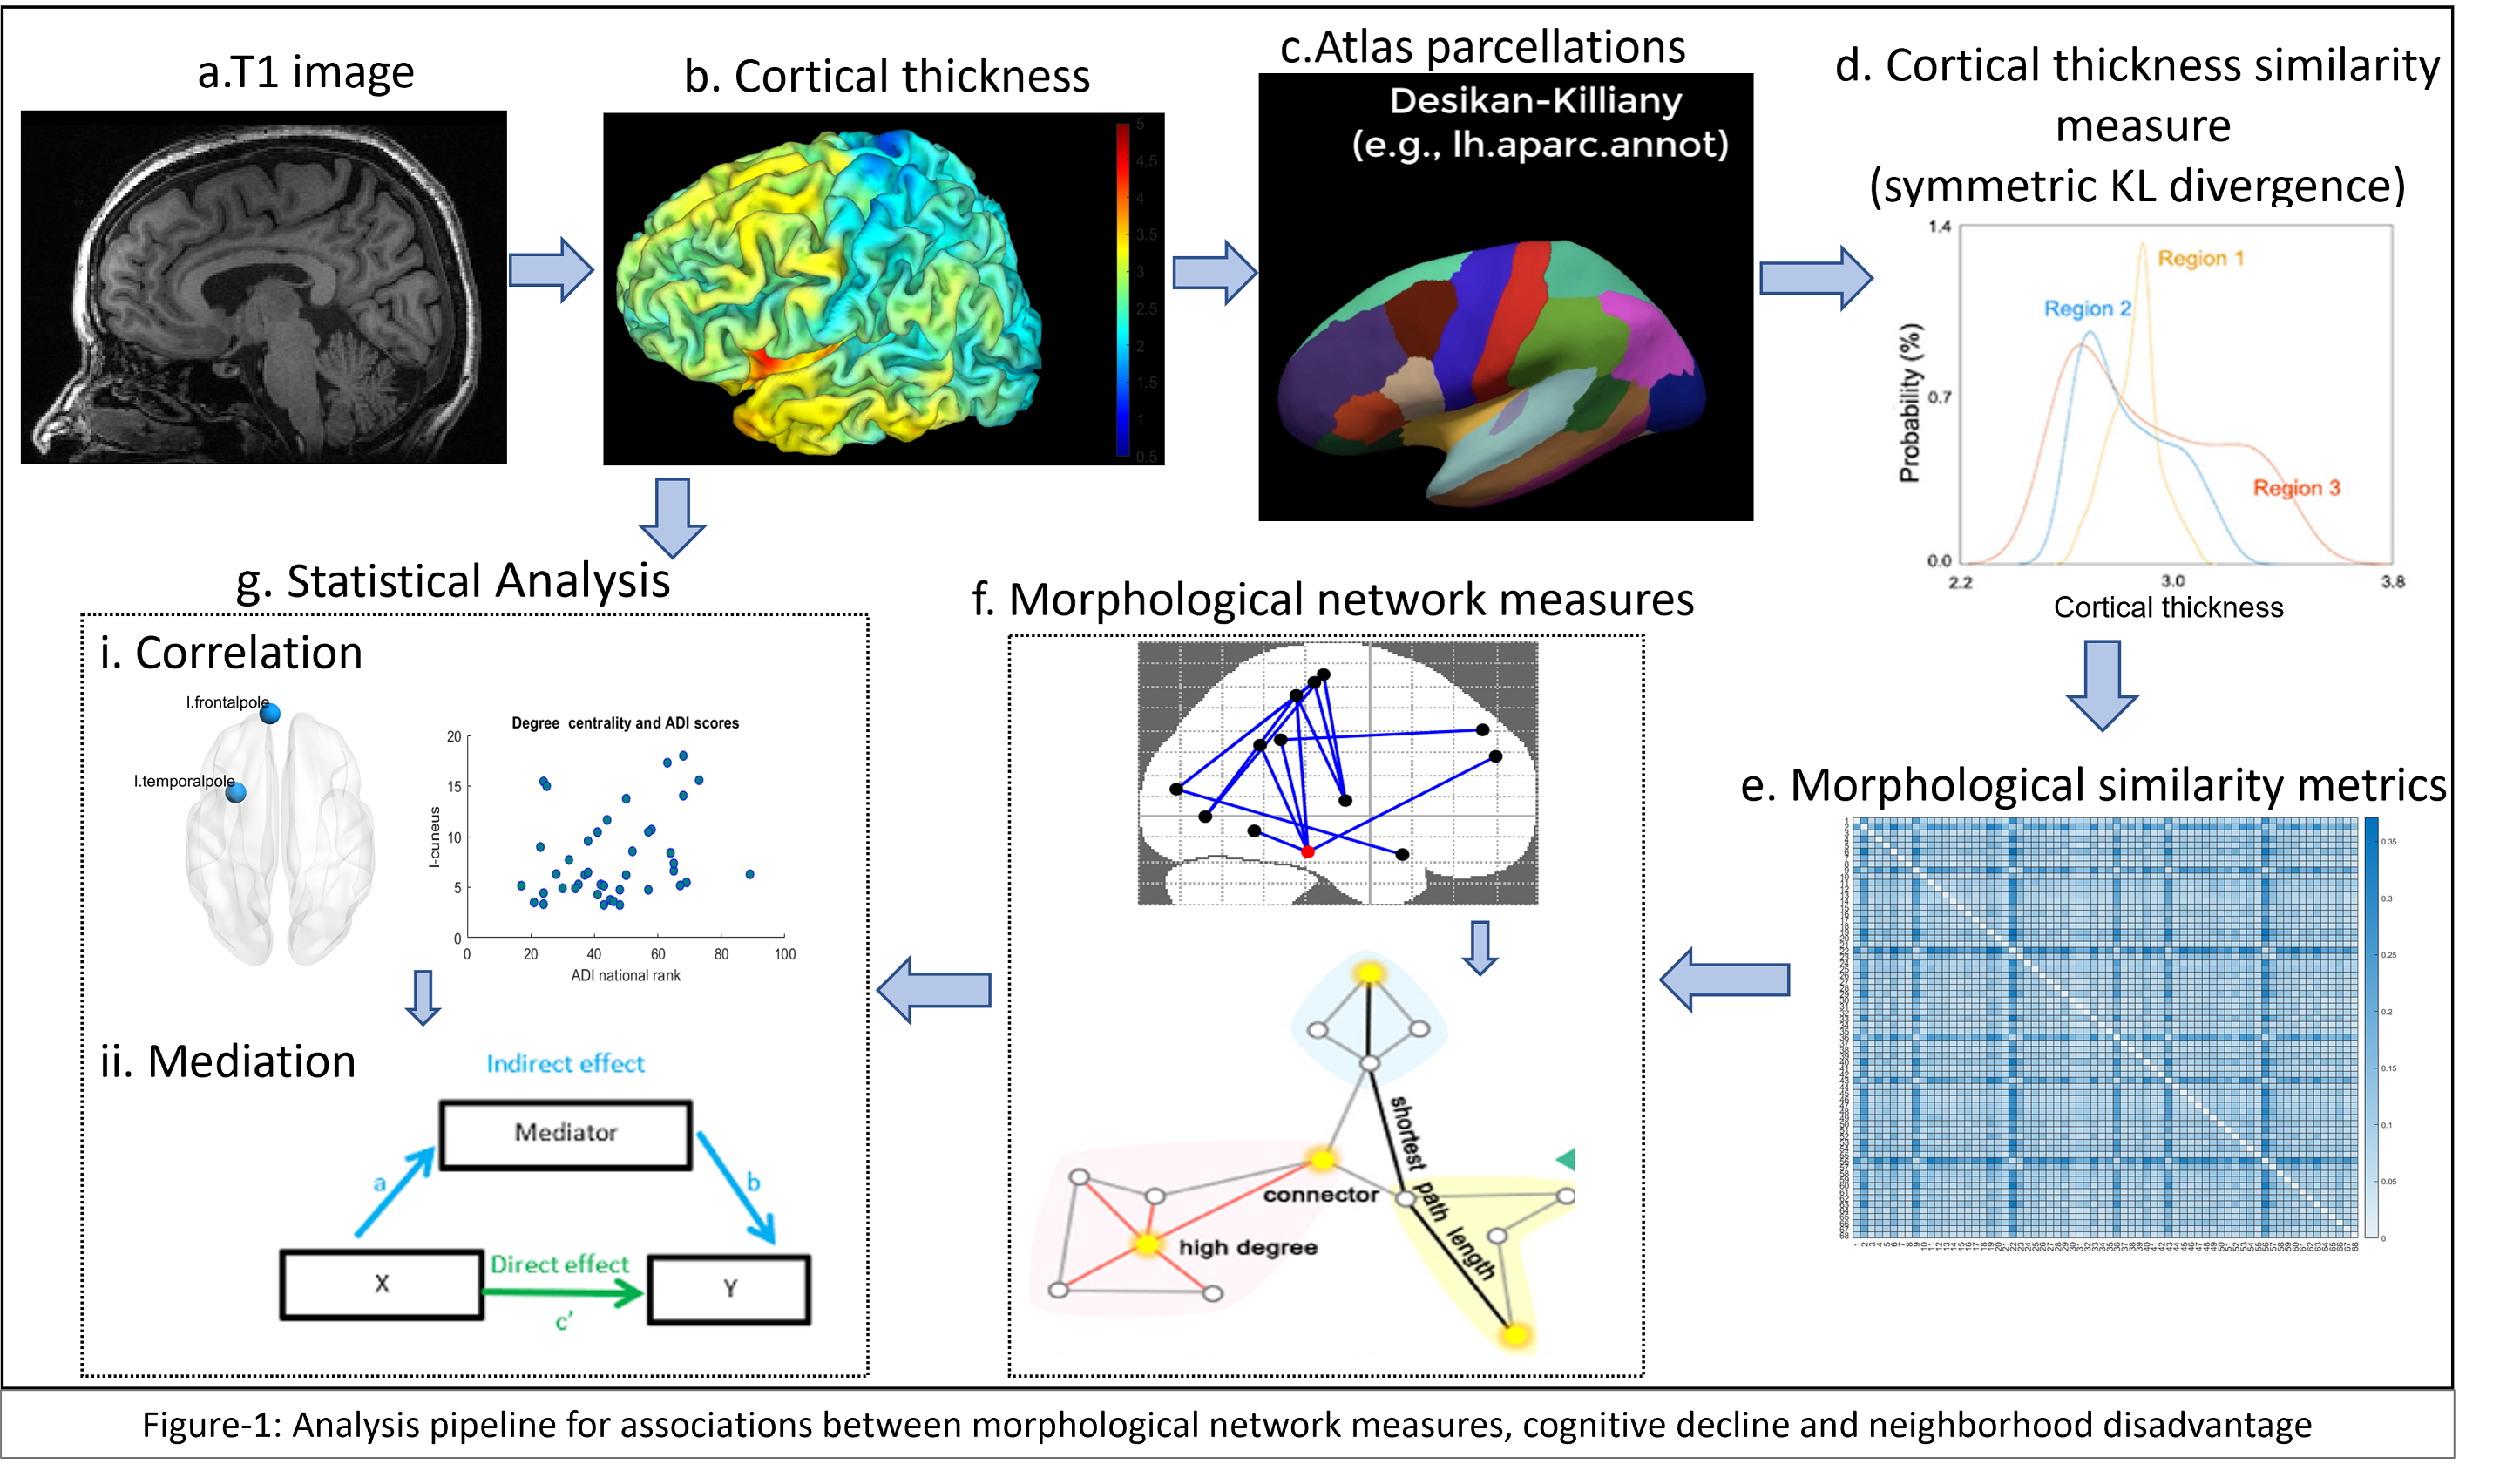
Data for this study were collected from cognitively unimpaired participants enrolled in two large longitudinal studies: Wisconsin Alzheimer’s Disease Research Center (ADRC) and Wisconsin Registry for Alzheimer’s Prevention (WRAP)5. ADI state rank scores were available for all participants based on current residence. We compared deciles from 1 and 10, where group 1 had the lowest ADI (least disadvantaged) and 10 the highest ADI (most disadvantaged). Participants with the highest and lowest ADI ranks were included (n=297) based on previous studies that have reported the strongest health effects among individuals living at the highest levels of disadvantage2,3. All participants underwent comprehenize cognitive testing. For this study we examined memory and executive function tests, Rey Auditory Verbal Learning Test (RAVLT), Category Fluency (CF) test, and response time on Trail-Making Test (TMTrt), as well as a composite cognitive, a modified Preclinical Alzheimer’s Cognitive Composite (PACC) score. T1-weighted MRI scans were acquired on 3.0 T GE scanners using an 8 or 32-channel head coil and a spoiled gradient echo scanning sequence. Preprocessing included denoising, segmentation of gray matter, white matter, and cerebrospinal fluid, normalization to MNI template, followed by computation and smoothening of cortical thickness (CT) maps, using CAT12 toolbox6. MSNs were computed as similarity network graphs of CT, wherein nodes were represented as 68 cortical brain regions or regions of interest (ROIs) from the Desikan Killiany atlas, while the edges indicated similarity in distribution of cortical thickness, between these 68 brain regions. For construction of MSN, edges were estimated by calculating symmetric Kullback–Leibler divergence over probability distribution of vertex-wise CT values, for each pair of ROIs as shown on in Figure-1. Local and global network features were computed from the MSN. The local network features which indicate local influence of connected brain regions, comprised betweeenness centrality (BC), degree centrality (DC), clustering coefficienct (CC) and local efficiency (LE), wheres global network features that quantify the global connectedness of a graph consisted of assortativty, global efficiency, path length and small worldness. Statistical analysis involved independent association of neighborhood disadvantage (ADI ranks) with cognitive scores and MSN features using linear regression. Mediating effect of MSN features on the relationship between ADI and cognitive performance was statistically assessed using a non-parametric bootstrapping (10,000) approach. Age, gender, years of education, and total intracranial volume were used as covariates in the above testsResults and Discussion:
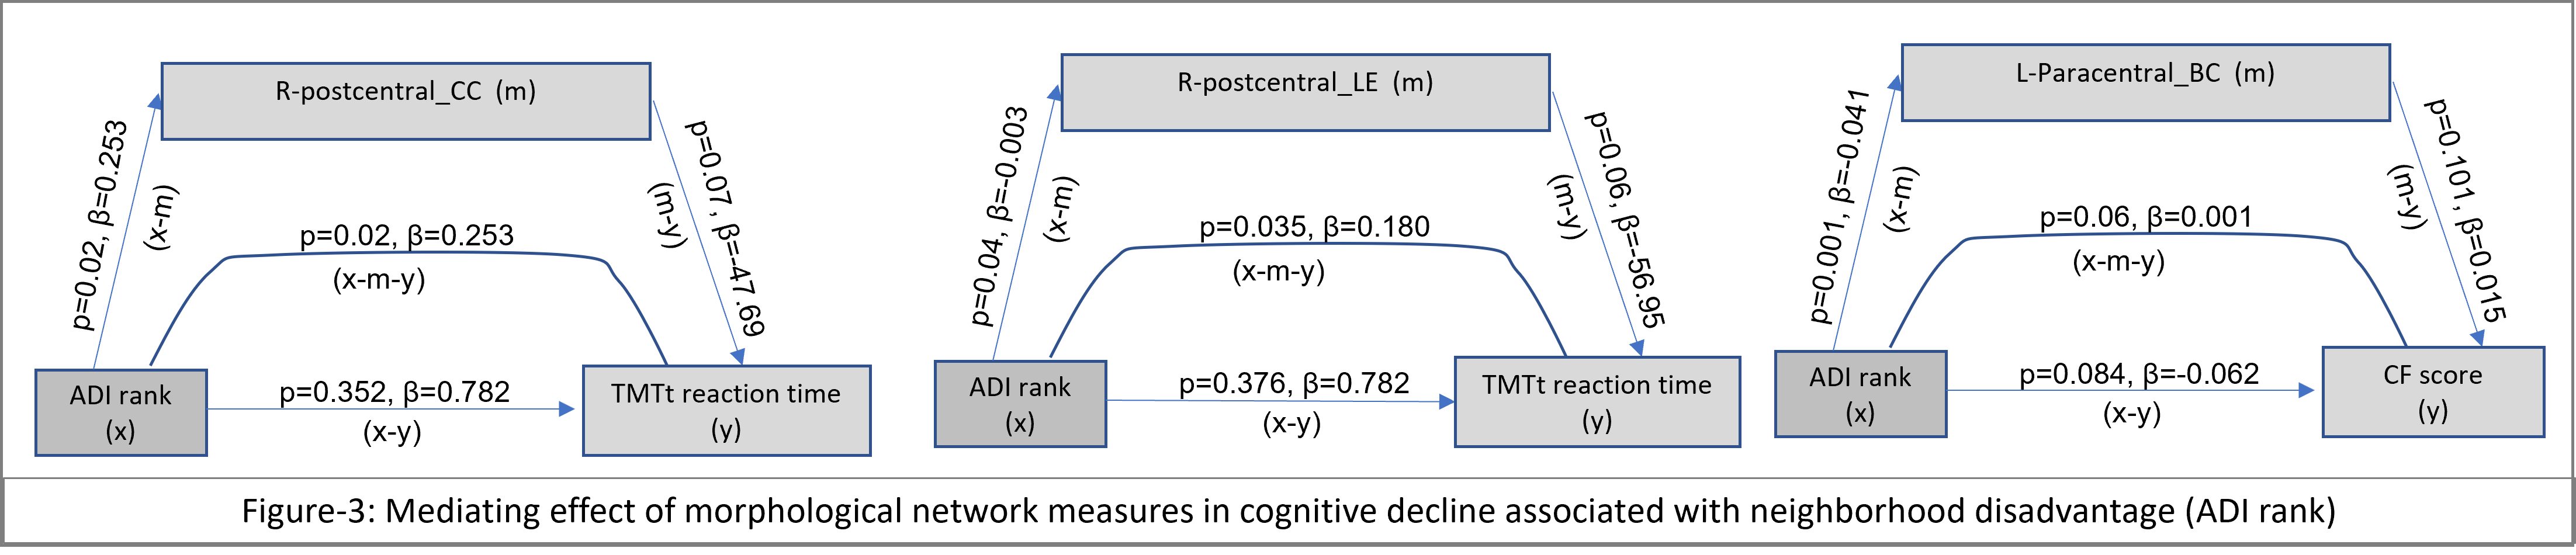
Neighborhood disadvantage showed negative association with RAVLT score (β=-5.996, p=9.082e-06), CF (β=-0.185, p=0.82) and PACC scores (β=-0.05, p=0.78), while positive associations were seen with TMTrt (β=4.680, p=0.37). Local network features demonstrated significant association with ADI ranks (Figure 2). Specifically, centrality of left shemispheric caudalmiddlefrontal, medialorbitofrontal and paracentral region was positively related to ADI rank, whereas CC of postcentral region showed a negative association with ADI rank. These frontoparietal regions are associated with worse executive functioning in AD7,8 . Our results (Figure-3) suggest a marginal mediating effect demonstrated by these regions, suggesting altered connectivity of LE and CC in the right postcentral cortices partially mediated the ADI-associated slower reaction time relationship on TMTrt, while centrality of left paracentral region mediated relationship between cognitive performance on CF test and neighborhood disadvantage.Conclusion:
Cortical disorganization of fronto-parietal brain regions was associated with worse cognitive performance among participants with greater neighborhood disadvantage. These findings support the impact of neighborhood disadvantage on cognitive outcomes, and provide a connectivity based mechanism that may explain risk for cognitive decline and dementia. Future work will examine the dose and timing of neighborhood disadvantage on structural connectivity.Acknowledgements
No acknowledgement found.References
1. US Department of Health and Human Services. Healthy People 2020: An Opportunity to Address Societal Determinants of Health in the United States. 2010. Available at: healthypeople.gov/2010/hp2020/advisory/SocietalDeterminantsHealth.htm. 2. Kind AJH, Jencks S, Brock J, et al. Neighborhood socioeconomic disadvantage and 30day rehospitalization: a retrospective cohort study. Ann Intern Med 2014;161:765 3. Hunt, J. F., Buckingham, W., Kim, A. J., Oh, J., Vogt, N. M., Jonaitis, E. M., & Bendlin, B. B. (2020). Association of neighborhood-level disadvantage with cerebral and hippocampal volume. JAMA neurology, 77(4), 451-460. 4. Hunt, J. F., Vogt, N. M., et al., “Association of neighborhood context, cognitive decline, and cortical change in an unimpaired cohort,” Neurology 96(20), e2500–e2512 (2021). 5. Johnson, S. C. et al., “The wisconsin registry for alzheimer’s prevention: a review of findings and current directions,” Alzheimer’s & Dementia: Diagnosis, Assessment & Disease Monitoring 10, 130–142 (2018). 6. Seiger R, Ganger S, Kranz GS, Hahn A, Lanzenberger R. Cortical thickness estimations of FreeSurfer and the CAT12 Toolbox in patients with Alzheimer’s disease and healthy controls: cortical thickness of FreeSurfer and CAT12. J Neuroimaging 2018; 28:515–523. 7. Dhanjal, N. S., & Wise, R. J. (2014). Frontoparietal cognitive control of verbal memory recall in Alzheimer's disease. Annals of neurology, 76(2), 241-251. 8. Van Hoesen, G. W., Parvizi, J., & Chu, C. C. (2000). Orbitofrontal cortex pathology in Alzheimer's disease. Cerebral Cortex, 10(3), 243-251.Figures
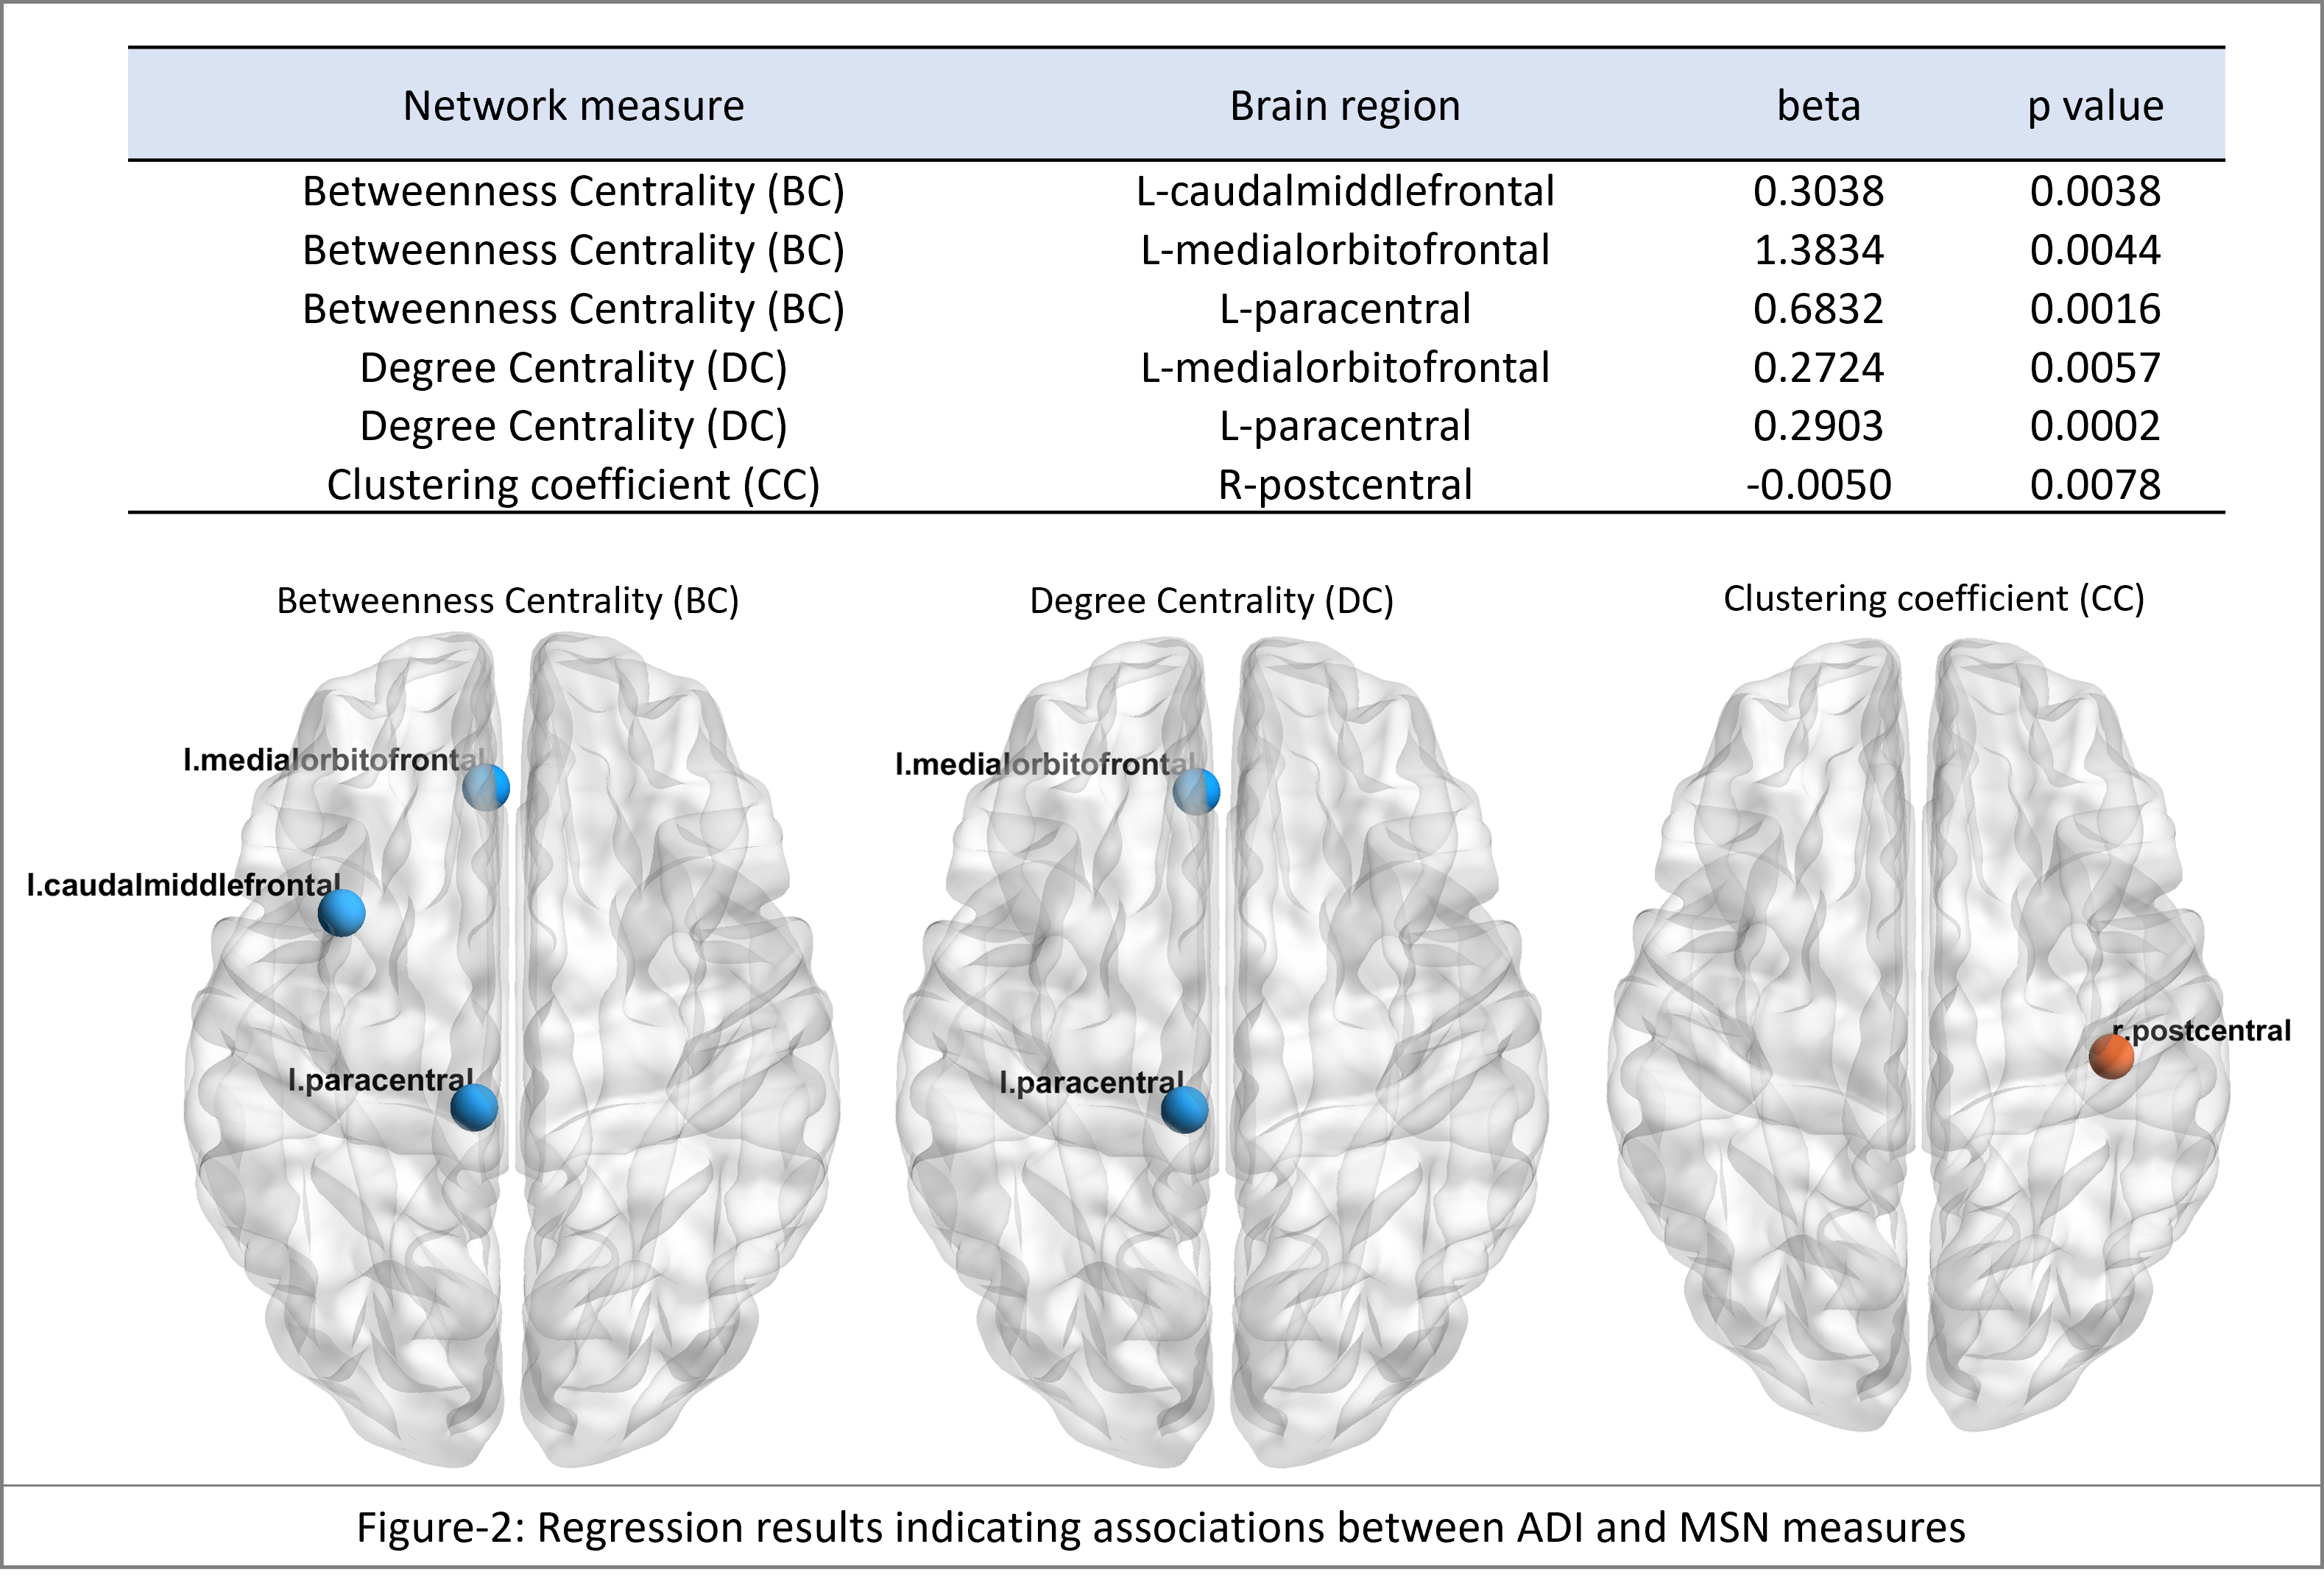
Regression results indicating associations between ADI and MSN measures