3136
High-resolution fMRI mapping of ocular dominance columns at laminar level in cat visual cortex1University of Minnesota, Minneapolis, MN, United States
Synopsis
Keywords: Task/Intervention Based fMRI, fMRI (task based), ocular dominance column
Motivation: Most fMRI column studies don’t consider the potentially different laminar responses along the cortical depth.
Goal(s): In this work, we demonstrate the feasibility of mapping ocular dominance columns (ODCs) at multiple cortical depths in the cat visual cortex using CBV-weighted fMRI.
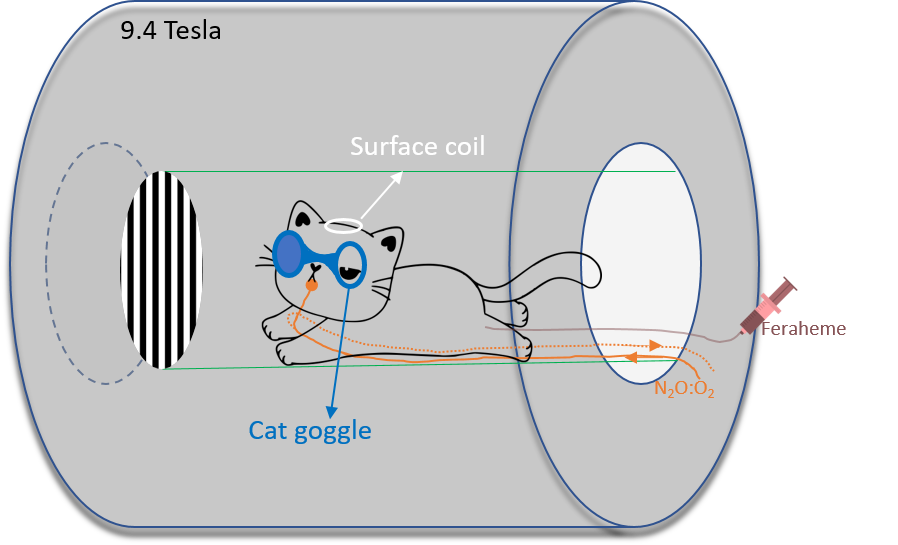
Approach: To enable monocular input to either eye of a cat, we customized a cat goggle that can avoid light leakage and switch eyes easily.
Results: By employing mesoscopic fMRI at ultrahigh magnetic field (9.4 Tesla), we observed relatively irregular ODC stripes in the cat visual cortex with a large width and length variation, extending across the cortex with varying response strength.
Impact: The successful ODC mapping across multiple cortical depths using high-resolution fMRI in the cat brain enables investigation of layer-specific neural circuits and column mapping on the effect of combined stimulus dimensions at both the thalamocortical and intracortical level.
Introduction
Functional column mapping using high-resolution fMRI1-9 has deepened our understanding on the topological architecture of the primary cortex. However, most studies assume a uniform response across either the entire cortical depth or a thick layer of the cortex, thus ignoring the different columnar responses across laminar layers. To fill the gap, we investigate the feasibility of mapping the ocular dominance columns (ODCs) at different cortical depths in the cat visual cortex using high-resolution fMRI at ultrahigh field (UHF) of 9.4 Tesla (T).Although ODCs in cat visual cortex have been recognized with other imaging techniques10-18, they have not been mapped using fMRI due to the complex experimental implementation of the monocular input and limited spatial resolution19. In this work, we overcame the first difficulty by designing a cat goggle that enables monocular input with minimum light leakage to the other eye, thus, to improve the contrast of the fMRI signals in response to left and right eye visual stimulation. Second, we applied mesoscopic fMRI at UHF to map cat ODCs at multiple cortical depths.
Materials and Methods
Animals and scan conditions: Two cats (~1.8 kg) were scanned with a protocol approved by the UMN IACUC. Each cat was initially anesthetized with ketamine and Xylazine cocktail (intramuscular injection), followed by 0.8-1.1% isoflurane during the imaging experiment. IV catheter was placed to allow infusion of Feraheme contrast agent for performing CBV-weighted (CBVw) fMRI studies. A customized cat goggle was designed, and 3D printed to allow monocular visual inputs. Each eye was stimulated alternatively during fMRI measurement with a block design stimulation. The schematic setup of experiment was shown in Fig. 1.MRI experiments and data analysis: In-vivo cat task fMRI data were acquired on a 9.4T/31cm (bore size) scanner (Varian/VNMRJ). CBVw-based fMRI signals were collected using a 1H surface coil (1.5cm diameter) and 2D GE-EPI with TR/TE = 1000/10 ms, in-plane resolution = 0.156 mm, slice thickness = 0.5mm, 2 segments, centric-out acquisition. A total of 35 runs, each comprising 101 volumes, were obtained for each eye input. The fMRI data were motion corrected and Gaussian smoothed (FWHM = 0.3 mm). GLM was used to generate CBVw functional response maps. The ODC maps were generated by subtracting normalized CBVw percent change maps for single eye input. The length and width of the ODC stripes were quantified at depth of 0.7 mm and 1.2 mm from the cortical surface. Cross-validation was used to test the fidelity of the ODC maps.
Results
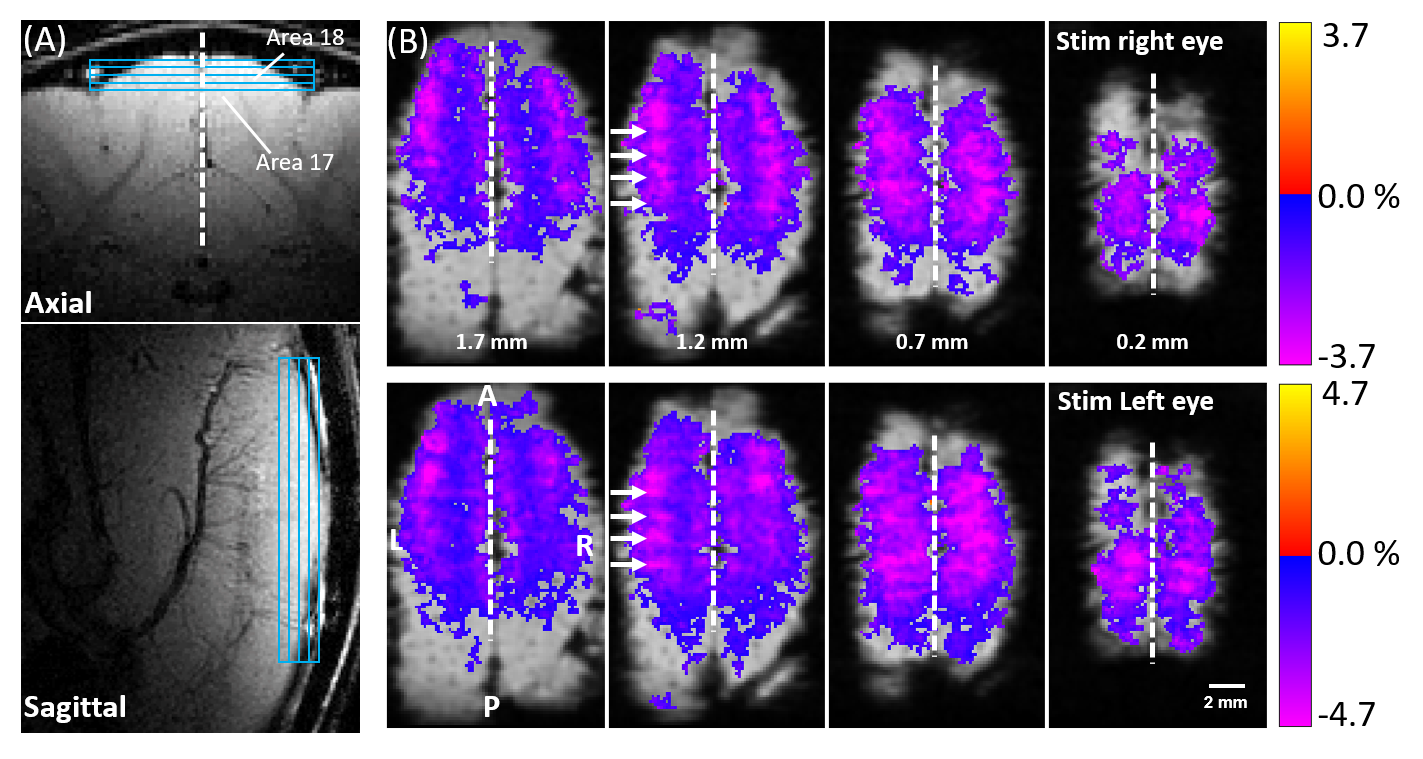
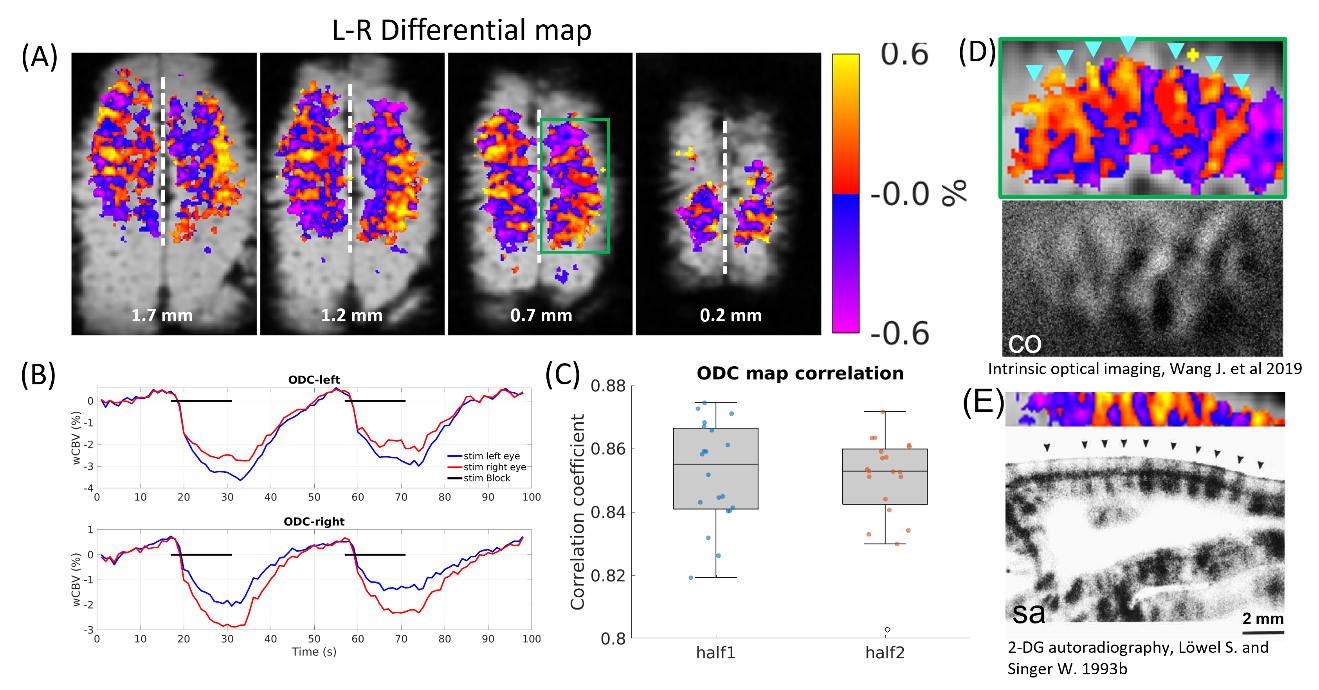
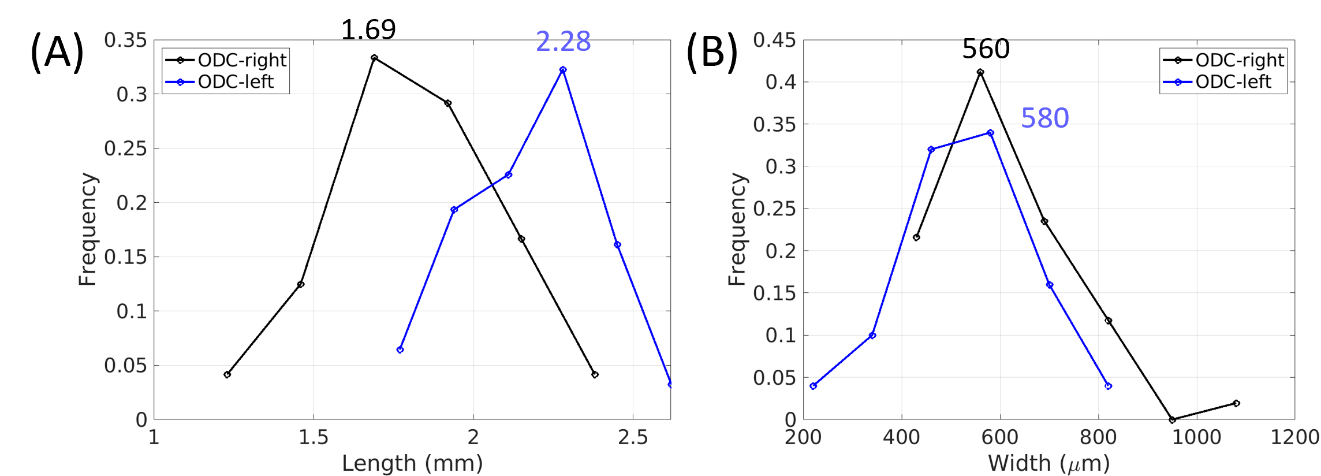
Figure 2A shows the fMRI coronal slice localization in axial and sagittal anatomical images of the cat visual cortex. CBVw percent signal change maps after GLM fitting for right eye and left eye input were shown in Fig. 2B. The functional response was the strongest in the middle slices (0.7 – 1.2 mm from the cortical surface), forming alternating stripe-like structures in response to left- and right-eye stimulation (Fig. 2B). Figure 3A shows ODCs that respond dominantly to right eye input (red-yellow) or left eye input (blue-purple) at multiple depths, along with their averaged time courses (Fig. 3B). The ODC maps obtained by half randomly selected data in 20 trials were highly correlated to the ODC map obtained from all data (Fig. 3C). The enlarged ODCs at 0.7 mm depth in the right hemisphere are shown in Fig. 3D, where the ipsilateral ODCs (red-orange color) are labeled by cyan triangles. These in-plane ODC stripes were similar to those observed by using intrinsic optical imaging20. In contrast, the ocular dominance response across the cortical depth forms columns (Fig. 3E), but not as straight and uniform as those labeled by 2-DG autoradiography21. Based on the ODC maps, we manually measured the length and width of the eye-dominating OD stripes (Fig. 4). According to the measurement, most of the right-eye dominating ODCs were about 1.69 mm long and 560 µm wide. In contrast, most of the left-eye dominating ODCs were about 2.28 mm long and 580 µm wide.Discussion and Conclusion
We have noninvasively mapped cat ODCs at different cortical depths using high-resolution fMRI at UHF. The ODC stripes observed in this work are relatively irregular, which may be caused by the smaller number of lateral geniculate nucleus neurons and smaller primary cortex area compared to those in human22. In addition, the ocular dominance stripes extend across the cortex, forming non-uniform columnar structures. Finally, a relatively large difference was observed between the length of the eye dominated ODCs rather than the width, consistent with the same trend observed in the previous report18.Acknowledgements
This work was supported in part by NIH grants of R01 MH111413, U01 EB026978, S10 RR025031, WM KECK Foundation, P41 EB027061.References
1. Zimmermann, J. et al. Mapping the Organization of Axis of Motion Selective Features in Human Area MT Using High-Field fMRI. Plos One 6, doi:ARTN e28716 10.1371/journal.pone.0028716 (2011).
2. Cheng, K., Waggoner, R. A. & Tanaka, K. Human ocular dominance columns as revealed by high-field functional magnetic resonance imaging. Neuron 32, 359-374, doi:Doi 10.1016/S0896-6273(01)00477-9 (2001).
3. Fukuda, M., Moon, C. H., Wang, P. & Kim, S. G. Mapping iso-orientation columns by contrast agent-enhanced functional magnetic resonance imaging: reproducibility, specificity, and evaluation by optical imaging of intrinsic signal. J Neurosci 26, 11821-11832, doi:10.1523/JNEUROSCI.3098-06.2006 (2006).
4. Goodyear, B. G. & Menon, R. S. Brief visual stimulation allows mapping of ocular dominance in visual cortex using fMRI. Hum Brain Mapp 14, 210-217, doi:10.1002/hbm.1053 (2001).
5. Menon, R. S., Ogawa, S., Strupp, J. P. & Ugurbil, K. Ocular dominance in human V1 demonstrated by functional magnetic resonance imaging. Journal of Neurophysiology 77, 2780-2787 (1997).
6. Sun, P. et al. A temporal frequency-dependent functional architecture in human V1 revealed by high-resolution fMRI. Nat Neurosci 10, 1404-1406, doi:10.1038/nn1983 (2007).
7. Yacoub, E., Harel, N. & Ugurbil, K. High-field fMRI unveils orientation columns in humans. P Natl Acad Sci USA 105, 10607-10612, doi:10.1073/pnas.0804110105 (2008).
8. Yacoub, E., Shmuel, A., Logothetis, N. & Ugurbil, K. Robust detection of ocular dominance columns in humans using Hahn Spin Echo BOLD functional MRI at 7 Tesla. Neuroimage 37, 1161-1177, doi:10.1016/j.neuroimage.2007.05.020 (2007).
9. Zhang, N. Y., Zhu, X. H., Yacoub, E., Ugurbil, K. & Chen, W. Functional MRI mapping neuronal inhibition and excitation at columnar level in human visual cortex. Experimental Brain Research 204, 515-524, doi:10.1007/s00221-010-2318-z (2010).
10. Shatz, C. J. & Stryker, M. P. Ocular dominance in layer IV of the cat's visual cortex and the effects of monocular deprivation. J Physiol 281, 267-283, doi:10.1113/jphysiol.1978.sp012421 (1978).
11. LeVay S, S. M., Shatz CJ. Ocular dominance columns and their development in layer IV of the cat's visual cortex: a quantitative study. J Comp Neurol. 179(1), doi:10.1002/cne.901790113 (1978).
12. Löwel, S. & Singer, W. The pattern of ocular dominance columns in flat-mounts of the cat visual cortex. Exp Brain Res 68, 661-666, doi:10.1007/bf00249809 (1987).
13. Lowel, S., Bischof, H. J., Leutenecker, B. & Singer, W. Topographic Relations between Ocular Dominance and Orientation Columns in the Cat Striate Cortex. Experimental Brain Research 71, 33-46 (1988).
14. Rathjen, S., Schmidt, K. E. & Lowel, S. Two-dimensional analysis of the spacing of ocular dominance columns in normally raised and strabismic kittens. Exp Brain Res 145, 158-165, doi:10.1007/s00221-002-1086-9 (2002).
15. Kaschube, M. et al. The pattern of ocular dominance columns in cat primary visual cortex: intra- and interindividual variability of column spacing and its dependence on genetic background. European Journal of Neuroscience 18, 3251-3266, doi:10.1111/j.1460-9568.2003.02979.x (2003).
16. Anderson, P. A., Olavarria, J. & Vansluyters, R. C. The Overall Pattern of Ocular Dominance Bands in Cat Visual-Cortex. Journal of Neuroscience 8, 2183-2200 (1988).
17. Kremkow, J., Jin, J., Wang, Y. & Alonso, J. M. Principles underlying sensory map topography in primary visual cortex. Nature 533, 52-57, doi:10.1038/nature17936 (2016).
18. Najafian, S., Jin, J. Z. & Alonso, J. M. Diversity of Ocular Dominance Patterns in Visual Cortex Originates from Variations in Local Cortical Retinotopy. Journal of Neuroscience 39, 9145-9163, doi:10.1523/Jneurosci.1151-19.2019 (2019).
19. Zhang, N., Zhu, X. H., Zhang, Y., Park, J. K. & Chen, W. High-resolution fMRI mapping of ocular dominance layers in cat lateral geniculate nucleus. Neuroimage 50, 1456-1463, doi:10.1016/j.neuroimage.2010.01.053 (2010).
20. Wang, J., Ni, Z. Y., Jin, A. Q., Yu, T. D. & Yu, H. B. Ocular Dominance Plasticity of Areas 17 and 21a in the Cat. Front Neurosci-Switz 13, doi:ARTN 103910.3389/fnins.2019.01039 (2019).
21. Lowel, S. & Singer, W. Monocularly Induced 2-Deoxyglucose Patterns in the Visual-Cortex and Lateral Geniculate-Nucleus of the Cat .2. Awake Animals and Strabismic Animals. European Journal of Neuroscience 5, 857-869, doi:DOI 10.1111/j.1460-9568.1993.tb00938.x (1993).
22. Kremkow, J. & Alonso, J. M. Thalamocortical Circuits and Functional Architecture. Annu Rev Vis Sci 4, 263-285, doi:10.1146/annurev-vision-091517-034122 (2018).
Figures