3134
Multiple Loci for Foveolar Vision in Macaque Monkey1Department of Neurosurgery of the Second Affiliated Hospital and Interdisciplinary Institute of Neuroscience and Technology, School of Medicine, Zhejiang University, Hangzhou, China, 2MOE Frontier Science Center for Brain Science and Brain-Machine Integration, Zhejiang University, Hangzhou, China, 3College of Electrical Engineering, Zhejiang University, Hangzhou, China, 4Key Laboratory for Biomedical Engineering of Ministry of Education, College of Biomedical Engineering and Instrument Science, Zhejiang University, Hangzhou, China
Synopsis
Keywords: Task/Intervention Based fMRI, Neuroscience, foveolar vision;ultra-high field fMRI; awake monkey
Motivation: Foveolar vision (central 1º of vision) is important for many visual behaviors; however, its cortical representation is poorly understood.
Goal(s): To understand the functional organization of foveolar visual cortex in macaque monkey.
Approach: Use human 7T to conduct fMRI of foveal visual cortex at submillimeter resolution (0.6mm in-plane) in awake fixating macaque monkeys.
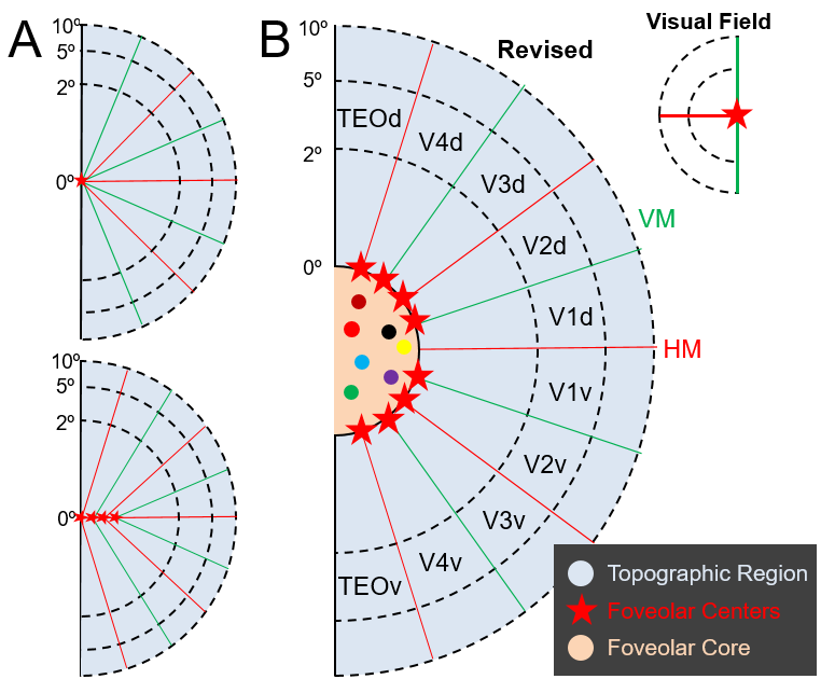
Results: We found at least 8 distinct loci of foveolar representation per hemisphere, one each for dorsal and ventral V1/V2, V2/V3, V3/V4, V4/TEO. These loci surround a substantial cortical territory (the foveolar core) which lies outside topographic cortex.
Impact: The foveolar core may represent a higher-order specialization for foveal behaviors.
Methods: Functional EPI images (0.6×0.6×1mm3 acquired in 7T MRI with a customized 16-channel RF coil10) were acquired from two macaque monkeys trained to fixate small (0.4º–0.8º) visual stimuli. fMRI data were screened for runs with precise fixations. Visuotopic maps were obtained using fine (0.15º) lines and arcs. Custom FreeSurfer methods transformed slice data to surface view.
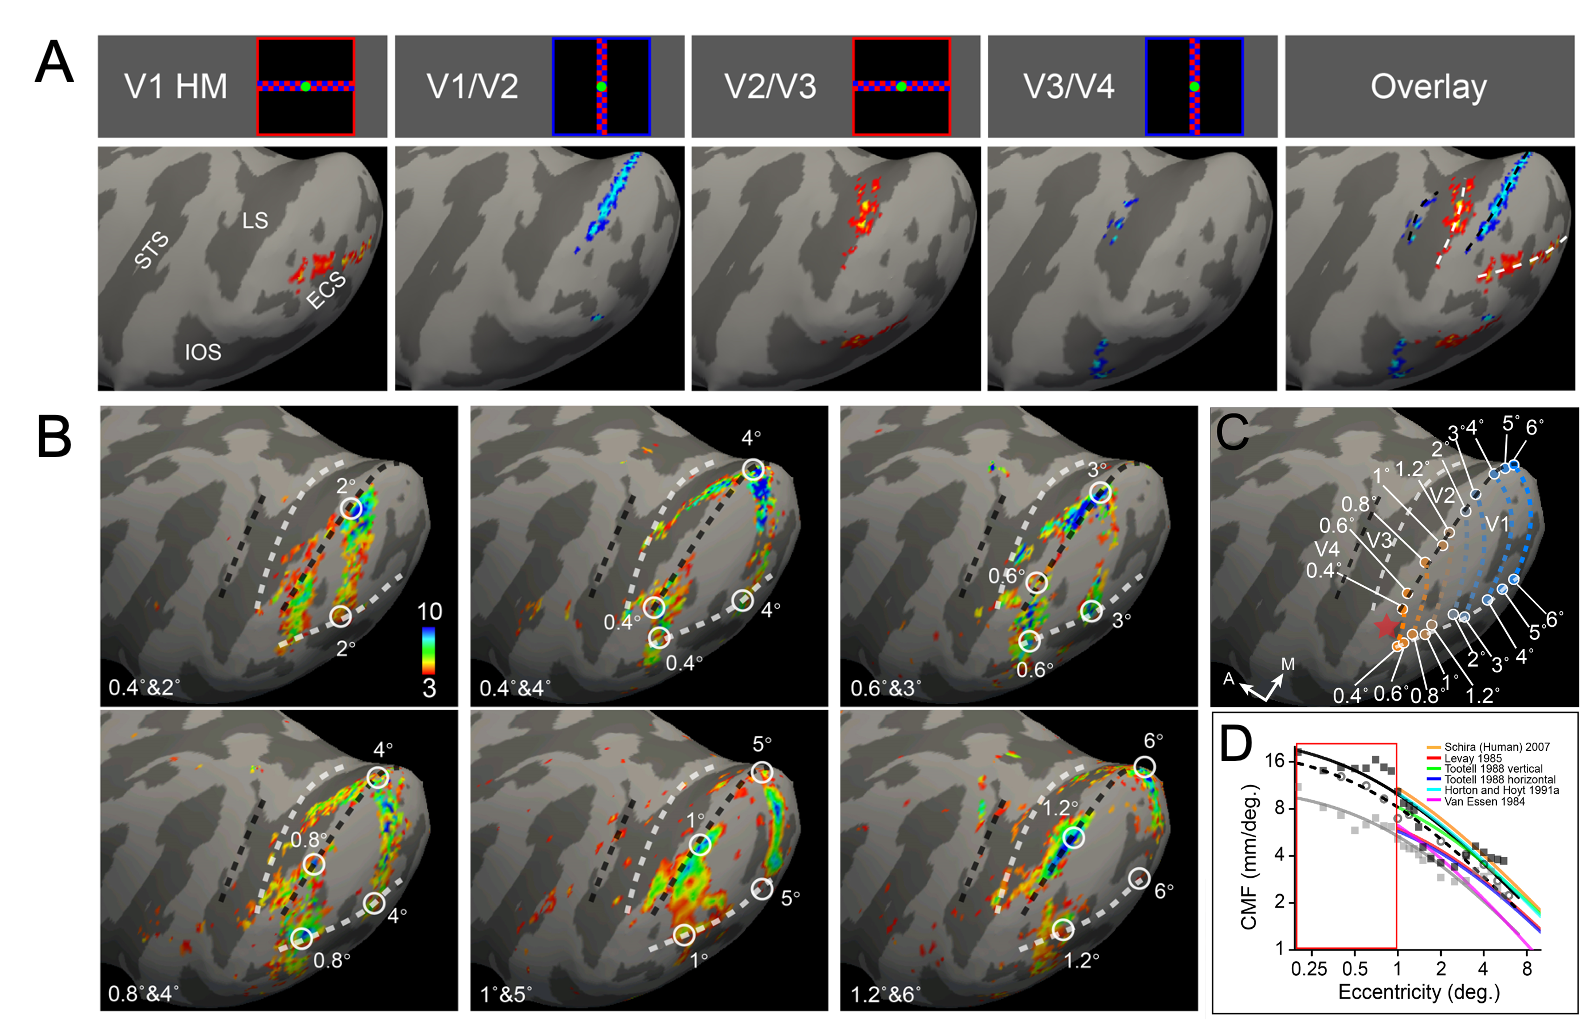
Results: Visual areas V1, V2, V3, V4, and TEO were identified by mapping the representations of vertical (VM) and horizontal meridia (HM) using very fine (0.15°) visual lines (Fig. 1A) and (0.15°) iso-eccentricity arcs (Fig. 1B). Within V1, cortical magnification factors were consistent with previous studies11-18 and provided novel data within the central 1° (Fig. 1C & 1D).
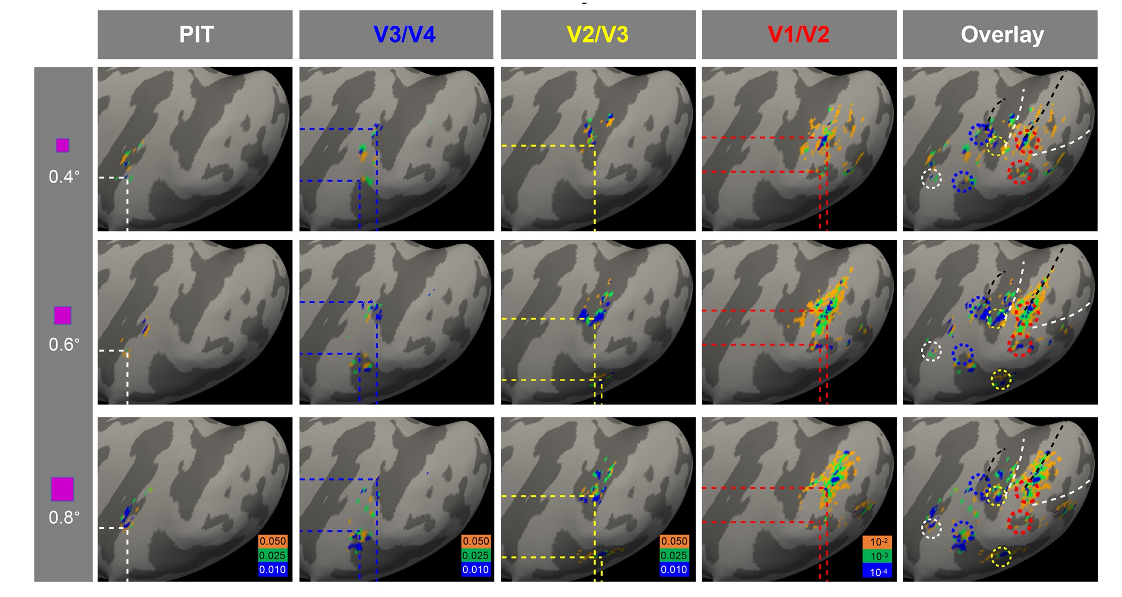
In a well-trained, fixating monkeys, despite presence of micro-saccades, focal center-of-mass foveolar activations were observed (Fig. 2). These foveolar activation foci were on the lateral operculum, at the central-most locations of the topographic maps in V1/V2, V2/V3, V3/V4, and V4/TEO. Two foveolar loci were observed per area, one each in ventral and dorsal fields. These foveolar activations formed a network of foveolar representations which encircled a substantial area of cortex which we termed the “foveolar core”. As shown by careful visuotopic mapping, the core is not part of the visuotopic visual maps: the HM (red) and VM (blue) maps (from Fig. 1A) terminate at foveolar loci (yellow circles) and do not invade the core, suggesting the core is clearly outside the classical visuotopic maps.
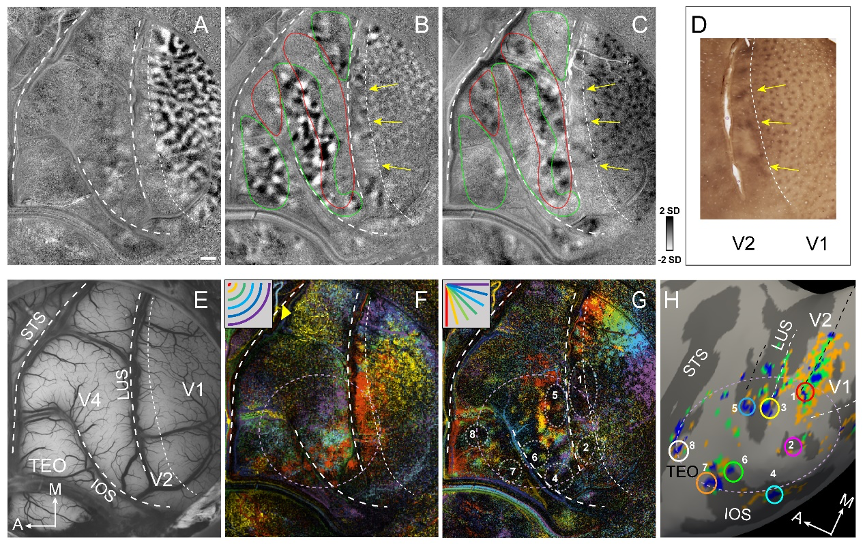
This finding was further confirmed with optical imaging (Fig. 3). In V1/V2, the map converges to a black locus at the V1/V2 border (dotted ovals #1 and #2) which overlies the dorsal and ventral V1/V2 foveal representations (overlying red pixels in Fig. 3F). In V4, there is a dark locus posterior to the V1/V2 foveal center (Fig. 3G, #5). At the border between V4 and TEO (overlying the IOS), two other foveal locations (#4 and #6) on the lip of the IOS may correspond to the ventral V2v/V3v and V3v/V4v foveolar locations. There may be additional dark foveal loci on to the V4v/TEO border (#7) and another one (#8) corresponding to the TEO/FST border. Locations #3 (dorsal V2/V3 border) are likely buried within the lunate sulcus and are not visible in the optical images.
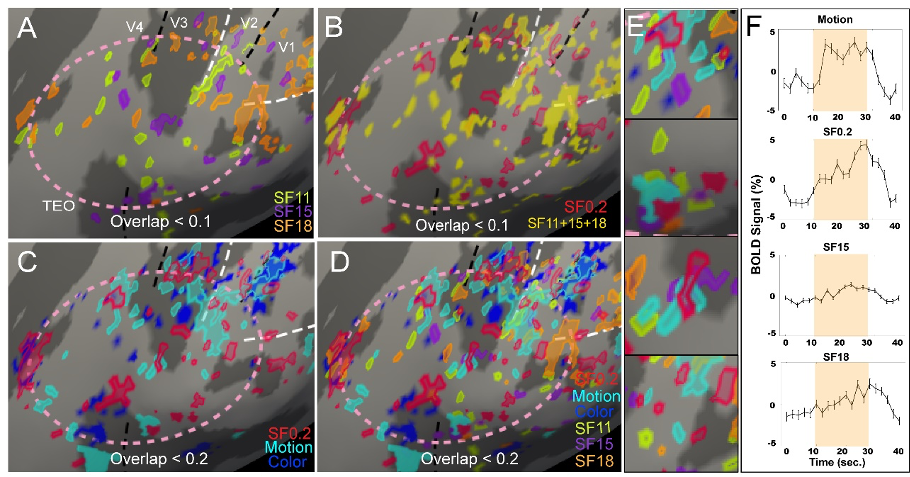
The foveolar core is populated by mm-scale functional domains (Fig. 4). We observed domains responsive to extremely high spatial frequencies (11,15,18 cyc/deg). Functional domains with such high spatial frequency preference have not previously been observed and is consistent with the needs of high spatial acuity foveolar vision. We also observed domains which exhibited preference for color and motion.
The foveolar core is a large area, measuring 180 mm2 and 302 mm2 (for left and right hemispheres of Monkey E) and 291 mm2 and 271 mm2 (for Monkey J). This is a quite substantial area given that the area of V1 ranges from ~800mm2–1500mm2.
Discussion:Our results show that the use of ultra-high field fMRI mapping and small foveolar stimuli in well-trained fixating monkeys enable precise mapping of foveolar cortical locations. In contrast to previous models of foveal representation (Fig. 5A), the foveolar core is a newly identified cortical region outside the standard visuotopic regions and encircled by several foveolar representations (Fig. 5B). Given its proximity to foveolar loci of several visual areas with different spatial resolutions (small to large receptive field sizes) and complexity (local to global feature specificity), we suggest this region may be a higher-order cortical specialization for foveolar vision in primates.
Acknowledgements
We thank Wim Vanduffel and Doris Tsao for their help on the set-up of awake monkey in MRI at the early stage of this study. We thank Hisashi Tanigawa for the help and suggestions on monkey training system. We thank Pinyi Wang for help with scanning and Weihan Li for help with data analysis. This research was supported by National Key Research and Development Program of China (2018YFA0701400) (to A.W.R. and X.Z.); STI 2030 - Major Projects (2021ZD0200401); National Natural Science Foundation of China U1909205 and 31627802 (to A.W.R.), 52277232, 81701774 and 61771423 (to X.Z.), 52307256 (to Y.G.), and 32100802 (to J.M.H); Key Research and Development Program of Zhejiang Province 2020C03004 (to A.W.R.); the Fundamental Research Funds for the Central Universities 2019XZZX003-20 (to A.W.R.) and 226-2-22-00136 (to X.Z.). China Postdoctoral Science Foundation 2020M681829 (to J.M.H.) and 2020M681866 (to Y.G.).References
1. Krubitzer, L. & Kaas, J. The evolution of the neocortex in mammals: how is phenotypic diversity generated? Curr Opin Neurobiol 15, 444–453 (2005).2. Petersen, C. C. H. The functional organization of the barrel cortex. Neuron 56, 339–355 (2007).3. Gregory, J. E., Iggo, A., McIntyre, A. K. & Proske, U. Electroreceptors in the platypus. Nature 326, 386–387 (1987).4. McGregor, J. E. et al. Functional architecture of the foveola revealed in the living primate. PLoS One 13, e0207102 (2018).5. Roorda, A. & Williams, D. R. The arrangement of the three cone classes in the living human eye. Nature 397, 520–522 (1999).6. Poletti, M., Rucci, M. & Carrasco, M. Selective attention within the foveola. Nat Neurosci 20, 1413–1417 (2017).7. Bichot, N. P., Schall, J. D. & Thompson, K. G. Visual feature selectivity in frontal eye fields induced by experience in mature macaques. Nature 381, 697–699 (1996).8. McDonald, S. A. & Shillcock, R. C. The implications of foveal splitting for saccade planning in reading. Vision Res 45, 801–820 (2005).9. Livingstone, M. S. et al. Development of the macaque face-patch system. Nat Commun 8, 14897 (2017).10. Zhang, X. et al. A 16-Channel Dense Array for In Vivo Animal Cortical MRI/fMRI on 7T Human Scanners. IEEE Trans Biomed Eng 68, 1611–1618 (2021).11. Schira, M. M., Tyler, C. W., Breakspear, M. & Spehar, B. The foveal confluence in human visual cortex. J Neurosci 29, 9050–9058 (2009).12. Dow, B. M., Snyder, A. Z., Vautin, R. G. & Bauer, R. Magnification factor and receptive field size in foveal striate cortex of the monkey. Exp Brain Res 44, 213–228 (1981).13. Schira, M. M., Wade, A. R. & Tyler, C. W. Two-dimensional mapping of the central and parafoveal visual field to human visual cortex. J Neurophysiol 97, 4284–4295 (2007).14. Daniel, P. M. & Whitteridge, D. The representation of the visual field on the cerebral cortex in monkeys. J Physiol 159, 203–221 (1961).15. Gattass, R., Gross, C. G. & Sandell, J. H. Visual topography of V2 in the macaque. J Comp Neurol 201, 519–539 (1981).16. Gattass, R., Sousa, A. P. & Gross, C. G. Visuotopic organization and extent of V3 and V4 of the macaque. J Neurosci 8, 1831–1845 (1988).17. Dow, B. M., Vautin, R. G. & Bauer, R. The mapping of visual space onto foveal striate cortex in the macaque monkey. J Neurosci 5, 890–902 (1985).18. Tootell, R. B., Switkes, E., Silverman, M. S. & Hamilton, S. L. Functional anatomy of macaque striate cortex. II. Retinotopic organization. J Neurosci 8, 1531–1568 (1988).Figures