3130
High resolution fMRI identifies distinct patterns in myogenic (breath hold) and neurogenic (visual) BOLD responses1Athinoula A. Martinos Center for Biomedical Imaging, Massachusetts General Hospital, Charlestown, MA, United States, 2Department of Radiology, Harvard Medical School, Boston, MA, United States, 3Department of Electrical Engineering and Computer Science, Massachusetts Institute of Technology, Cambridge, MA, United States, 47. Harvard-MIT Division of Health Sciences and Technology, Massachusetts Institute of Technology, Cambridge, MA, United States
Synopsis
Keywords: fMRI Analysis, fMRI
Motivation: Vascular biases in BOLD fMRI hinder the interpretation of neural activity from hemodynamics. Correction methods based on myogenic challenges hold promise in improving specificity, but their limitations for high-resolution imaging have not been fully explored.
Goal(s): To compare neurogenic and myogenic responses and quantify the extent to which biases can be removed in high-resolution imaging.
Approach: We imaged visual and breathhold responses and compared the amplitude and delay of responses across V1 and across cortical depths.
Results: Amplitude calibration virtually eliminated intercortical and interregional biases even in small ROIs within V1. Delay calibration was not effective, due to different delay patterns across conditions.
Impact: BOLD amplitude calibration with breathhold tasks can suppress biases in BOLD estimates across cortical depths and ROIs. However, our work highlights fundamental differences in the dynamics of myogenic and neurogenic responses that precluded satisfactory calibration of hemodynamic delays.
Introduction
BOLD responses are strongly biased by the vascular architecture7,9,10,11, reducing the specificity of BOLD to sites of activation, and imparts difficulties in investigating neural activity with fMRI. Understanding and correcting the biases in the BOLD signal is crucial for accurate interpretation of signals across regions and individuals. A common correction strategy involves using myogenic (breathhold/ cerebrovascular reactivity (CVR)) stimulation to elicit vascular responses without changes in neuronal activity, and use these myogenic response maps to normalize responses to neuronal stimulation4,3,12. Nonetheless, mounting evidence suggests that discrepancies exist between myogenic and neuronal responses5,6, impacting proper normalization. Here we aimed to explore the relationship between myogenic and neuronal hemodynamic responses obtained via breatholding challenges and visual stimulation in detail across vascular compartments. To enable high spatial resolution, data were acquired at 7T using 1.6mm-isotropic voxels with whole-brain BOLD imaging. We then compared the amplitude and delay of myogenic and neurogenic responses as a function of location within V1 and as a function of cortical depth (as a proxy for vascular architecture).Methods
Data were acquired from 7 participants in a Siemens 7T Terra with a 64ch coil8. One anatomical MEMPRAGE, two breathhold (10-min; blocks 15s hold / 45s free-breathing) and one visual (5-min; 12Hz flickering checkerboard; blocks 15s ON/ 45s OFF) BOLD fMRI scans were collected. Functional scans had 1.60mm isotropic resolution, MB2/GRAPPA4, TE/TR=15/1150ms, flip=41°, ES=0.60ms. After slice-time and motion-correction, activation maps were obtained using FSL FEAT. BOLD percent signal amplitudes were obtained within the areas active in the visual run (Z>3.1). Anatomical images were used for cortical segmentation and delineation of anterior and posterior V1 ROIs. Temporal delays were obtained by cross-correlating each voxels' signal to the mean activated ROI signal. Amplitudes were obtained by averaging trials and computing the max-min of the response. Delays and amplitudes were compared across stimuli, across cortical depths and location in V1. Amplitude calibration was performed by dividing the visual by the breathold amplitude. Delay calibration entailed subtracting breathold delays from the visual delays.Results
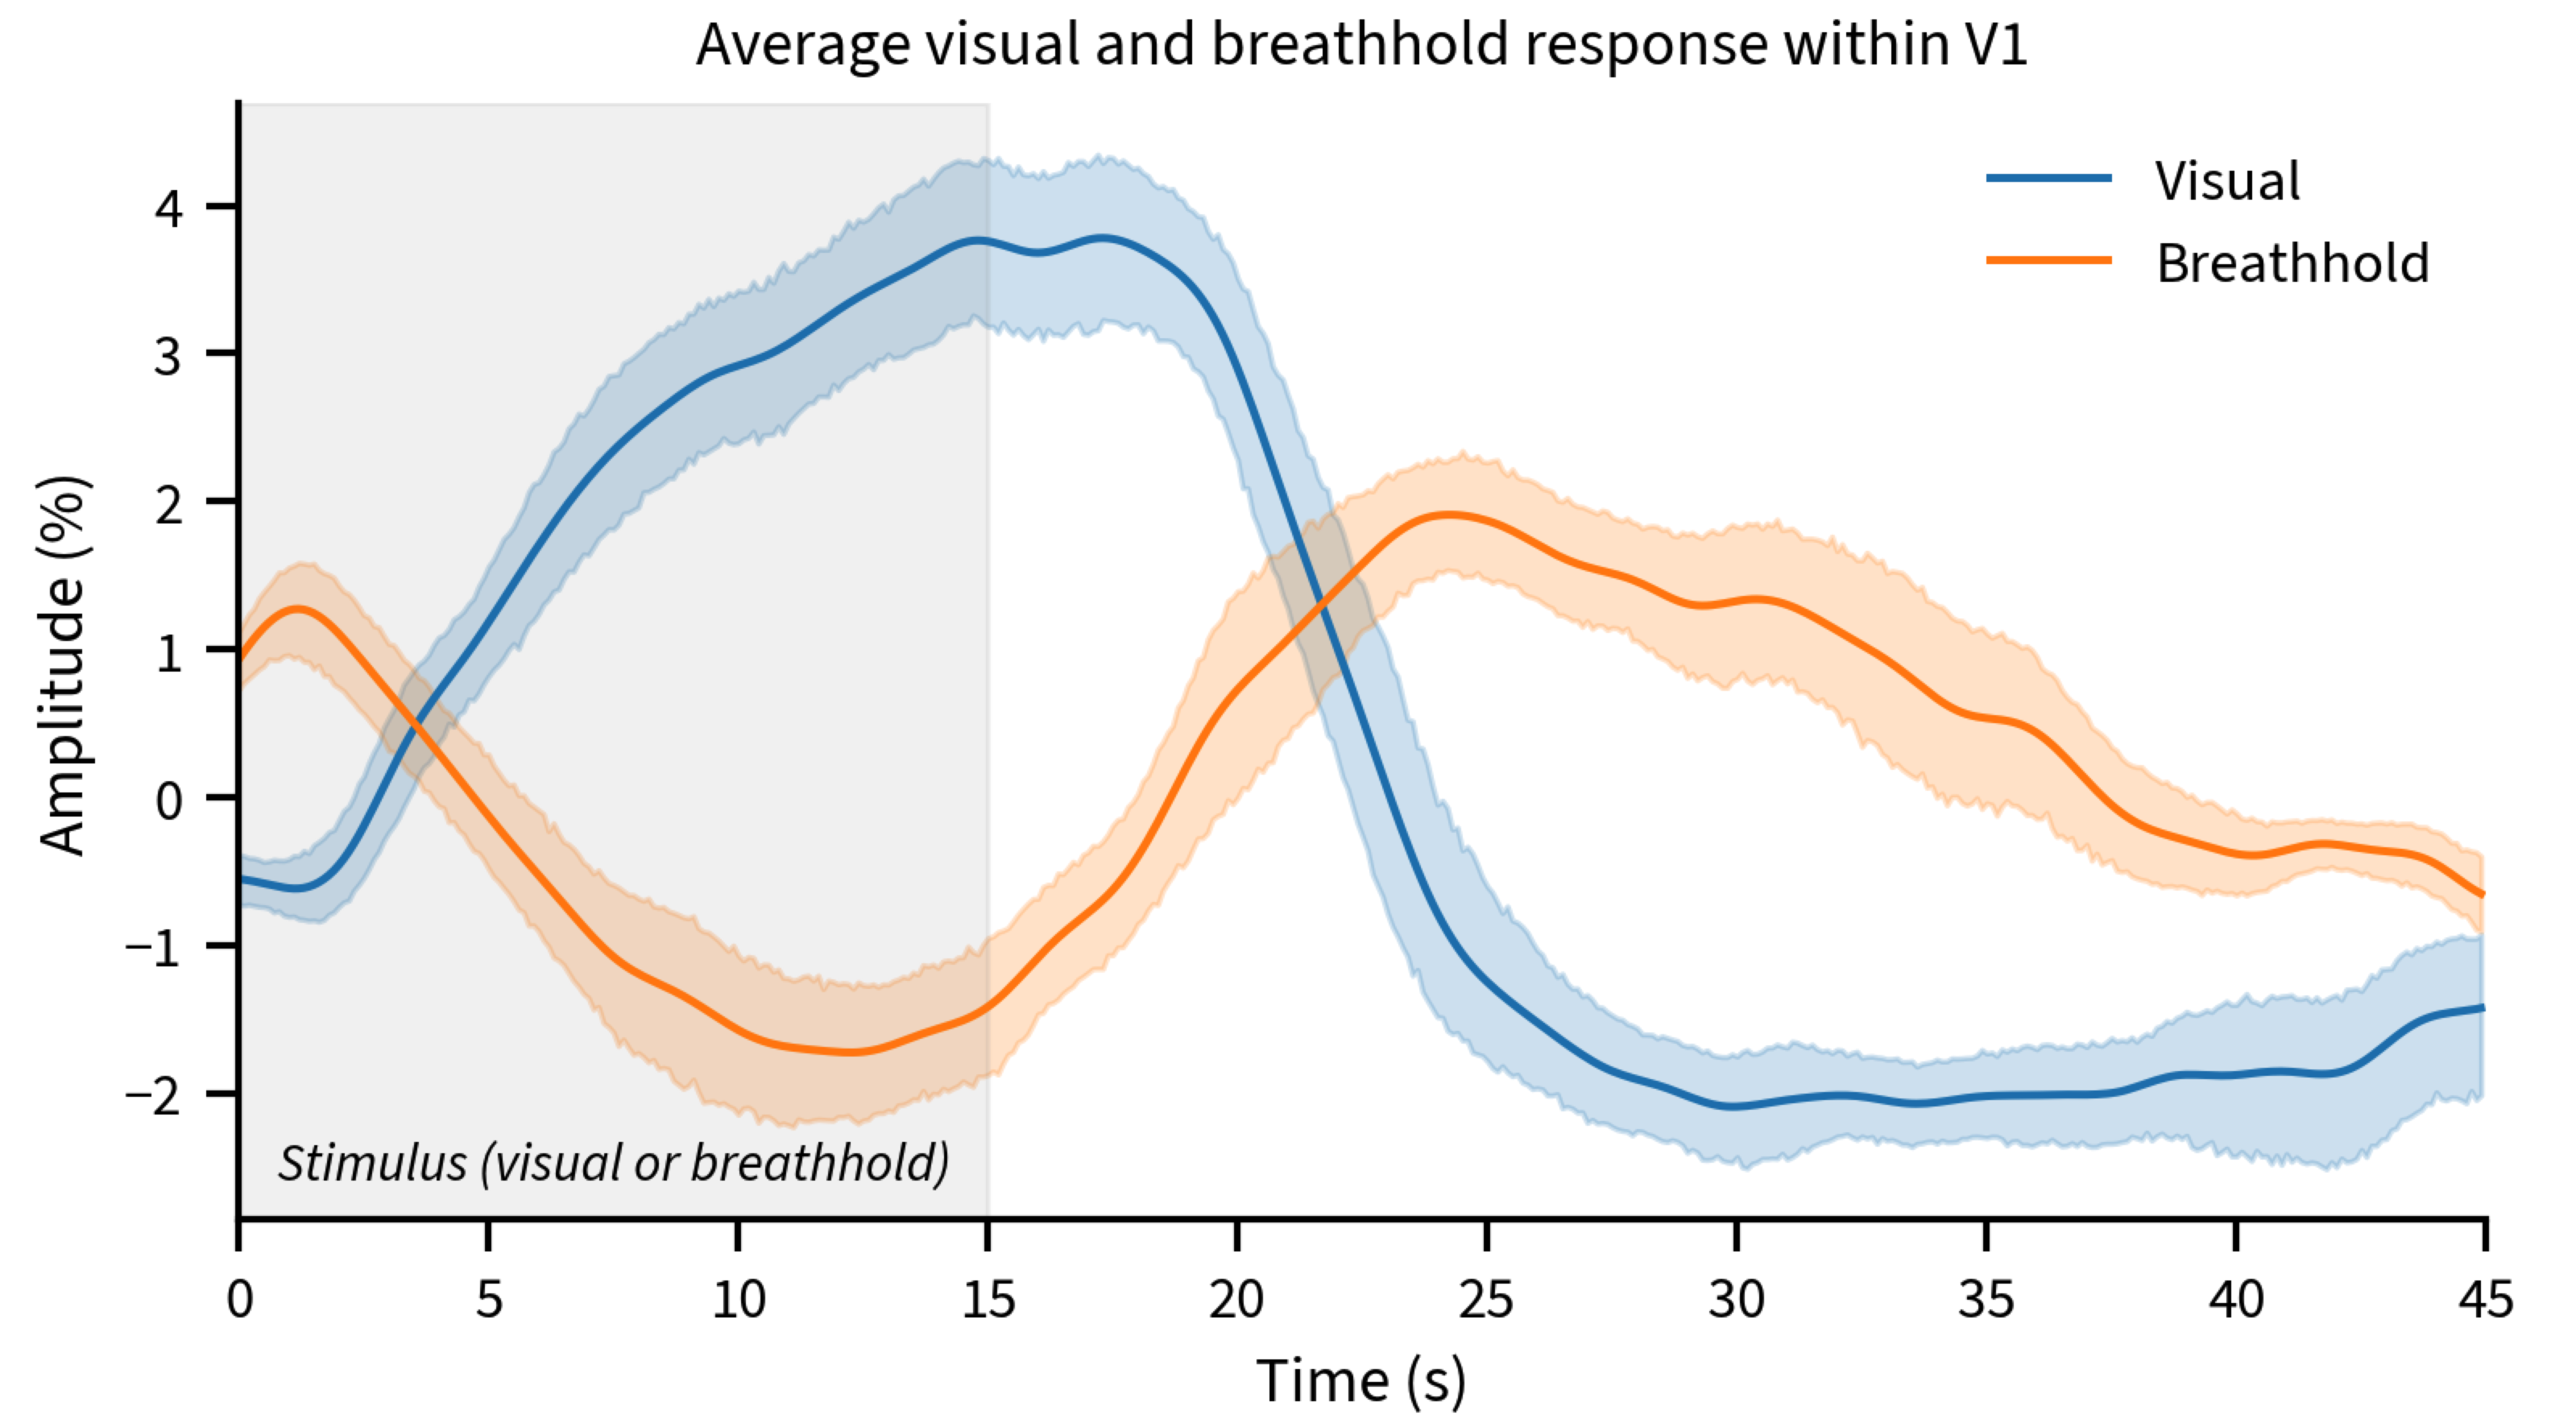
Both the breathhold and visual stimuli yielded robust amplitude and delay maps (Fig. 1A-D). Calibrating the responses worked well to normalize amplitudes (Fig. 1E); however, the delays to the visual stimulus were substantially different than the breathhold, yielding large heterogeneity in the calibrated map (Fig. 1F).Averaged time-courses (Figure 2) illustrate how visual responses decay fast post stimulation, however, the breathhold response return to baseline is more prolonged, implicating different temporal dynamics could be responsible for different delay patterns obtained.
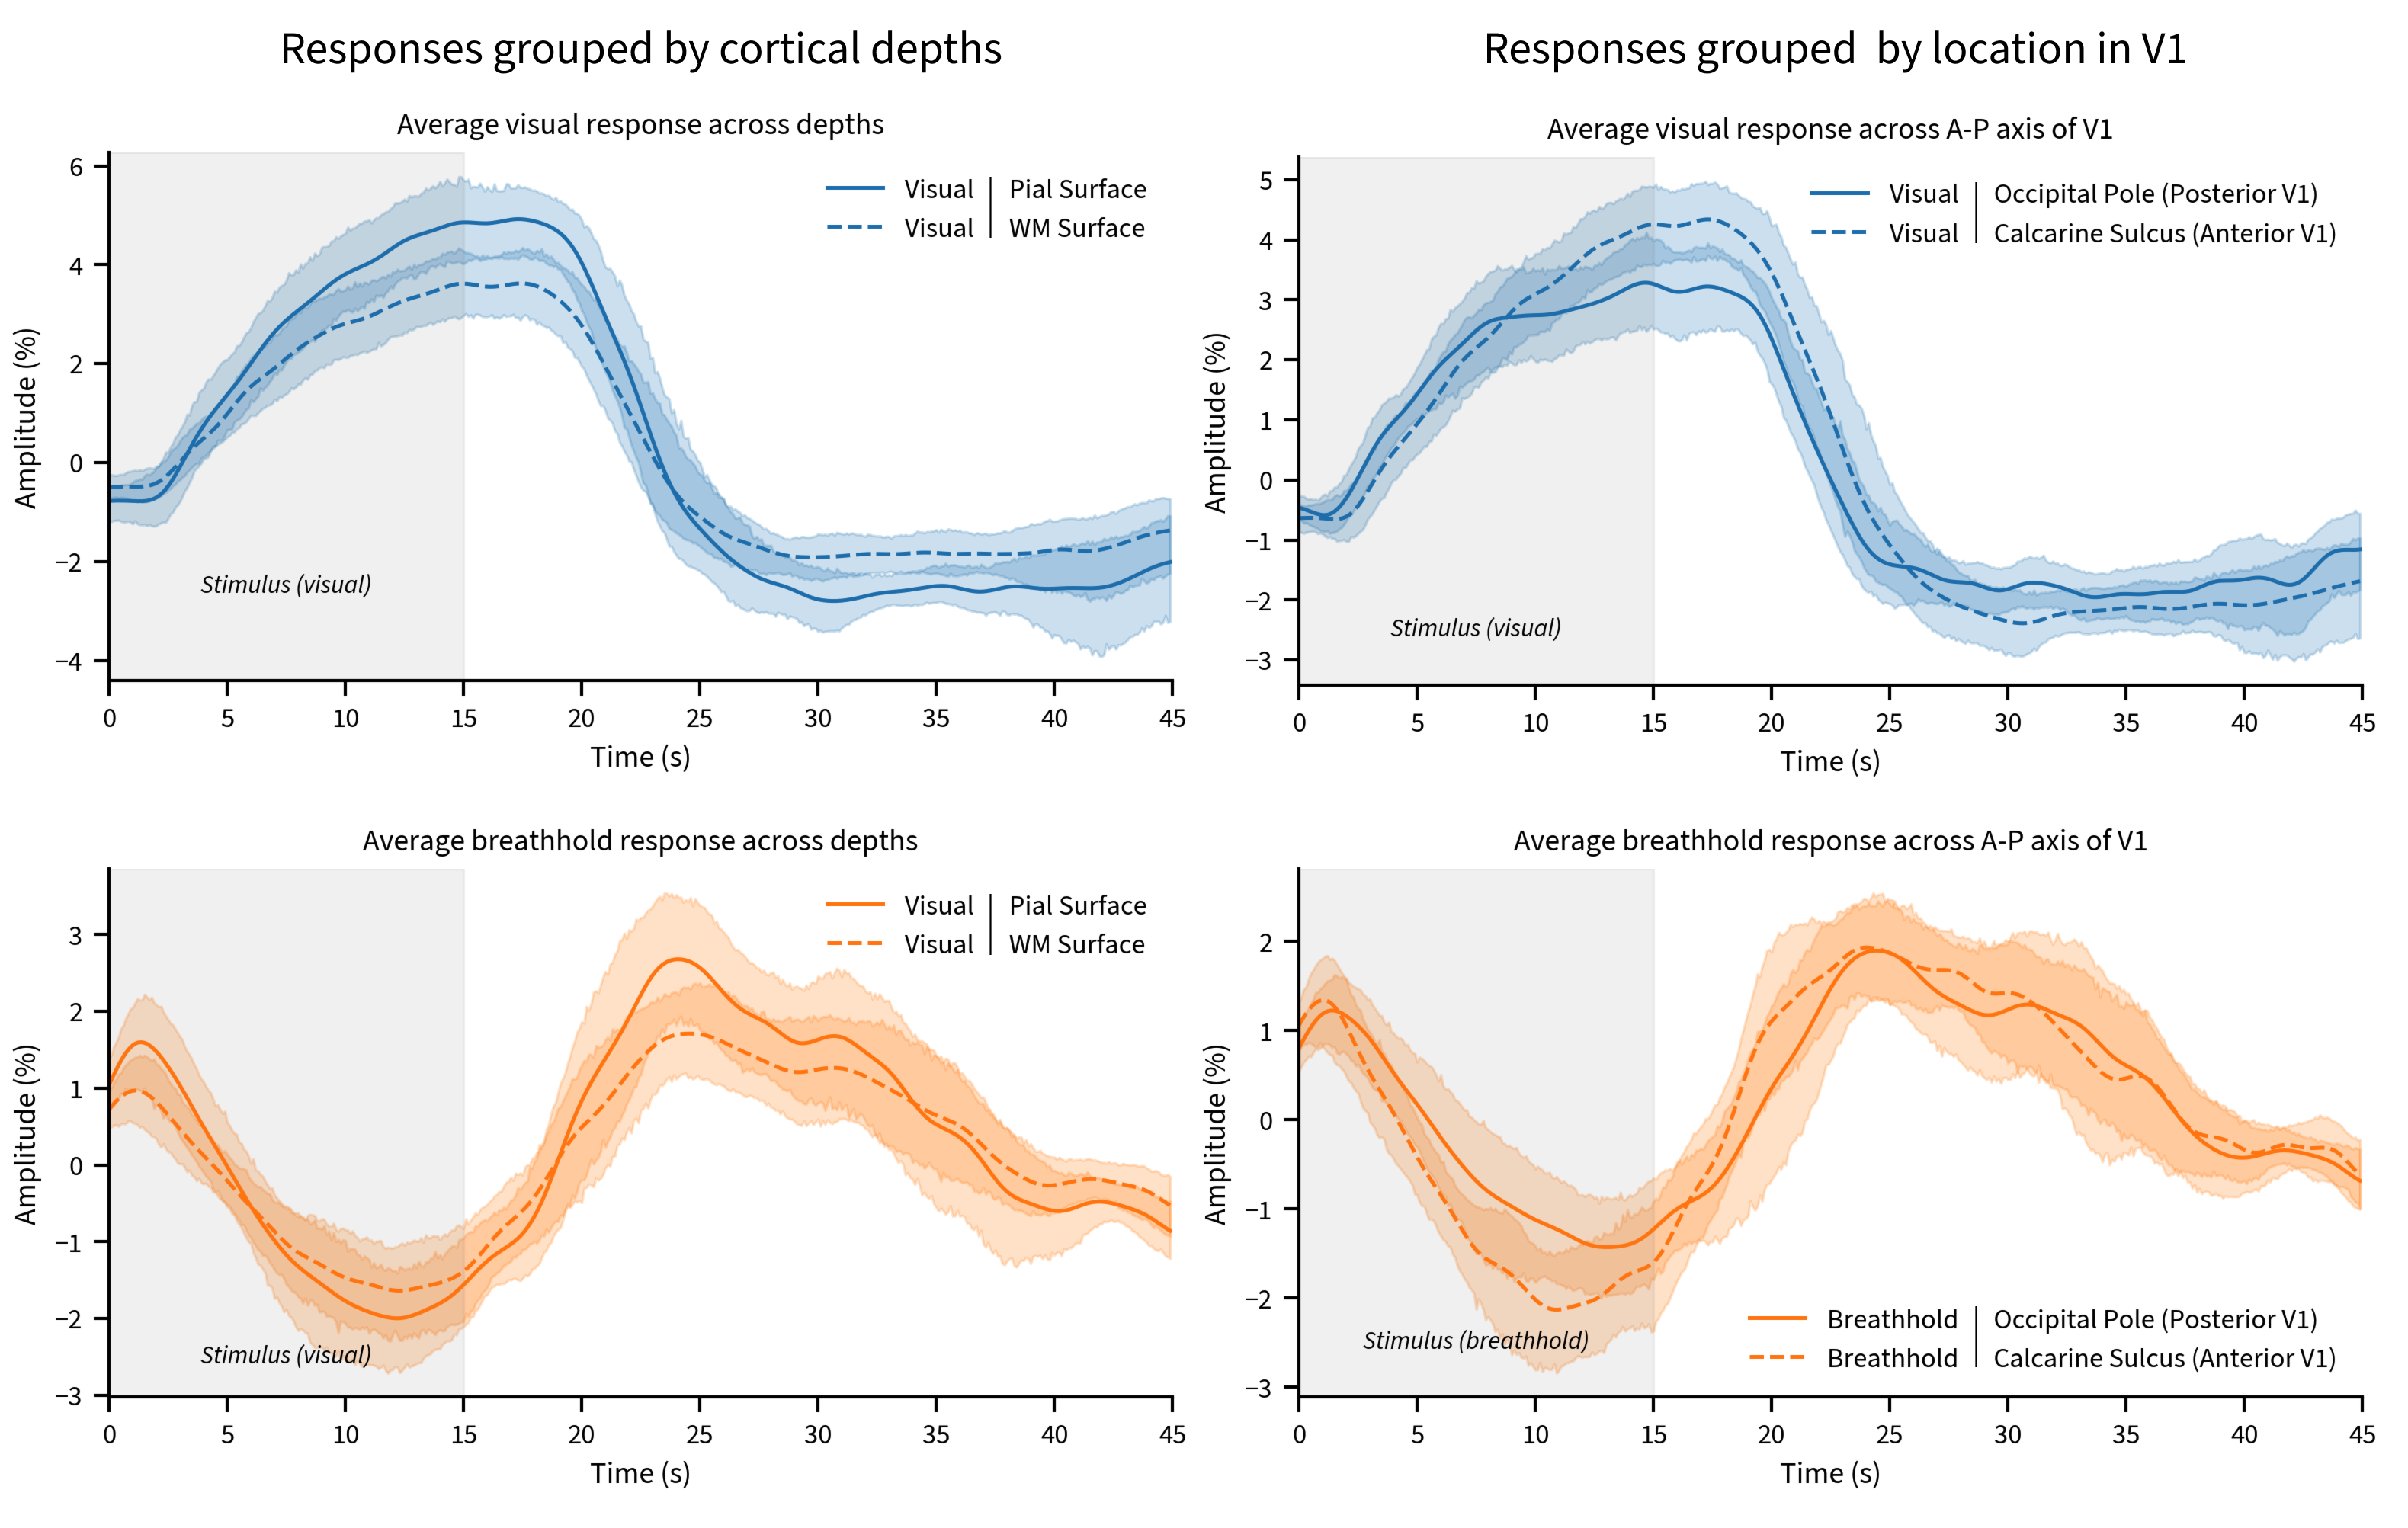
To investigate how vascular architecture might influence responses, we stratified voxels by cortical depth and location (Figure 3).
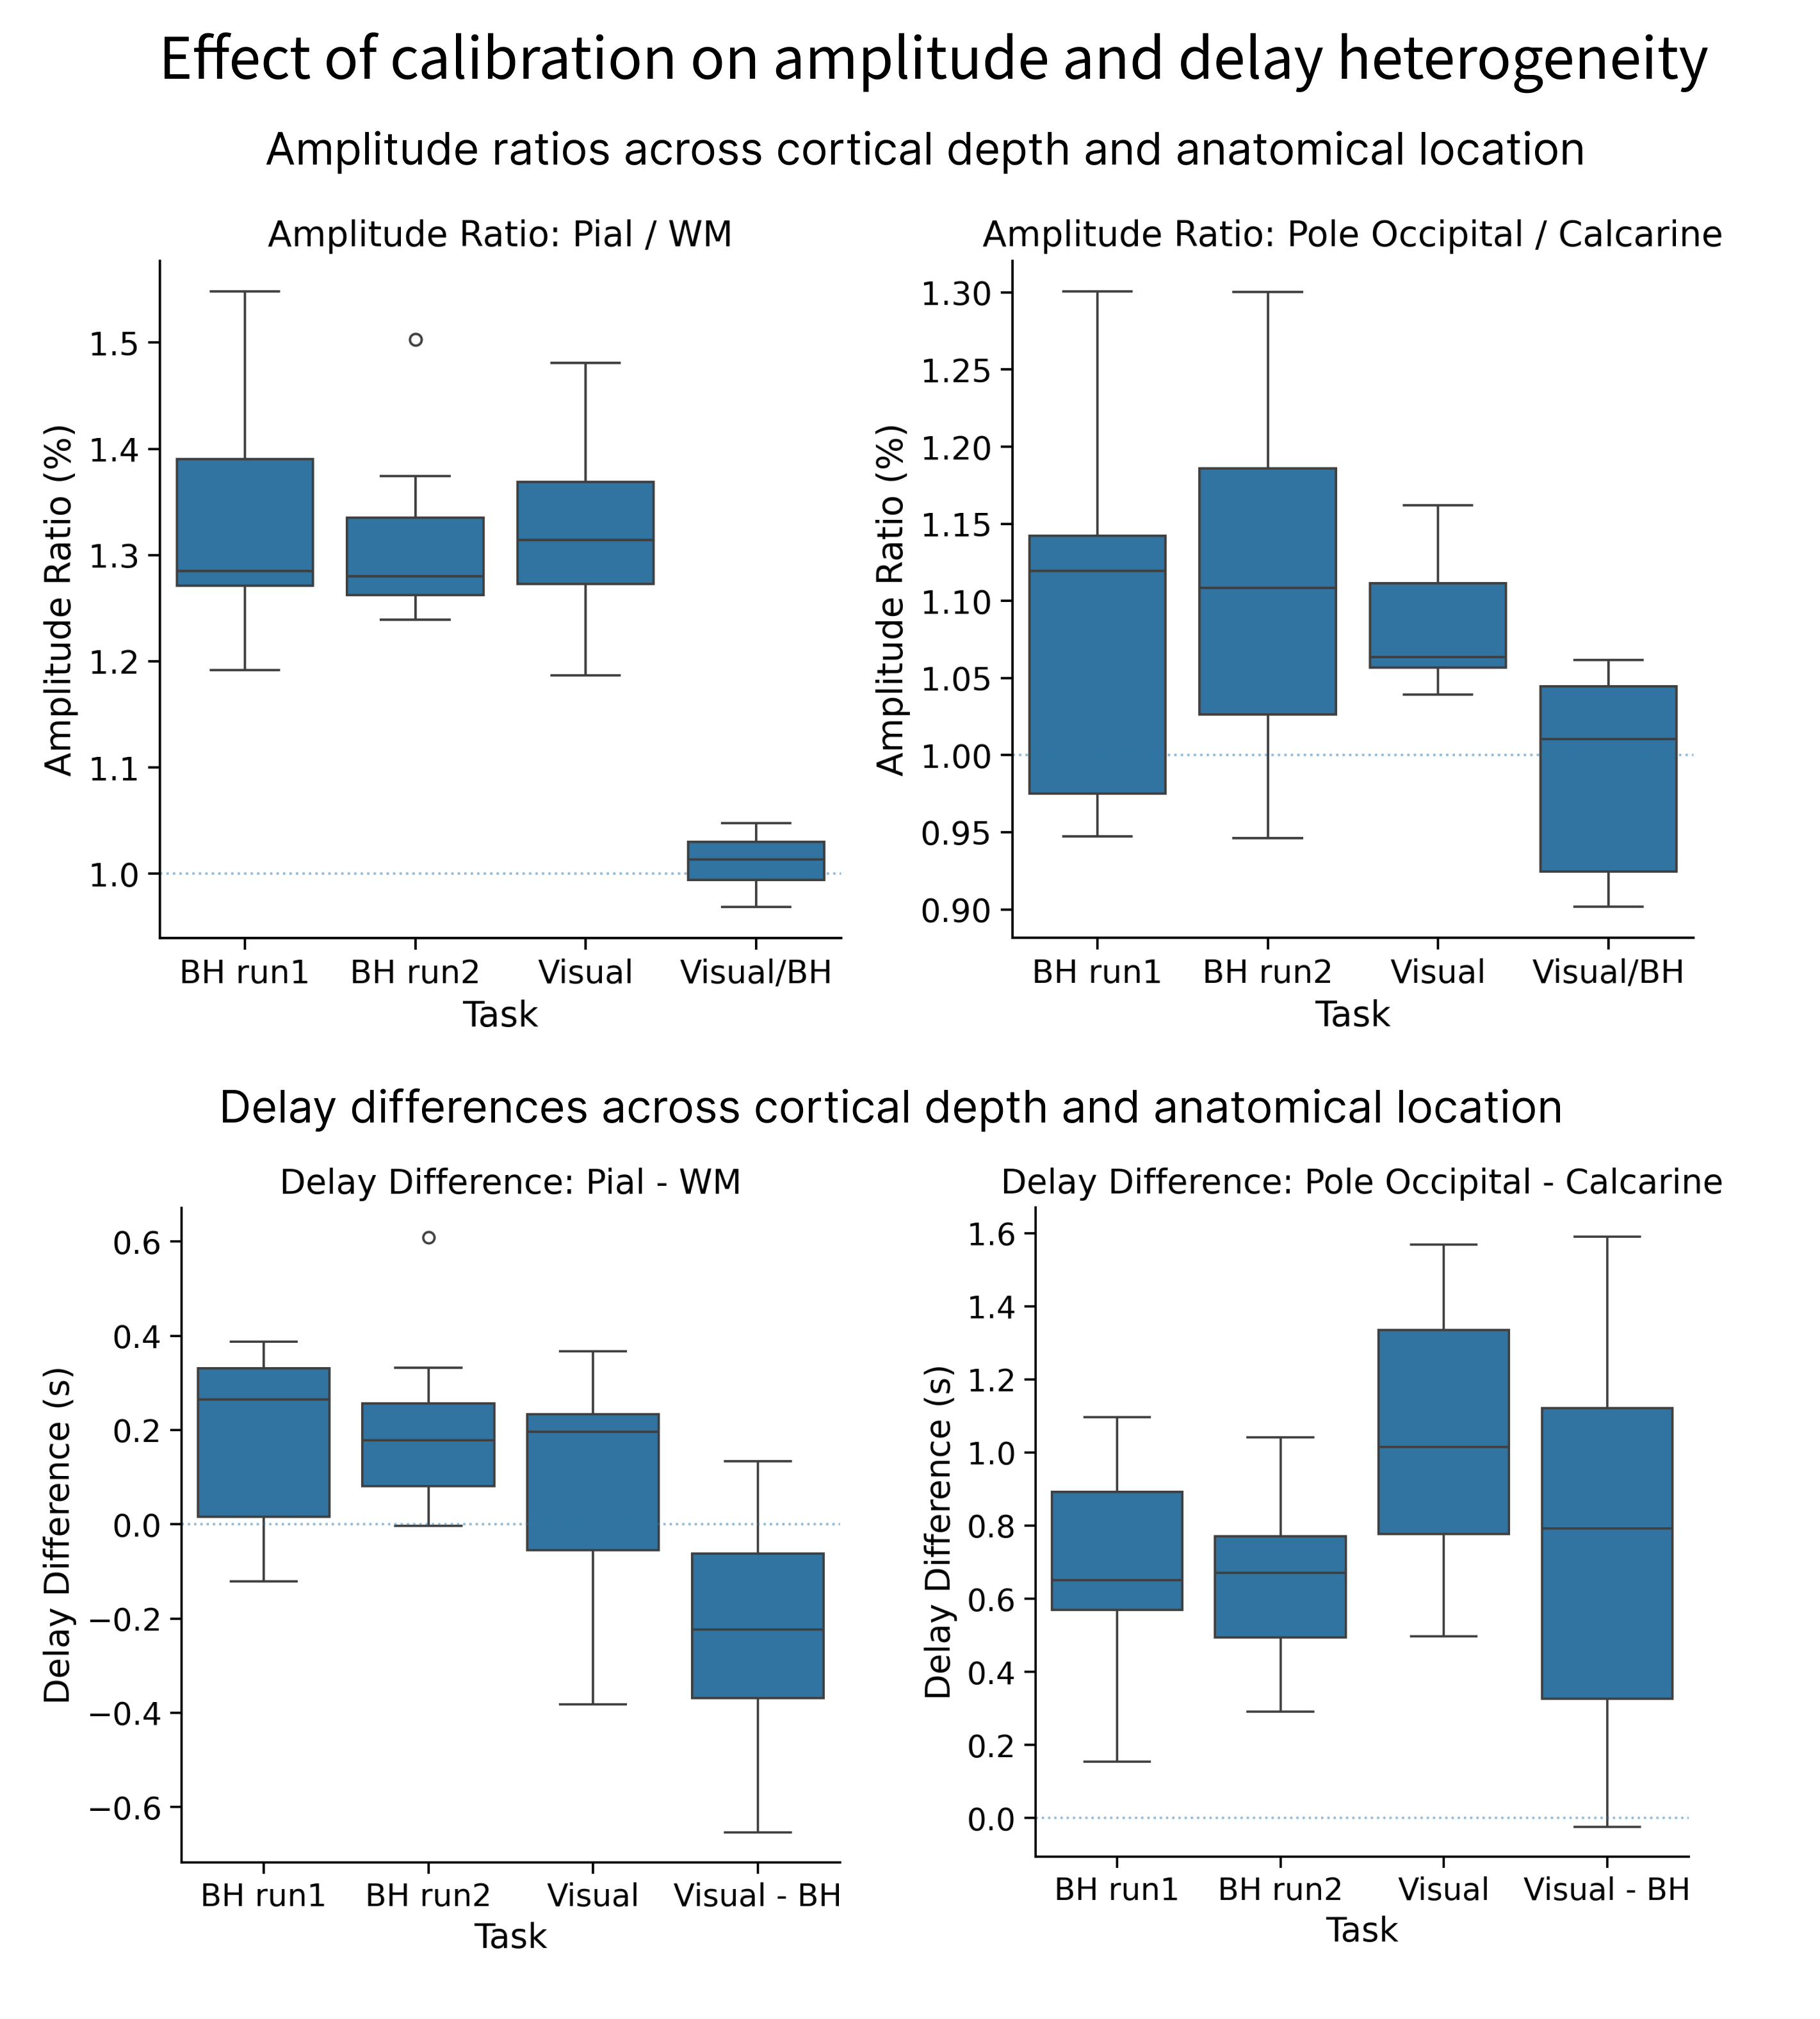
Visual and breathhold responses were on average 31.3% and 28.5% larger close to the pial surface when compared to the white matter surface, and 6.3% and 10.8% larger in posterior V1 than in anterior V1, respectively. Calibration virtually eliminated amplitude differences across cortical depths and regions (Figure 4, top). Delays for both visual and breathhold responses were 195 and 221ms later near the pial surface when compared to the white matter, respectively. As a function of location, however, the difference in delay was found to be over a second (1015ms) between posterior and anterior V1 for the visual task, but only 660ms between for the breathhold task (Figure 4, bottom). Calibration of delays did not eliminate differences between cortical depths nor regions, thus not produce a satisfactory normalization.
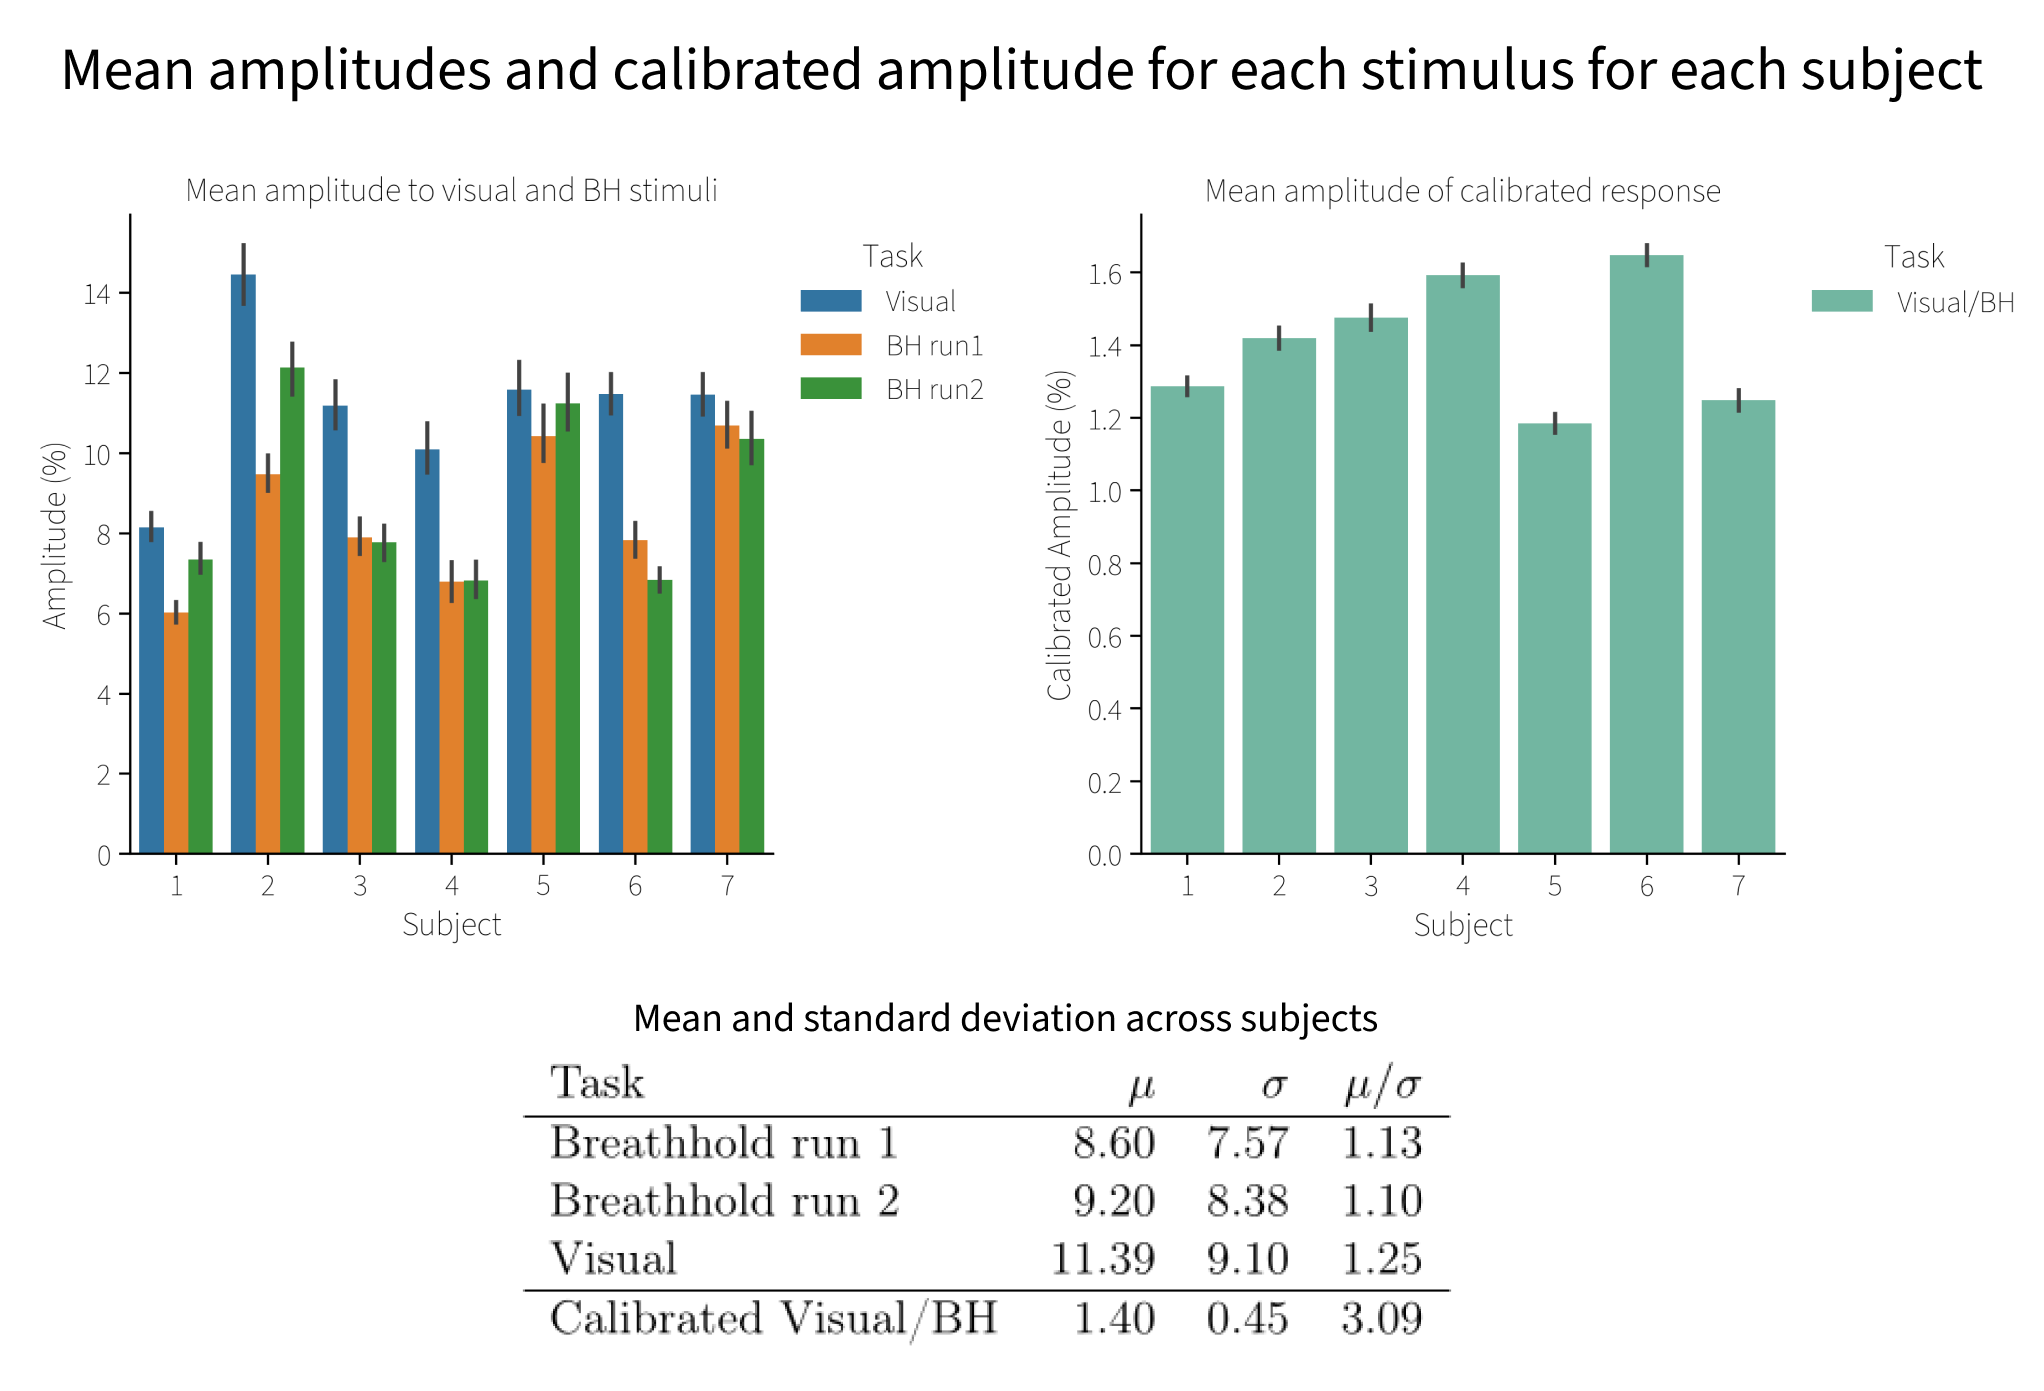
Finally, to test whether calibration reduces inter-subject variability, we computed the mean normalized BOLD amplitude across each subject for each condition, and divided by the standard deviation across participants. Calibration reduced the inter-subject amplitude variability by almost threefold (Figure 5).
Discussion
Consistent with prior work, we found that BOLD responses across the vascular tree are similar in amplitude across conditions, with highly correlated amplitudes to neurogenic and myogenic stimuli in healthy controls. However, the temporal behavior of neurogenic and myogenic differed, precluding a robust normalization of hemodynamic delays, which can vary substantially even within small ROIs like V1. Delay calibration was innefective: the spread and location of delays varied spatially across conditions, despite both stimuli showing earlier responses deep in the calcarine[as seen in 1,2]. Calibration also reduced between-subject variability in response amplitude, though not completely eliminating it. A potential explanation for the remaining variance is that a 15s-breathhold may not equally probe the vascular reserve of all subjects, or subjects may have inherently different neuronal response amplitudes to visual stimulation.Understanding the biophysical mechanisms by which hemodynamic delays arise and their relationship to vascular architecture may enable predicting and correcting them, improving the interpretation of fMRI.
Acknowledgements
We would like to thank Nicholas Cicero, Beverly Setzer, Makaila Banks and Banban Tan for their help with data collection. This work was funded by NIH grants R21-NS123412, P41-EB015896, R21-NS106706, R01-EB019437, P41-EB030006, R00-MH111748, R01-AG070135 and S10-RR019371, and by the MGH/HST Athinoula A. Martinos Center for Biomedical Imaging; and was made possible by the resources provided by NIH Shared Instrumentation Grant S10-OD023637.References
[1] Amemiya, Shiori, Hidemasa Takao, and Osamu Abe. 2020. “Origin of the Time Lag Phenomenon and the Global Signal in Resting-State fMRI.” Frontiers in Neuroscience 14. doi:10.3389/fnins.2020.596084.
[2] Bailes, Sydney M, Daniel EP Gomez, Beverly Setzer, and Laura D Lewis. 2023. “Resting-State fMRI Signals Contain Spectral Signatures of Local Hemodynamic Response Timing.” Edited by Shella Keilholz, Timothy E Behrens, and Shella Keilholz. eLife. eLife Sciences Publications, Ltd. doi:10.7554/eLife.86453.
[3] Bandettini, Peter A., and Eric C. Wong. 1997. “A Hypercapnia-Based Normalization Method for Improved Spatial Localization of Human Brain Activation with fMRI.” NMR in Biomedicine 10 (4-5): 197–203. doi:10.1002/(sici)1099-1492(199706/08)10:4/5<197:aid-nbm466>3.0.co;2-s.
[4] Chen, J. Jean, and Claudine J. Gauthier. 2021. “The Role of Cerebrovascular-Reactivity Mapping in Functional MRI: Calibrated fMRI and Resting-State fMRI.” Frontiers in Physiology 12. doi:10.3389/fphys.2021.657362.
[5] Cohen, Eric R., Egill Rostrup, Karam Sidaros, Torben E. Lund, Olaf B. Paulson, Kamil Ugurbil, and Seong-Gi Kim. 2004. “Hypercapnic Normalization of BOLD fMRI: Comparison across Field Strengths and Pulse Sequences.” NeuroImage 23 (2): 613–24. doi:10.1016/j.neuroimage.2004.06.021.
[6] Ho, Yi-Ching Lynn, Esben Thade Petersen, Ivan Zimine, and Xavier Golay. 2010. “Similarities and Differences in Arterial Responses to Hypercapnia and Visual Stimulation.” Journal of Cerebral Blood Flow &Amp; Metabolism 31 (2): 560–71. doi:10.1038/jcbfm.2010.126.
[7] Lai, S., A. L. Hopkins, E. M. Haacke, D. Li, B. A. Wasserman, P. Buckley, L. Friedman, H. Meltzer, P. Hedera, and R. Friedland. 1993. “Identification of Vascular Structures as a Major Source of Signal Contrast in High Resolution 2D and 3D Functional Activation Imaging of the Motor Cortex at 1.5T: Preliminary Results.” Magnetic Resonance in Medicine 30 (3): 387–92. doi:10.1002/mrm.1910300318.
[8] Mareyam, Azma, John E Kirsch, Yulin Chang, Gunjan Madan, and Lawrence L Wald. 2020. “A 64-Channel 7T Array Coil for Accelerated Brain MRI.” In Proceedings of the Annual Meeting ISMRM, 0764.
[9] Siero, Jeroen CW, Natalia Petridou, Hans Hoogduin, Peter R Luijten, and Nick F Ramsey. 2011. “Cortical Depth-Dependent Temporal Dynamics of the BOLD Response in the Human Brain.” Journal of Cerebral Blood Flow & Metabolism 31 (10). SAGE Publications: 1999–2008. doi:10.1038/jcbfm.2011.57.
[10] Turner, R. 2002. “How Much Cortex Can a Vein Drain? Downstream Dilution of Activation-Related Cerebral Blood Oxygenation Changes.” NeuroImage 16 (4): 1062–67. doi:10.1006/nimg.2002.1082.
[11] Uludağ, Kâmil, and Pablo Blinder. 2018. “Linking Brain Vascular Physiology to Hemodynamic Response in Ultra-High Field MRI.” NeuroImage 168 : 279–95. doi:10.1016/j.neuroimage.2017.02.063.
[12] Williams, Rebecca J., Jacinta L. Specht, Erin L. Mazerolle, R. Marc Lebel, M. Ethan MacDonald, and G. Bruce Pike. 2023. “Correspondence between BOLD fMRI Task Response and Cerebrovascular Reactivity across the Cerebral Cortex.” Frontiers in Physiology 14.. doi:10.3389/fphys.2023.1167148.
Figures
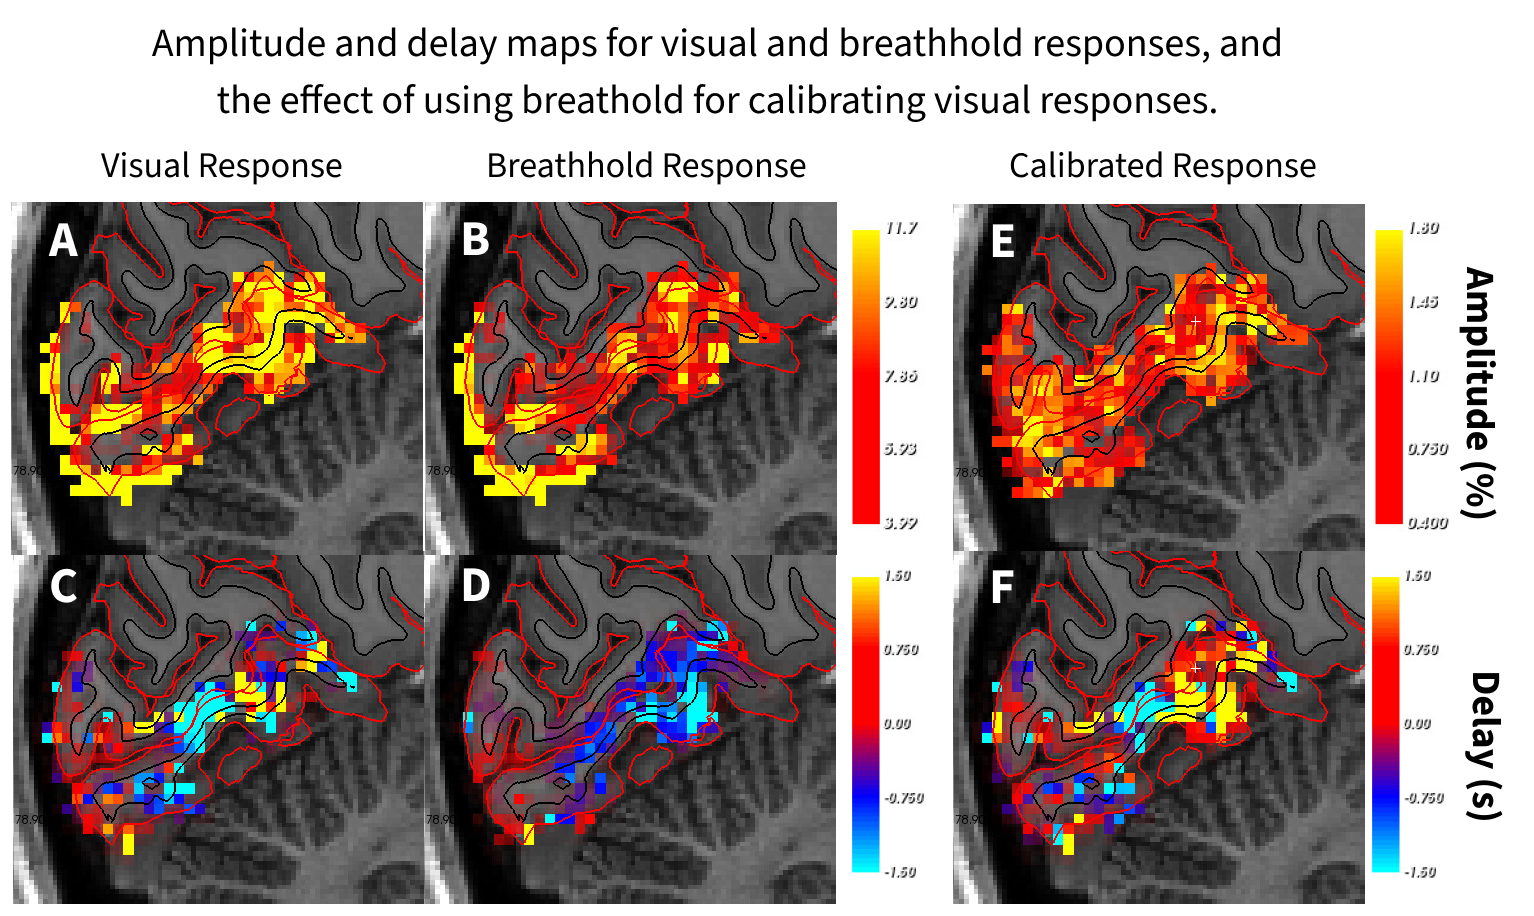
Figure 1. Amplitude and delay maps for visual and breathhold responses, and the effect of using breathhold for calibrating visual responses. Top row: Response amplitudes to visual and breathhold stimuli, and calibrated (visual / breathhold) response. The calibration homogeneizes amplitudes across V1. Bottom row: Delays in seconds with respect to mean time-series of each stimuli within visual ROI. In contrast to amplitude calibration, delay calibration does not homogeneize delays.