3128
Laminar fMRI of the human hippocampus: Accounting for physiological fluctuations and vasculature1Erwin L. Hahn Institute for Magnetic Resonance Imaging, University of Duisburg-Essen, Essen, Germany, 2Department of Neuropsychology, Institute of Cognitive Neuroscience, Faculty of Psychology, Ruhr University Bochum, Bochum, Germany, 3Donders Institute for Brain Cognition and Behaviour, Radboud University, Nijmegen, Netherlands
Synopsis
Keywords: fMRI Acquisition, fMRI, laminar fMRI, hippocampus
Motivation: Laminar fMRI of the human hippocampus is challenging and not easy to interpret due to differences in the direction of venous drainage.
Goal(s): Acquire robust and reproducible single-subject laminar fMRI responses using GRE-BOLD.
Approach: An autobiographical memory task was used at 7 T to elicit hippocampal activation in two subjects each scanned twice. We quantified subregion-specific cortical depth-dependent activation after accounting for physiological signal fluctuations.
Results: We show that laminar profiles differ between subjects but are to a high degree reproducible within subjects and that these profiles were consistent with previous findings at lower spatial resolution.
Impact: Our results show that for laminar fMRI of deeper brain areas, physiological fluctuations need to be corrected to obtain reproducible data. The consistent difference between subjects indicate that subject-specific vasculature needs to be considered.
Introduction
The hippocampus (HP) is an important player in many cognitive processes like navigation1 or memory2. Although studied excessively at conventional spatial resolutions, the underlying activation patterns at the laminar level are sparsely investigated. Because of its anatomical location, the human HP is a challenging target, especially at an ultra-high field (UHF) of 7 T. Moreover, when using the GRE-BOLD contrast to maximize sensitivity for small signal changes, the vascular architecture of the HP must be considered in order to reliably interpret fMRI responses as a function of cortical depth (i.e. at the level of cortical layers). This is because dependent upon the individual vasculature blood can drain to either the inner or the outer surface. In this work, we aim to robustly acquire single-subject laminar fMRI responses of the human HP at 7 T and to assess subject-specific differences in those responses.Methods
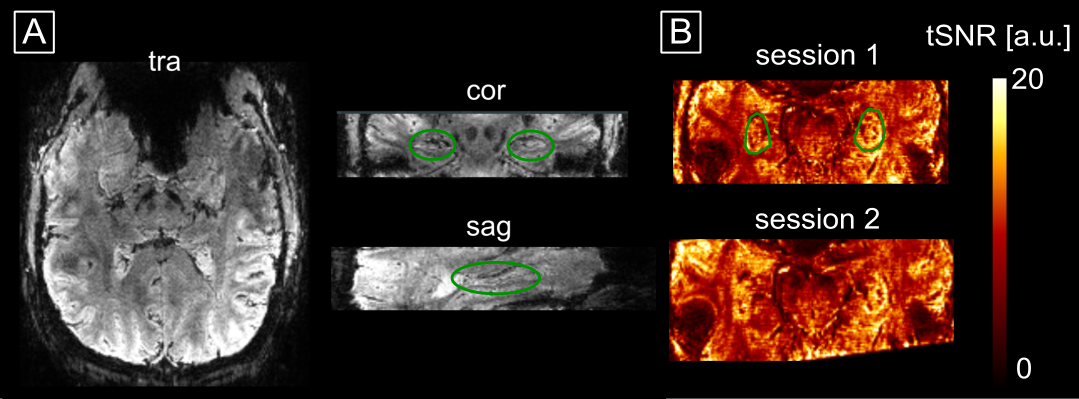
Two male healthy subjects (33 and 32 years old) were scanned on a 7 T Siemens MEGNETOM-Terra MRI twice on different days after given written informed consent. Functional data were acquired using a 3D-EPI3 (0.9 mm isotropic resolution, TR/TE = 58 .3/22.2 ms, TRvol = 2.21 s, matrix size = 180x198x38, 1-2-1 water excitation, GRAPPA 3, 6/8 partial Fourier with offline POCS reconstruction) (Fig. 1). For distortion correction, the same sequence with reversed-phase encoding was acquired. The functional experiment was an autobiographical memory (AM) paradigm adapted from2. The subjects were asked, based on a given general cue (e.g. ‘project’), to remember a certain event not older than three years associated with this cue. After the subjects have found a memory, they were instructed to think about that event in detail during the remaining trial duration (17.6 s). The AM task was randomly interleaved with a mental arithmetic (MA) task where the subjects should solve a simple arithmetic operation and iteratively add 3 to the result until the end of the trial. The experiment was split into three runs, each lasting 18:09 min. Each run consisted of 22 AM and 22 MA trials.For anatomical reference, a T1-weighted MP2RAGE4,5 (0.75 mm isotropic resolution, TR/TE/TI1/TI2 = 6000/1.85/800/2700 ms, flip angles (FA) = 4/5°, matrix size = 256x340x340) was acquired. To investigate how the vasculature would influence the laminar profiles, we acquired high in-plane resolution SWI (0.3x0.3x0.6 mm resolution, interpolated to 0.15x0.15x0.6 mm, final matrix size = 1440x1080x44, TR/TE = 28/15 ms, GRAPPA 2, TA = 4:40 min) and TOF-MRA (same resolution and matrix size as SWI, TR/TE = 23/5.15 ms, GRAPPA 3, FA = 20°, 70 % TONE ramp).
SWI and TOF images were denoised using the BM4D filter6 and subsequently filtered for vessel structures using the Frangi filter7 and a wavelet filter approach, respectively. MP2RAGE images were denoised and biasfield corrected using publicly available software8. HP GM surfaces and subfields were extracted using hippunfold9.
Functional data were processed using a pipeline10 based on ANTS and SPM. Subsequently, GM signals were equidistantly sampled on 20 depth bins between the inner and outer surface boundary using a custom-written MATLAB routine. In case of cornu ammonis (CA1) and CA2, the sampling was extended by 10 depth bins into the stratum radiatum, lacunosum and moleculare (SRLM).
Statistical analysis was performed using SPM in two passes: First, a standard GLM was performed. Second, based on the residuals, a mask was generated on high residuals reflecting signal fluctuations associated with respiratory and cardiac cycles. acompCor11 was performed based on that masked residuals to account for high physiology-driven signal fluctuations in deep brain areas.
Results
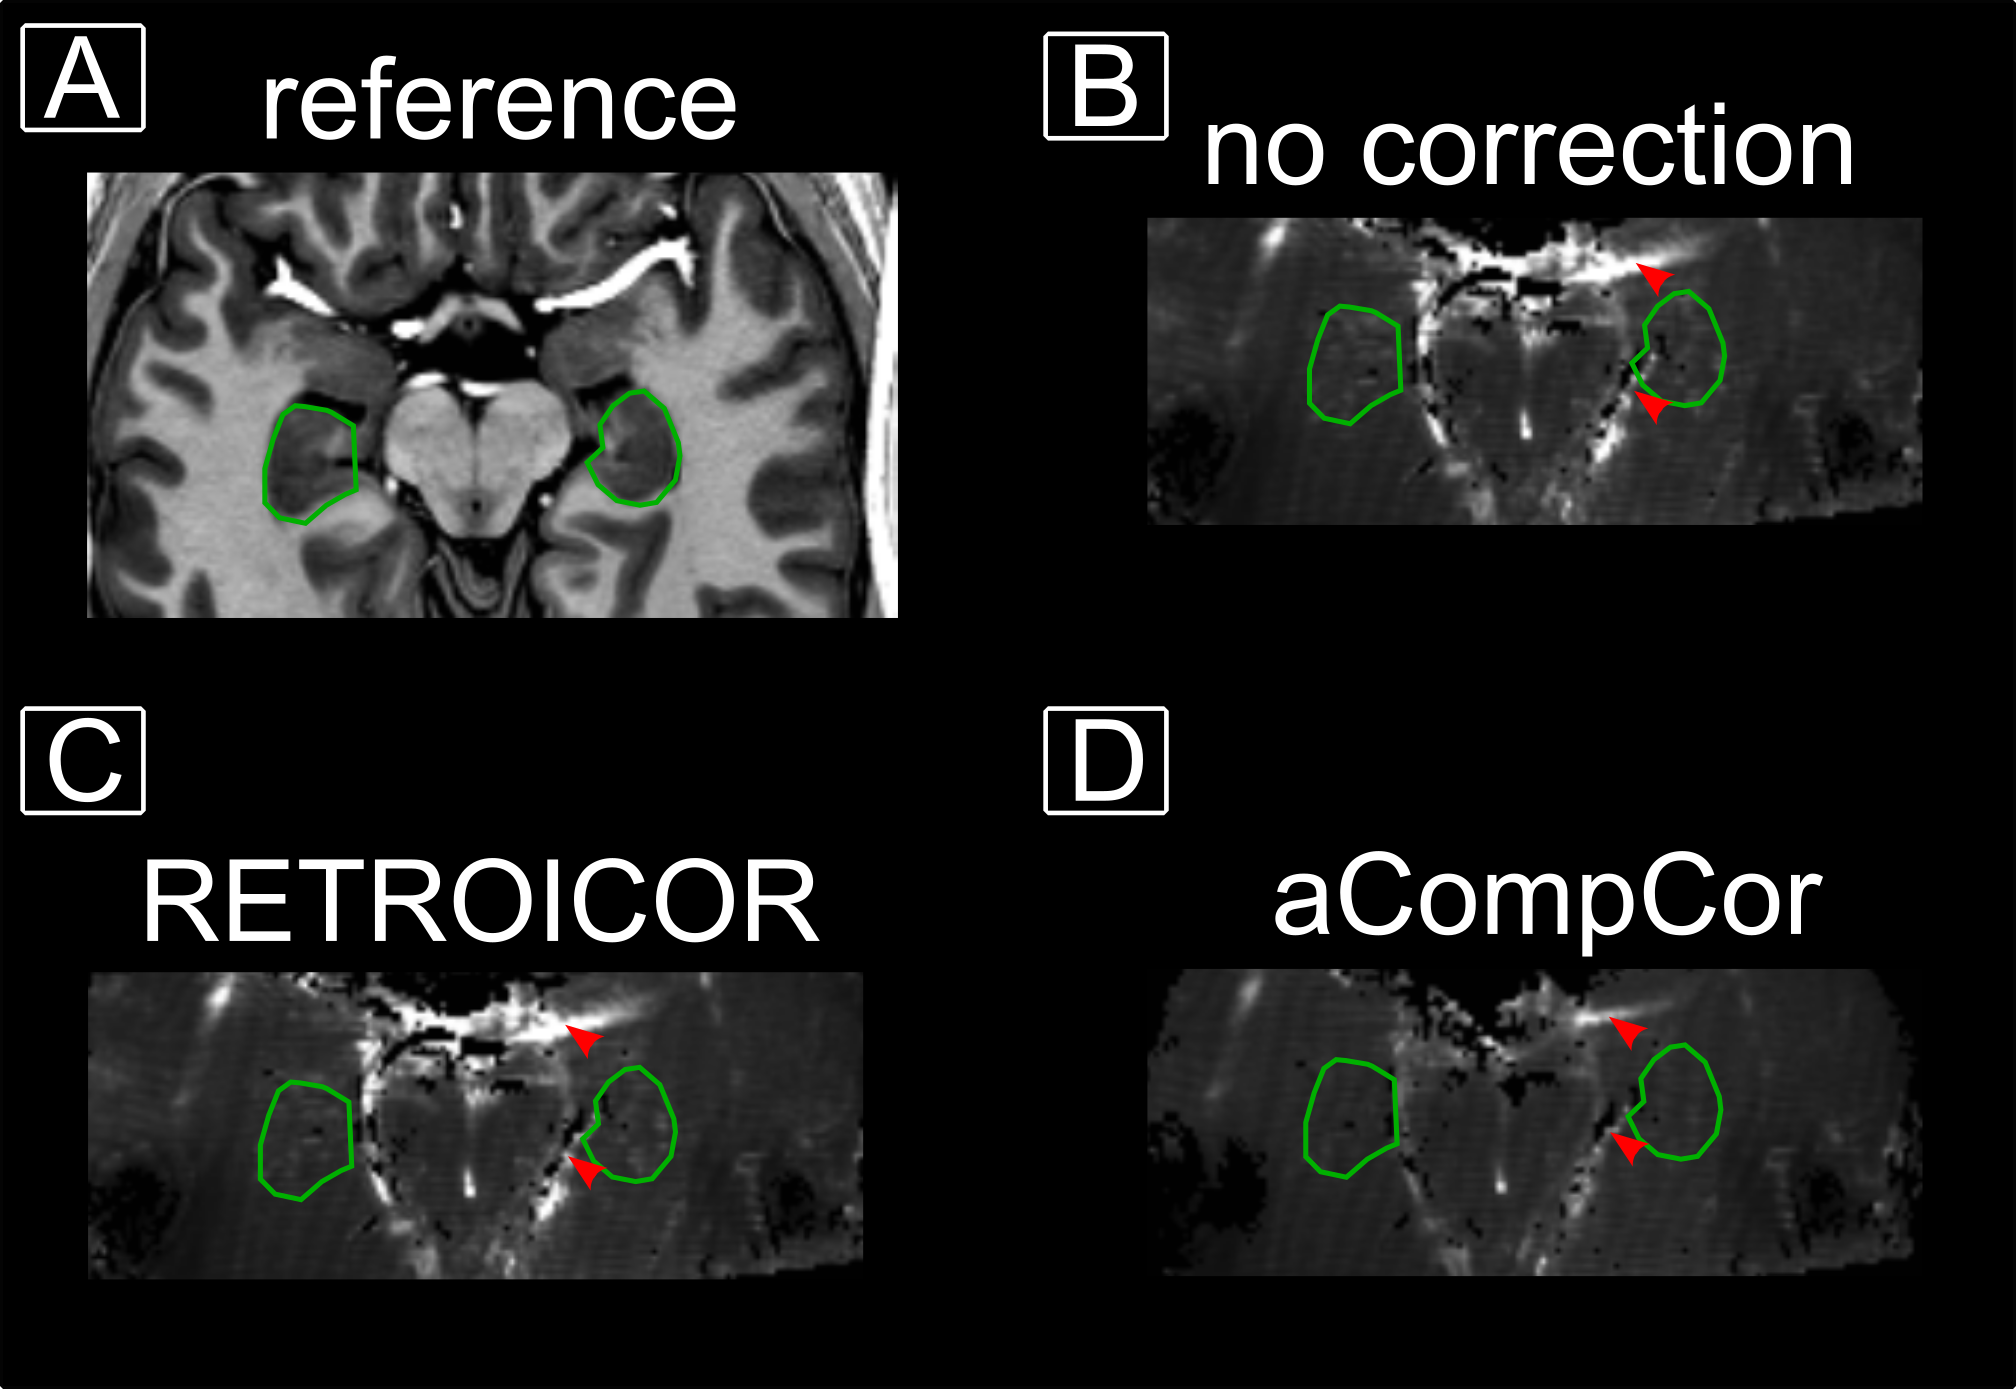
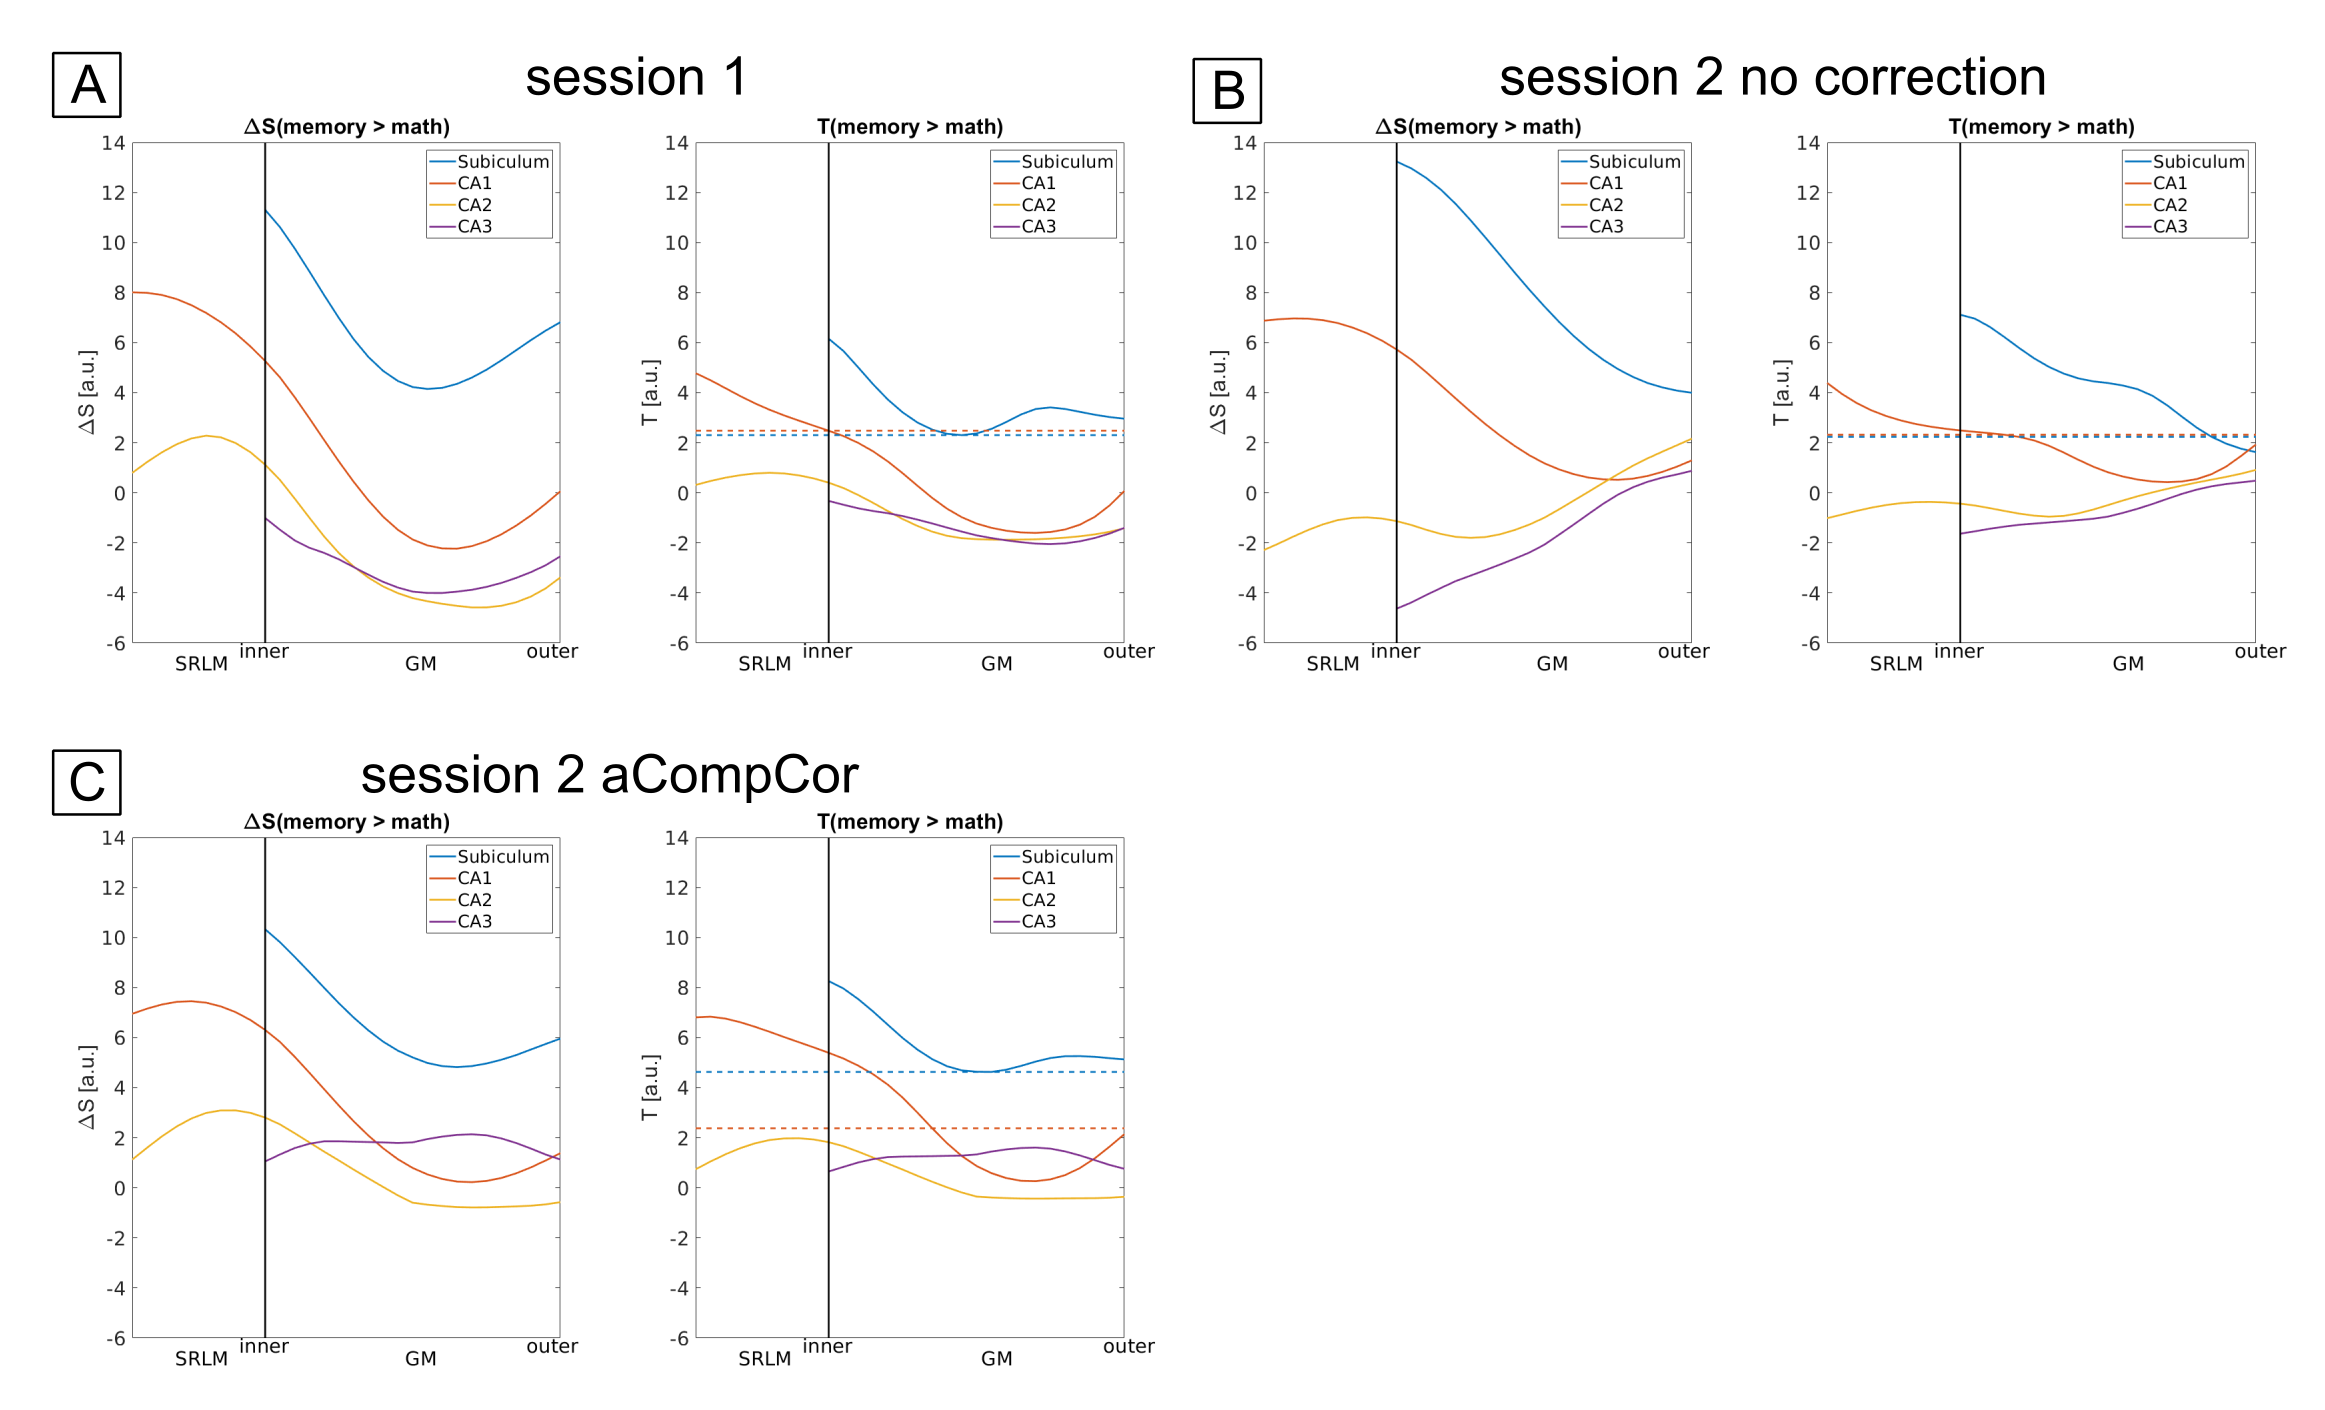
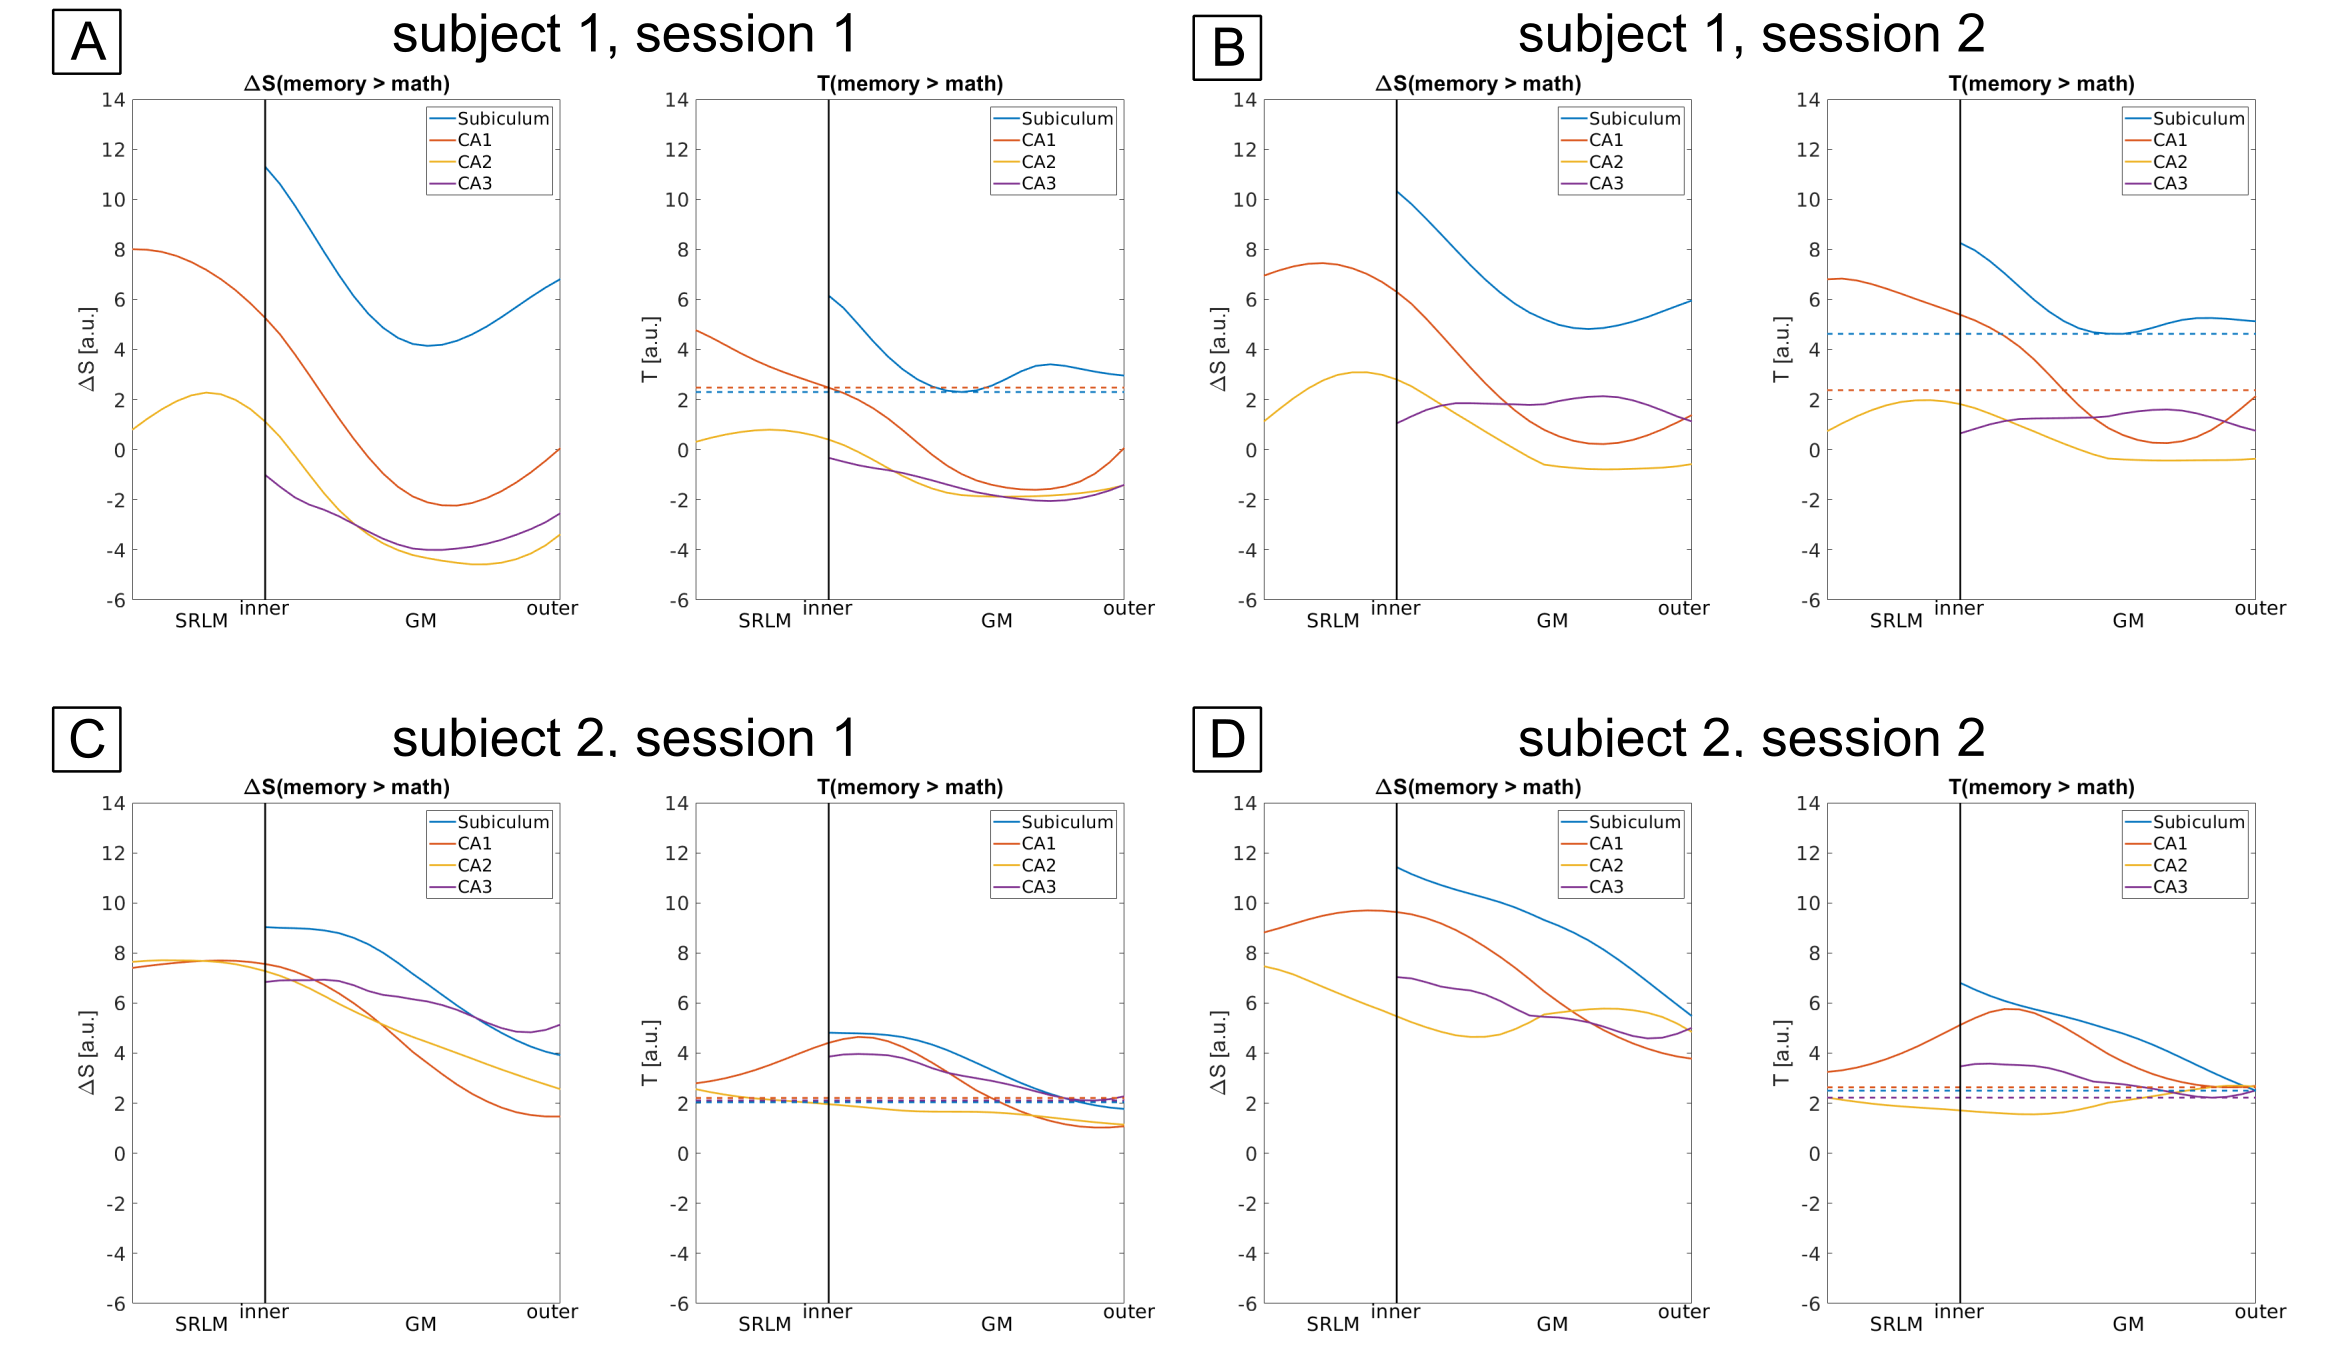
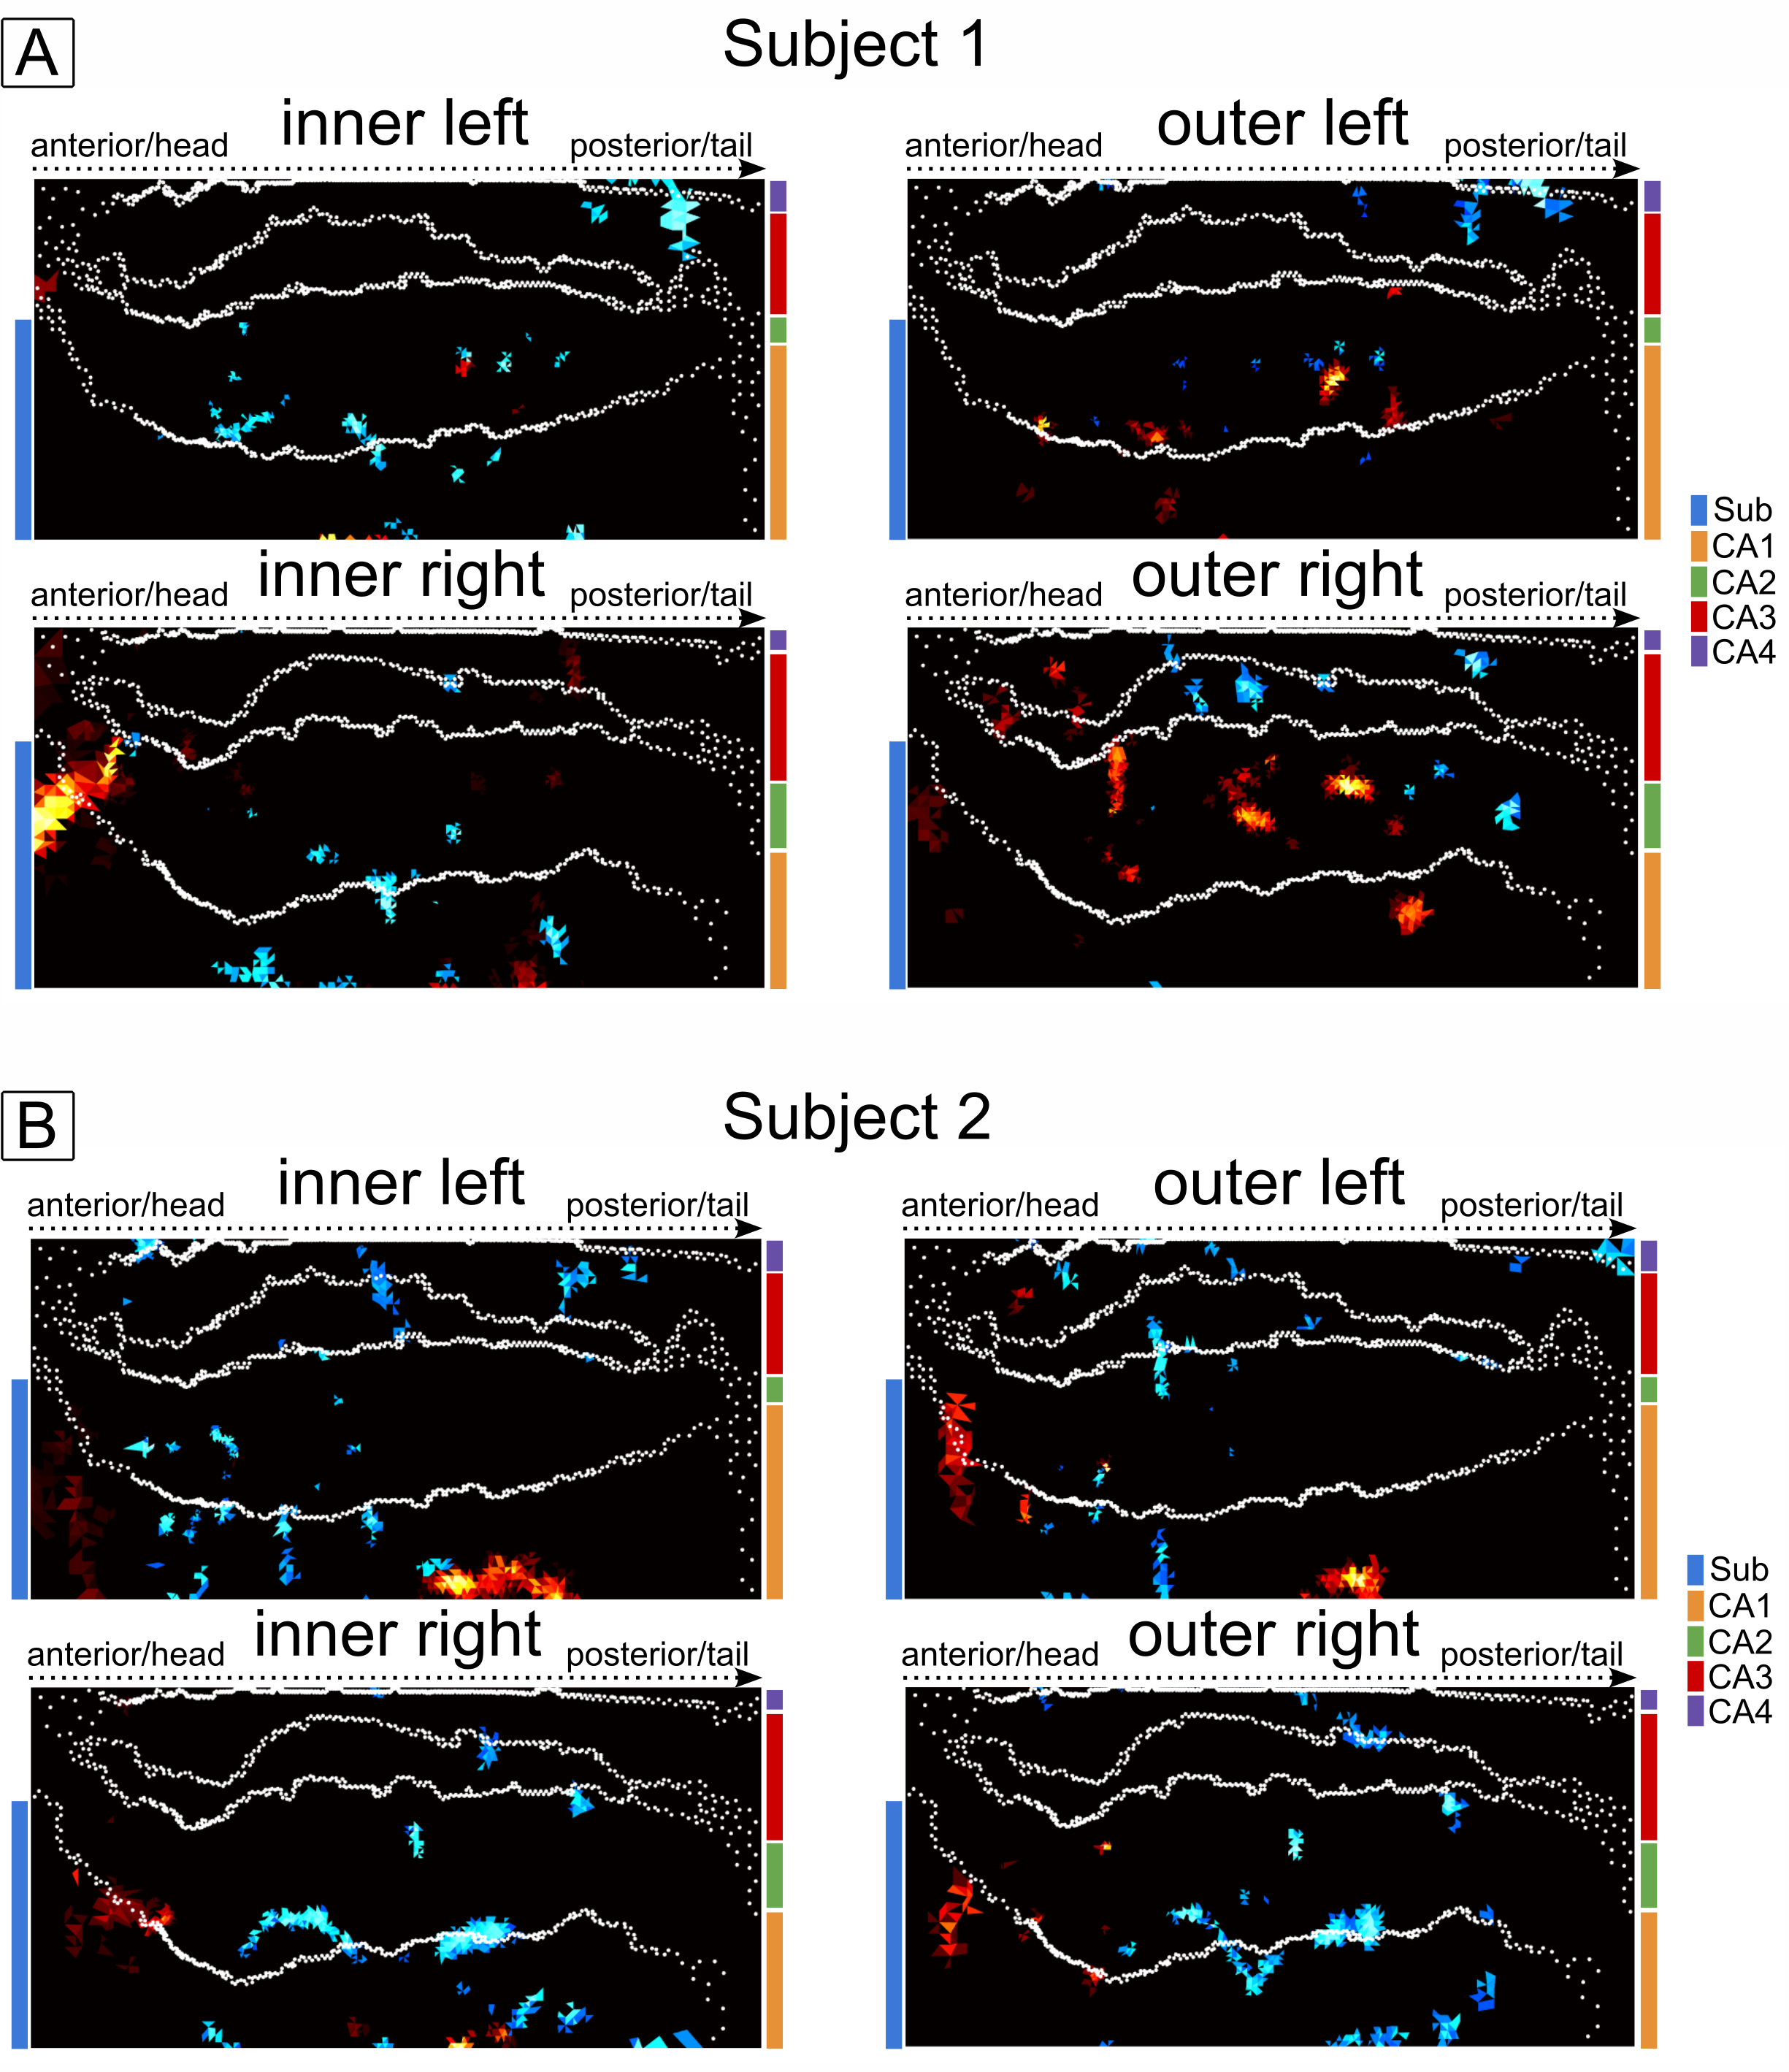
The example residual maps of subject 1 after GLM analysis (Fig. 2) show that aCompCor successfully removed a large amount of variance associated with cardiac and respiratory cycles. This translates into significantly different slopes of the laminar profiles compared to the case without accounting for physiological noise. Consequently, the similarity between sessions is increased (Fig. 3) showing reproducible laminar patterns for both subjects (Fig. 4). The profiles’ amplitude were consistent with the literature12 (higher signal change in the subiculum compared to the remaining subfields) and the profiles exhibited a stronger bias toward the inner hippocampal surface. This might be attributed to differences in venous vasculature (Fig. 5).Discussion & Conclusion
We show that robust laminar fMRI of the human HP is feasible and reproducible within subjects. Moreover, inter-subject differences in vascular anatomy must be taken into account and increased physiological noise in deep brain areas must be corrected when interpreting hippocampal laminar profiles acquired with GRE-BOLD. In future it may be necessary to divide regions into smaller territories where the venous drainage is unidirectional.Acknowledgements
This work was funded by Mercur grant Ko-2021-0010. The MAGNETOM Terra used in the study was funded by the Deutsche Forschungsgemeinschaft (DFG, German Research Foundation)-Projektnummer 432647511.
References
1. Brown, T. I., Gagnon, S. A., & Wagner, A. D. Stress disrupts human hippocampal-prefrontal function during prospective spatial navigation and hinders flexible behavior. Curr. Biol. 30, 1821–1833 (2020).
2. McCormick, C., St-Laurent, M., Ty, A., Valiante, T. A., & McAndrews, M. P. Functional and effective hippocampal–neocortical connectivity during construction and elaboration of autobiographical memory retrieval. Cereb. Cortex 25, 1297–1305 (2015).
3. Stirnberg, R. & Stöcker, T. Segmented K-space blipped-controlled aliasing in parallel imaging for high spatiotemporal resolution EPI. Magn. Reson. Med. 85, 1540–1551 (2021).
4. Marques, J. P. et al. MP2RAGE, a self bias-field corrected sequence for improved segmentation and T1-mapping at high field. Neuroimage 49, 1271–1281 (2010).
5. Gallichan, D., Marques, J. P. & Gruetter, R. Retrospective correction of involuntary microscopic head movement using highly accelerated fat image navigators (3D FatNavs) at 7T. Magn. Reson. Med. 75, 1030–1039 (2016).
6. Maggioni, M., Katkovnik, V., Egiazarian, K., Foi, A. Nonlocal transform-domain filter for volumetric data denoising and reconstruction. IEEE Trans. Image Process. 22, 119–133 (2013).
7. R.F. Frangi, W.J. Niessen, K. Vincken, M. A. V. Multiscale vessel enhancement filtering. in International Conference on Medical Image Computing and Computer-Assisted Intervention – MICCAI 130–137 (1998).
8. Kashyap, S. srikash/presurfer: ondu. https://github.com/srikash/presurfer (2021).
9. DeKraker, J. et al. Automated hippocampal unfolding for morphometry and subfield segmentation with HippUnfold. Elife 11, e77945 (2022).
10. Kashyap, S. et al. Sub-millimetre resolution laminar fMRI using Arterial Spin Labelling in humans at 7 T. PLoS One 16, 1–23 (2021).
11. Behzadi, Y., Restom, K., Liau, J., et al. A component based noise correction method (CompCor) for BOLD and perfusion based fMRI. Neuroimage 37, 90–101 (2007).
12. Leelaarporn, P., Dalton, M. A., Stirnberg, R., Stöcker, T., Spottke, A., Schneider, A., & McCormick, C. Hippocampal subfields and their neocortical interactions during autobiographical memory. bioRxiv (2022).
Figures