3127
Functional quantitative susceptibility mapping for layer specific activation1Radiology, Mayo Clinic, Jacksonville, FL, United States
Synopsis
Keywords: fMRI Analysis, fMRI, layer fQSM
Motivation: The feasibility of high-resolution fQSM at ultra-high field and the good localization properties of fQSM as well as its quantitative nature motivated this study which aims to use fQSM for investigating layer-dependent activation.
Goal(s): To investigate the feasibility to study layer-dependent activation with fQSM.
Approach: Data were acquired with a segmented multi-shot 3D EPI sequence at 7 Tesla, high-resolution data were denoised prior to fQSM computation. Layer-dependet fMRI and fQSM signals were extracted from 20 layers.
Results: fQSM shows distinctively different activation patterns across cortical layer compared to fMRI.
Impact: High-resolution fQSM acquired at 7 Tesla is used to study layer dependence of fQSM in comparison with BOLD fMRI. fQSM quantifies the underlaying susceptibility change more directly, therefore it might be feasible to use fQSM to study layer-dependent activation.
Introduction
Functional quantitative susceptibility mapping (fQSM) has been explored in the past1-3. As QSM directly computes the susceptibility change related to a change in blood oxygenation and fQSM has been shown to have better localization properties than fMRI, this abstract explores layer-dependent fQSM.Methods
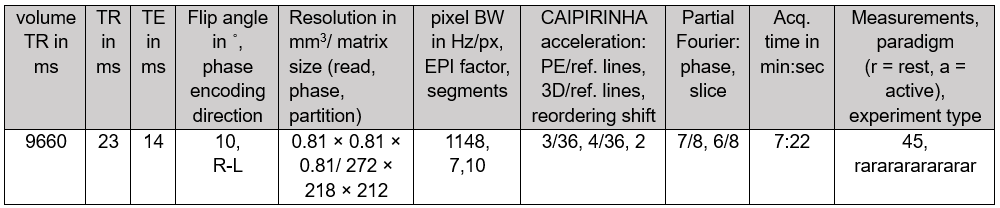
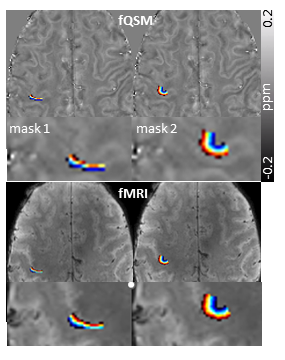
In one healthy volunteer, right-hand finger tapping data were acquired on the investigational parallel transmit part of a 7T scanner (MAGNETOM Terra, Siemens Healthcare, Erlangen, Germany) with an investigational 8Tx-32Rx head coil (Nova Medical Inc., Wilmington, MA, USA) using a segmented, multi-shot 3D EPI research sequence with skipped-CAIPIRINHA acceleration4-9 in accordance with Institutional Review Board approval. Sequence parameters and the used paradigm are given in Table 1. The paradigm was custom written for the protocol, start and stop commands for the paradigm were displayed on an LCD monitor (NordicNeuroLab Inc. Milwaukee, WI, USA) and viewed through a mirror mounted to the head coil. Complex data were denoised using NORDIC (NOise reduction with DIstribution Corrected)10. Susceptibility maps were computed for each volume using 3D path-based unwrapping11, V-SHARP12 with a brain mask generated for the average of all volumes of each dataset with FSL-BET13 and STAR-QSM14 which are implemented in the SEPIA toolbox15. Each volume was referenced to the mean susceptibility value of the whole brain. Data were up-sampled by a factor of four in Matlab and two layer masks with 20 layers each were generated using LayNii16. Layer masks are shown in Figure 1.Results
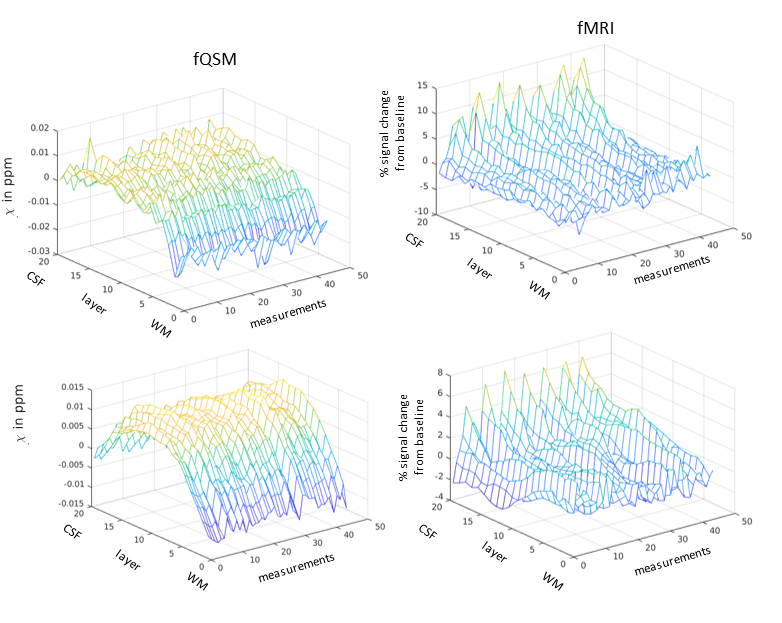
Figure 2 shows activation- and layer-dependent fQSM signal and fMRI percent signal change from baseline. An activation-dependent increase of fMRI and a decrease for fQSM can be observed across layers. For fMRI this increase is highest in the outer cortical layers close to the CSF boundary. It can be appreciated that the fQSM signal shows distinctively different pattern compared to the BOLD fMRI signal.Discussion and Conclusion
The observations of this abstract are preliminary and the value of fQSM to study layer-dependent activation has to be further studied in the future.Acknowledgements
No acknowledgement found.References
[1] Balla DZ et al., Neuroimage 2014, [2] Özbay PS et al. Neuroimage 2016, [3] Lancione M et al. Neuroimage 2021, [4] Jin J et al. Proc. Annu. Meeting ISMRM 2021, [5] Tourell M et al., Proc. Annu. Meeting ISMRM 2021, [6] Poser BA et al. Neuroimage 2010, [7] Poser BA et al. Proc. Eur. Soc. Magn. Reson. Med. B 2013, [8] Sati P et al. Multiple Sclerosis Journal 2014, [9] Stirnberg R et al. MRM 2021, [10] Moeller S et al. Neuroimage 2021, [11] Abdul-Rahman HS et al. Applied Optics 2007, [12] Li W et al. Neuroimage 2011, [13] Smith SM Hum.Brain Mapp 2002, [14] Wei H et al. NMR Biomed 2015, [15] Chan KS et al. Neuroimage 2021, [16] Huber L et al. NeuroImage 2021.Figures