3122
Towards quantitative characterization of airway collapse in obstructive sleep apnea1Roy J Carver Department of Biomedical Engineering, University of Iowa, iowa city, IA, United States, 2Department of Otolaryngology, University of Iowa, iowa city, IA, United States, 3Department of Neurology, University of Iowa, iowa city, IA, United States, 4Department of Radiology, University of Iowa, iowa city, IA, United States
Synopsis
Keywords: Segmentation, Segmentation
Motivation: The motivation for this research study is to better understand and characterize upper-airway collapse during sleep in patients with obstructive sleep apnea (OSA). The study aims to provide valuable insights into the dynamics of airway collapse.
Goal(s): The main goal is to quantitatively assess upper-airway collapse dynamics in both OSA and normal individuals, developing imaging phenotypes.
Approach: The research methodology involves data collection using MRI, manual analysis for quantitative imaging phenotypes, and presenting qualitative and quantitative findings.
Results: The study effectively visualizes airway collapse patterns in normal and OSA patients, develops quantitative imaging phenotypes, and distinguishes various collapse patterns.
Impact: The study's results provide researchers with new, quantitative insights into upper-airway collapse in sleep apnea. This may enable more precise diagnosis and treatment, stimulate further research into non-CPAP therapies, and improve the quality of care for patients with sleep apnea.
Introduction
Obstructive sleep apnea (OSA) is characterized by dynamic, breathing-related obstructions of the upper airway during sleep. Continuous positive airway pressure (CPAP) therapy is the first-line treatment of OSA, but about 30-70% of OSA patients cannot use CPAP consistently. Various non-CPAP therapies have emerged as alternatives (eg. surgical resection of intraluminal obstructive tissues, and hypoglossal nerve stimulation therapy1). A first clinical step in such non-CPAP therapies is to screen patient candidacy by characterizing the dynamics of upper-airway collapse, particularly at the levels of velopharynx, oropharynx, tongue base, epi-glottis, and distinguishing between anterior-posterior; lateral; concentric collapse spatio-temporal patterns. The clinical standard of using drug-induced sleep endoscopy has notable challenges (eg. use of anesthesia to induce sleep, lack of quantitative assessment of collapse)2,3. Dynamic 3-dimensional MRI of the upper-airway is a promising new alternative to visualize the collapsing airway during natural sleep in OSA4–6. In this work, we perform preliminary feasibility of extracting quantitative imaging phenotypes to characterize dynamics of airway collapse from 3-D dynamic upper-airway MRI datasets.Methods
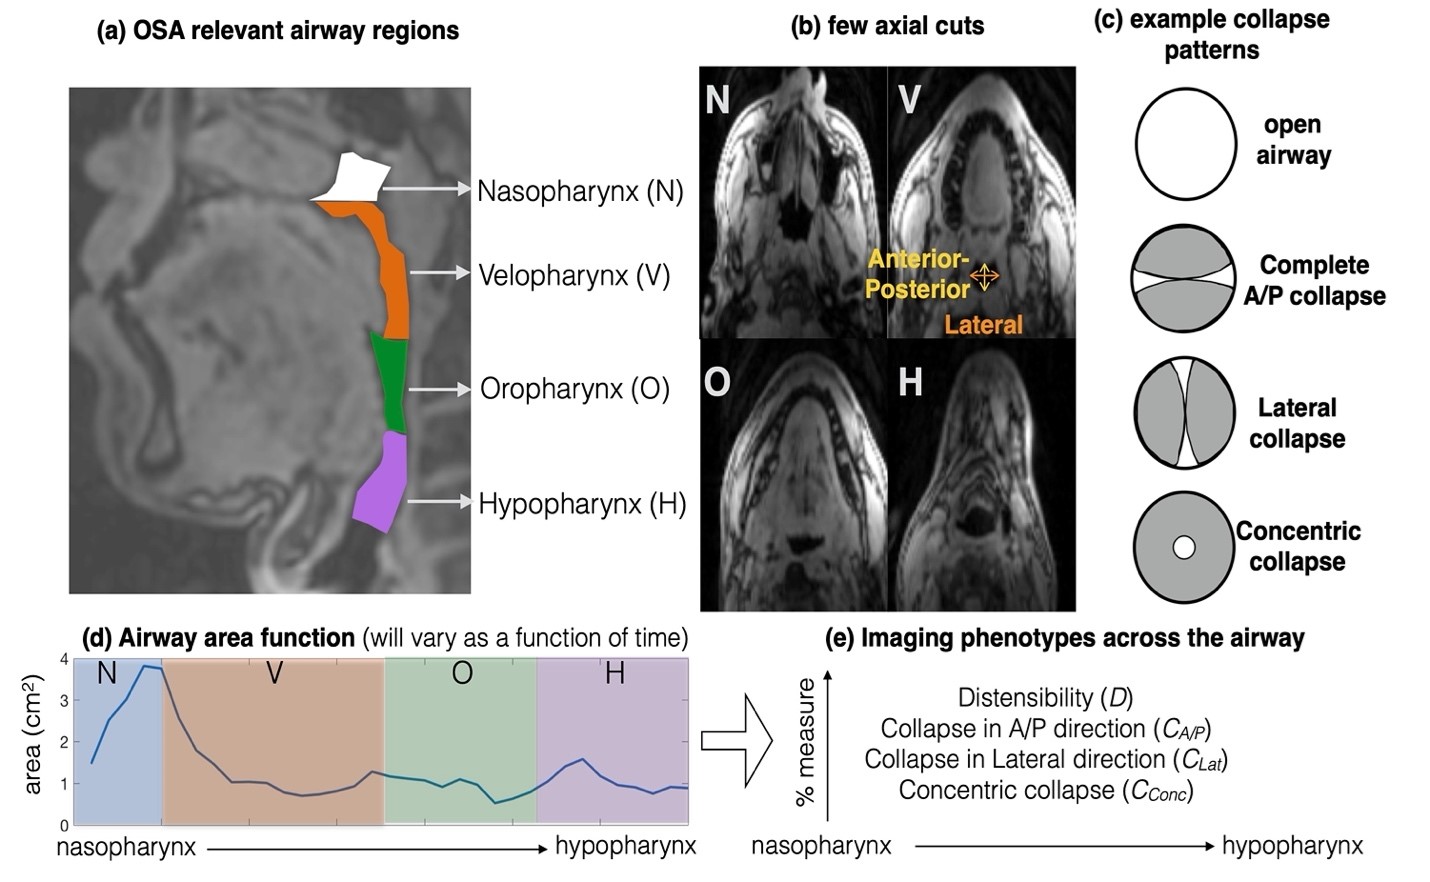
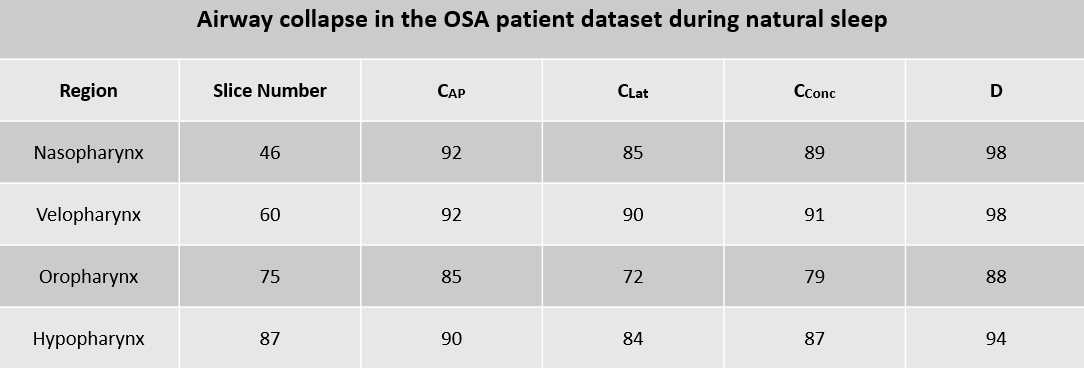
Experiments were performed on a 3T GE Premier scanner equipped with high-performance gradients (80 mT/m amplitude and 150 mT/m/ms slew rate) using either a 21 channel head-neck coil or a 16 channel custom airway coil. One normal volunteer performed the Muller’s manuever mimicking airway collapse in the awake state. One OSA patient was recruited and imaged during natural sleep. Condition of sleep was confirmed by monitoring changes in simultaneously recorded physiological signals (eg. breathing effort levels, 02 saturation levels). A 3D Cartesian GRE sequence was implemented with sparse variable density view-ordering in the ky-kz plane. The sequence was prescribed with parameters; FOV: 20cm x 20 cm x 8 cm; spatial resolution: 2mm x 2mm x 2mm; flip angle: 5 degrees; minimum TR and TE. The raw k-space vs time data was resorted by using 209 points in the ky-kz plane per time frame, which corresponds to a time resolution of 543.4 ms. Reconstruction was performed using sparse SENSE employing finite difference constraints along space and time.In the normal Muller’s maneuver dataset, we have manually segmented a time-varying airway area function from the airway cross-sectional area in every fourth axial cut from the nasopharynx to the oropharynx, one time instance of which is shown in Fig. 1. From these area functions, we derived the following phenotypes to quantitate the pattern of airway shaping in each axial cut: (a) Distensibility, D= (Areamax – Areamin)/Areamax); (b) Collapse in the Anterior-Posterior (AP) direction, CAP= (APmax – APmin)/APmax; (c) Collapse in the Lateral (Lat) direction, CLateral= (Latmax – Latmin)/Latmax; (d) Concentric collapse CConc= (CAP + CLat)/2; where Areamax, Areamin are the maximum and minimum areas of the airway over the course of a collapse event in sleep state. (APmax,APmin) and (Latmax,Latmin) are the maximum, and minimum dimensions of the airway respectively in the anterior-posterior and lateral directions. All the indices are established as a percent measure. D gives a measure of the overall airway compliance where a high D signifies the airway being highly distensible (or highly collapsible), and vice-versa. Similarly CAP, CLat, Cconc respectively characterize the percent collapse in the anterior-posterior, lateral, and concentric directions. We have done a similar analysis on the OSA patient dataset but on representative 4 axial cuts in each of the nasopharynx, velopharynx, oropharynx, hypopharynx regions. All segments were performed manually in the 3D SLICER software.
Results
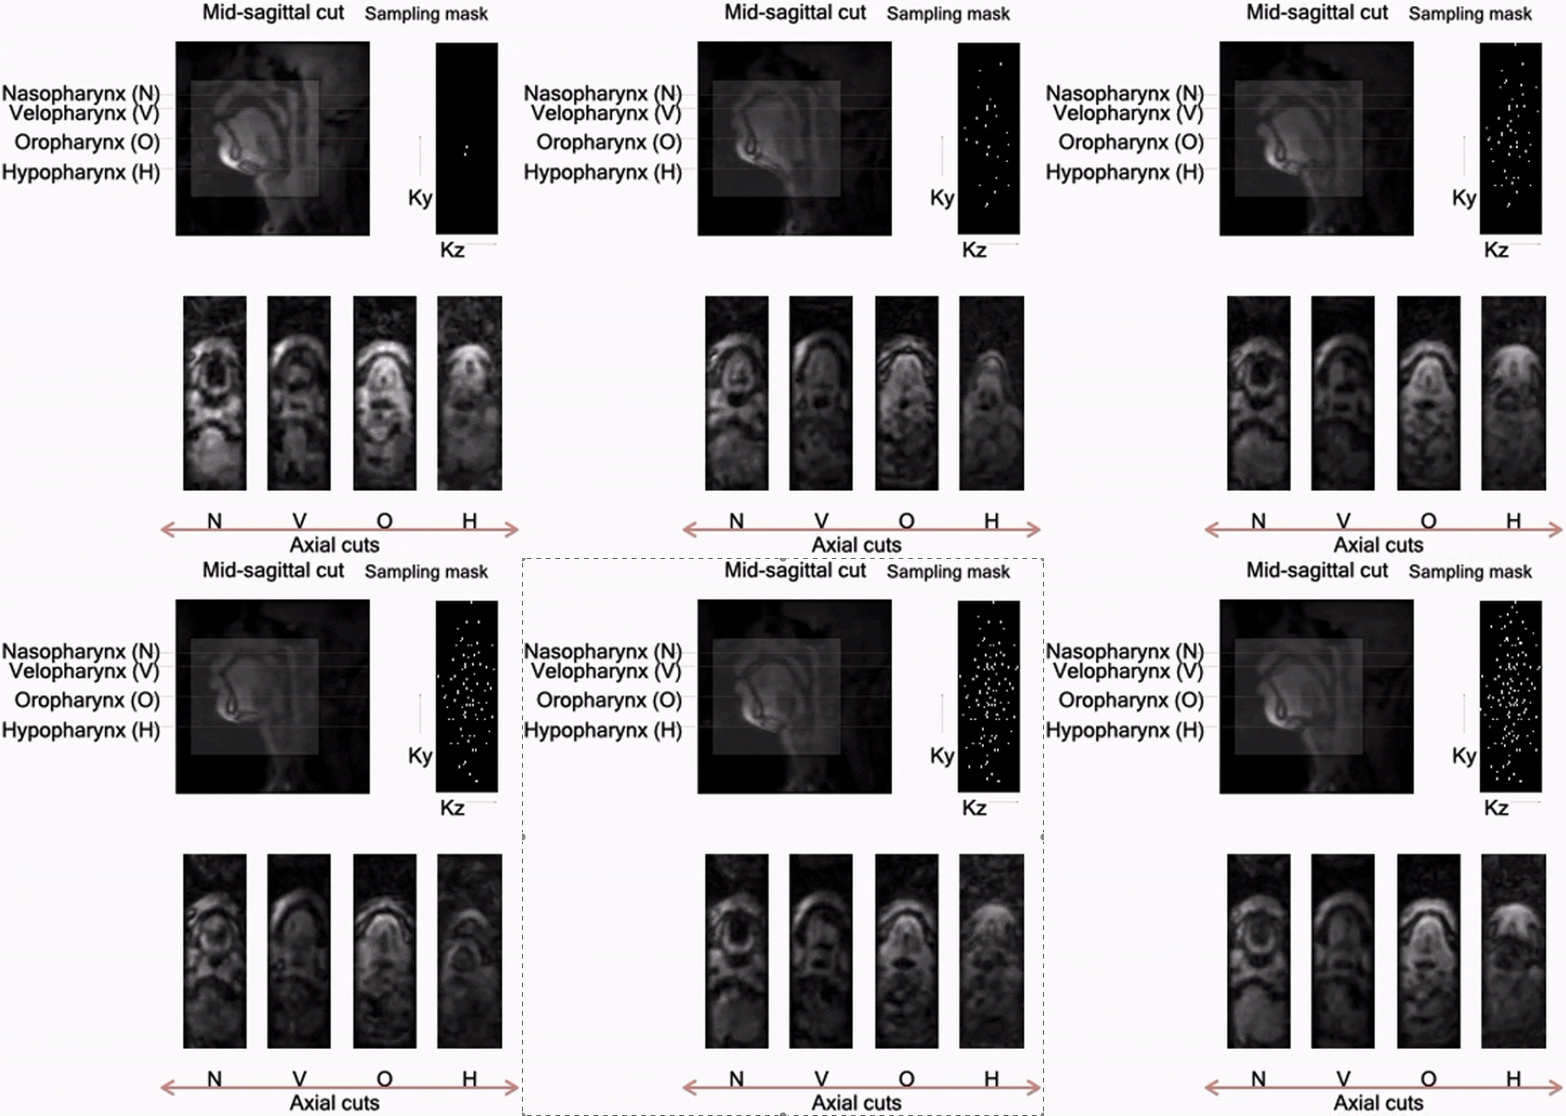
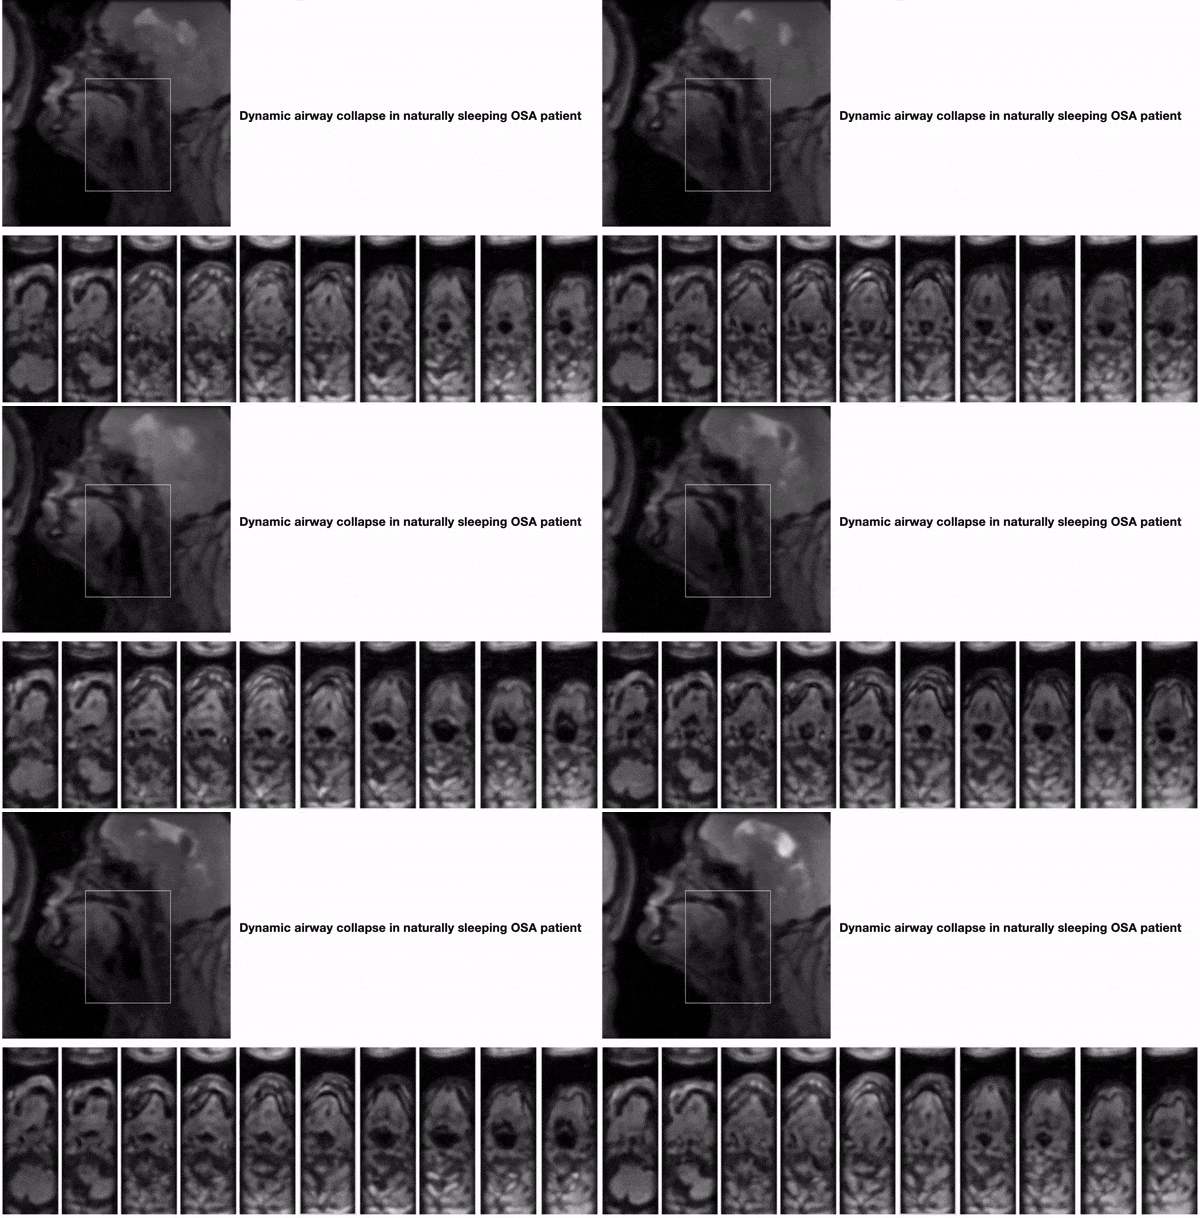
Fig. 2 shows an example of the sparse view ordering in the ky-kz plane, and the corresponding 3D reconstructions of simulated airway collapse in the normal volunteer during Muller’s manuever. For example, nasopharynx, velopharynx, oropharynx, and hypopharynx cuts are shown faithfully depicting the airway collapse patterns in the awake state.Fig. 3 shows the 3D dynamics of the airway collapse in the naturally sleeping OSA patient. Qualitatively, we observe concentric collapse in several of the axial cuts (particularly at the velopharynx level).
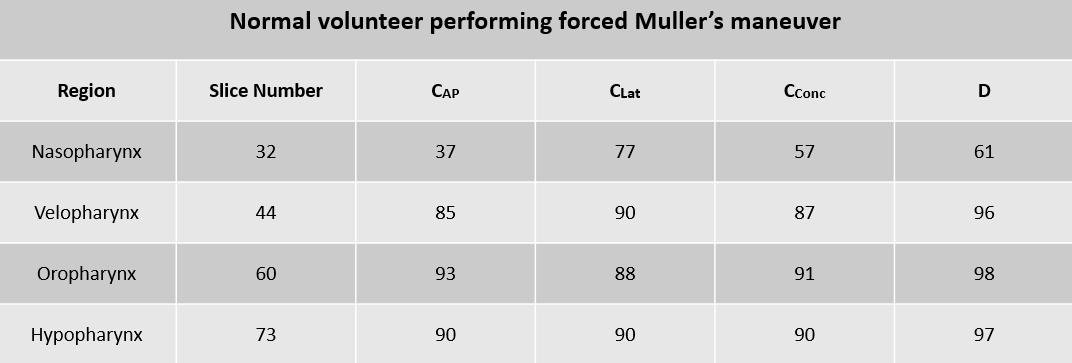
In Table 1(Fig. 4), we observe a high degree of concentric collapse (>87%) at all axial cuts, except the nasopharynx level (where the lateral collapse was dominant at 77%). In Table 2 (Fig. 5) (on the OSA patient dataset), We observe an increasing amount of concentric collapse in all the axial cuts (>87), except at the oropharynx level, where the anterior-posterior collapse is dominant (85%)
Conclusion
This work presented the preliminary applicability of manual segmentation on 3D+time deforming upper-airway datasets to extract imaging phenotypes quantitatively characterizing airway collapse in the anterior-posterior; lateral; and concentric directions. Future work includes automating the pipeline by efficient deep learning-based segmentations, and further analysis of multiple OSA patient-datasets.Acknowledgements
This work was conducted on an MRI instrument funded by 1S10OD025025-01References
1. Costantino A, Rinaldi V, Moffa A, et al. Hypoglossal nerve stimulation long-term clinical outcomes: a systematic review and meta-analysis. Sleep Breath. Published online 2020. doi:10.1007/s11325-019-01923-2
2. Chao TN, Thaler ER. Predictors of success in hypoglossal nerve stimulator implantation for obstructive sleep apnea. World J Otorhinolaryngol - head neck Surg. 2020;7(1):40-44. doi:10.1016/J.WJORL.2020.02.007
3. Kellner P, Herzog B, Plößl S, et al. Depth-dependent changes of obstruction patterns under increasing sedation during drug-induced sedation endoscopy: results of a German monocentric clinical trial. Sleep Breath. Published online 2016. doi:10.1007/s11325-016-1348-6
4. Kim Y-C, Lebel RM, Wu Z, Ward SLD, Khoo MCK, Nayak KS. Real-time 3D magnetic resonance imaging of the pharyngeal airway in sleep apnea. Magn Reson Med. 2014;71(4):1501-1510. doi:10.1002/mrm.24808
5. Alam W, Rusho RZ, Liu J, Van Daele D, Jacob M, Lingala SG. Accelerated imaging of airway collapse in obstructive sleep apnea with variable density spirals and variational manifold regularization. In: ISMRM Workshop on Data Sampling and Image Reconstruction. ; 2023.
6. Javed A, Kim YC, Khoo MCK, Ward SLD, Nayak KS. Dynamic 3-D MR visualization and detection of upper airway obstruction during sleep using region-growing segmentation. IEEE Trans Biomed Eng. Published online 2016. doi:10.1109/TBME.2015.2462750
Figures