3120
Principal Deformation Analysis of Cleft Palate Speech Using Atlas-Driven Dynamic Vocal Tract MRI1Department of Radiology, Harvard Medical School, Boston, MA, United States, 2Department of Bioengineering, University of Illinois at Urbana-Champaign, Urbana, IL, United States, 3Beckman Institute for Advanced Science and Technology, University of Illinois at Urbana-Champaign, Urbana, IL, United States, 4Department of Communication Sciences and Disorders, East Carolina University, Greenville, NC, United States
Synopsis
Keywords: Data Processing, Data Analysis, Speech, motion, atlas, dynamic MRI, cleft palate
Motivation: Characterizing velopharyngeal motion patterns in children with cleft palate is an important research topic.
Goal(s): Utilizing recently improved dynamic MRI techniques, we aim to uncover distinctive deformation patterns in cleft palate speech from a statistical perspective.
Approach: We propose a post-processing pipeline based on spatiotemporal atlases, manually segmented velopharyngeal labels, deformable registration, and principal component analysis. The speech dataset consisting of 17 normal controls and 4 patients was analyzed.
Results: The proposed method effectively captures and separates patient-specific deformation patterns within principal component’s feature spaces. Furthermore, it reveals the impact from different anatomical regions in cleft palate speech.
Impact: In practice, cleft palate patterns in speech MRI are too subtle for visual examination or conventional post-processing methods to reveal. Providing a solution to uncover such patterns is essential to help understand the anatomical and functional changes in this disorder.
Introduction
Understanding the characteristics of cleft palate and hypernasal speech is essential for improving the effectiveness of surgical interventions for these disorders1. With the rapid developments of fast dynamic magnetic resonance imaging (MRI), it has become an excellent tool for capturing velopharyngeal motion patterns of underlying muscles in real-time speech2,3. However, in reconstructed MRI sequences using state-of-the-art methods4,5, simple visual or algorithmic assessments struggle to reveal patient-specific deformation patterns. We propose a post-processing pipeline that defines a feature space based on principal components (PCs) from a statistical perspective. MRI data from a population are acquired and deformed into a previously developed spatiotemporal atlas space6-8, in which their motion fields over time are normalized within a common framework, computed using deformable registration, and labeled by manual segmentation. The principal deformation patterns of the patients are extracted into a unique feature space using two layers of principal component analysis (PCA), separating patients’ speech deformations from those of normal controls. Furthermore, unique deformation patterns for each segmented pharyngeal structure are uncovered and analyzed.Methods
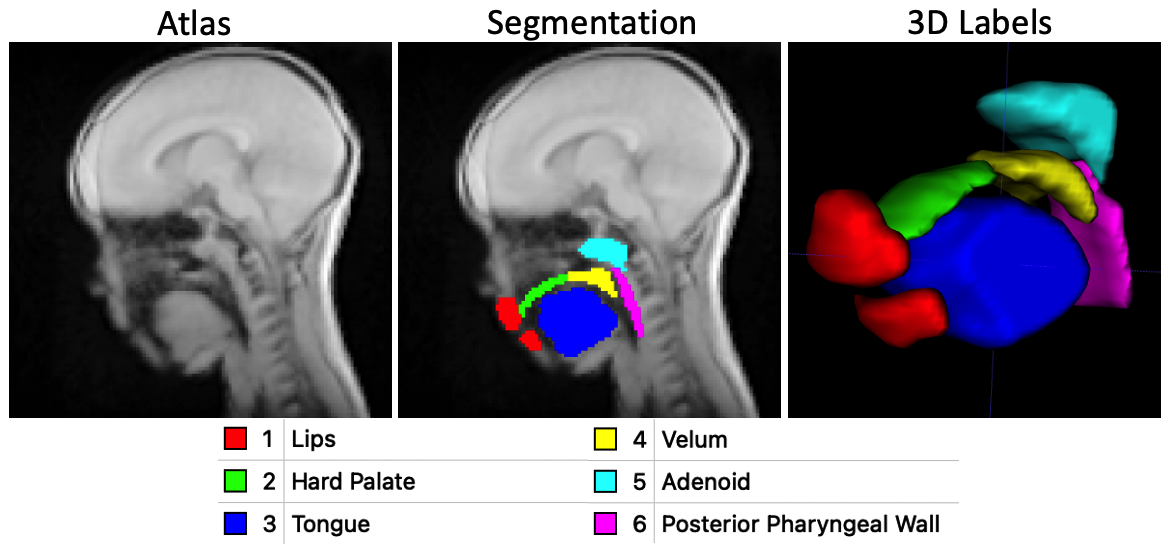
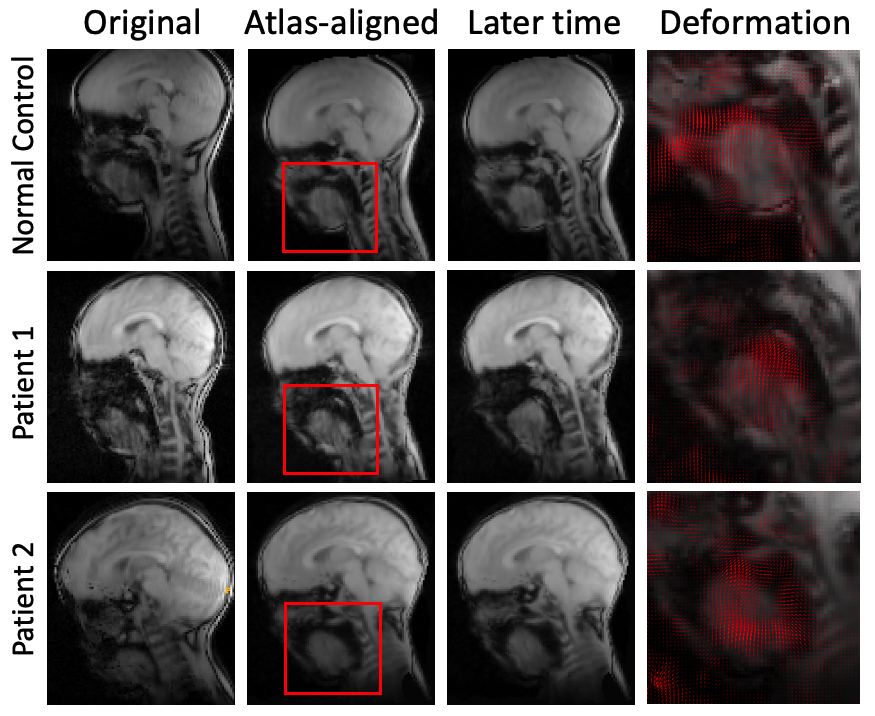
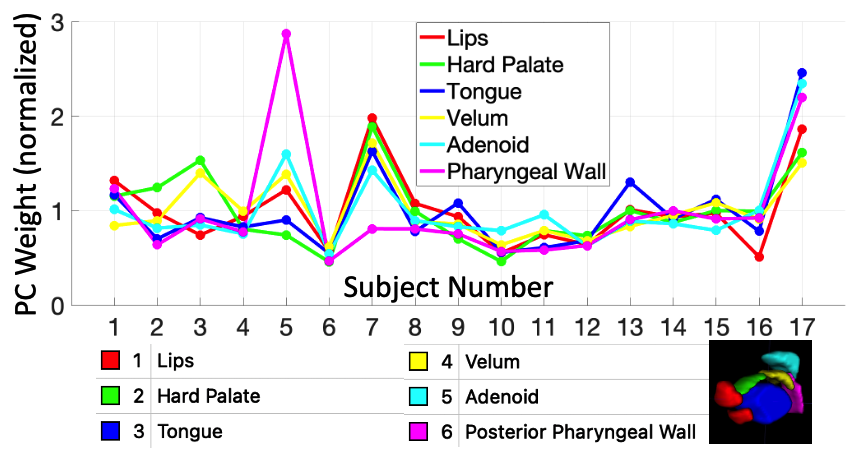
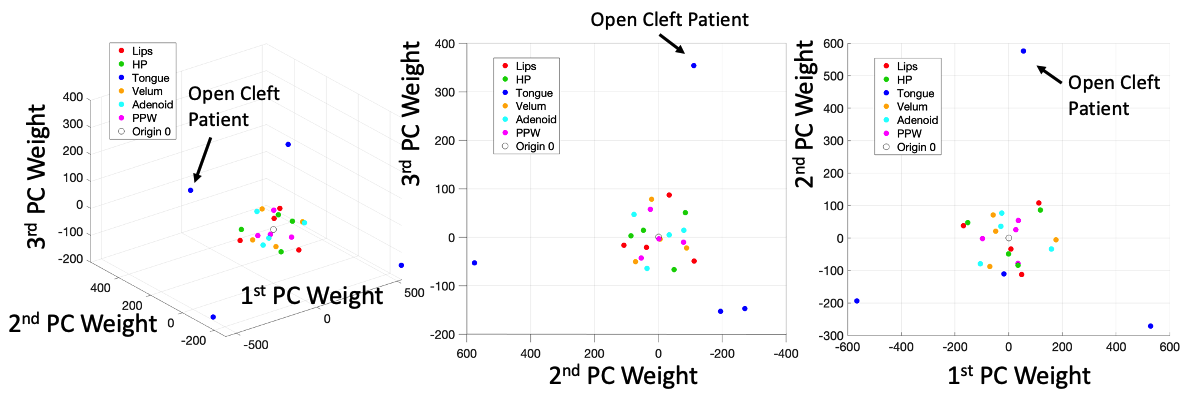
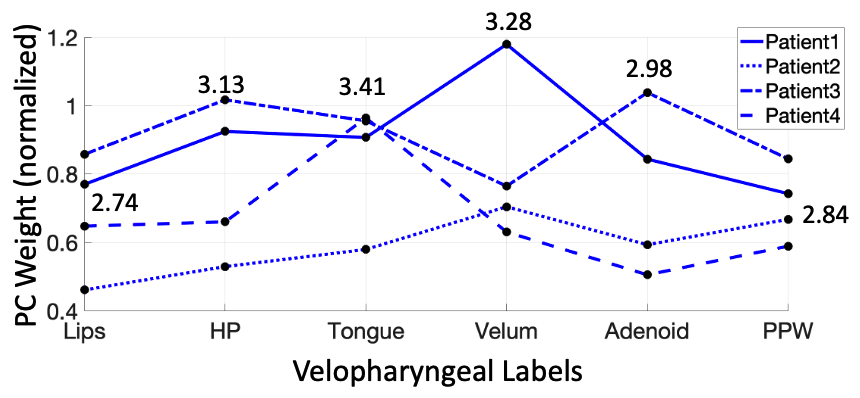
17 healthy control children and 4 patients with a history of cleft palate (including a patient with an open cleft palate) participated in the study in accordance with the IRB guidelines. Dynamic MRI data pronouncing the speech task “get a cookie” were acquired and reconstructed5, yielding a series of 128×128×10 image volumes with a 1.875×1.875×6 mm3 resolution for each subject. A 4D atlas $$$A(\mathbf{X},t)$$$ was constructed following the previously proposed spatiotemporal alignment methods using the 17 controls6-8. Each image sequence $$$I_s(\mathbf{X}_s,t), 1 \leq t \leq 48$$$ of subject $$$s$$$ in its spatial grid $$$\mathbf{X}_s$$$ was realigned into 48 time frames. A speech expert performed manual segmentation, labeling six velopharyngeal structures—lips, hard palate, tongue, velum, adenoid, and posterior pharyngeal wall (Figure 1). We further normalized all subject’s original image sequences $$$I_s(\mathbf{X}_s,t)$$$ to the common atlas spatial grid $$$\mathbf{X}$$$ for uniform statistical comparison using the ANTs tool9 based on the SyN image registration method10. The registered moving image $$$I_s(\mathbf{X}_s,t)$$$ to the fixed atlas $$$A(\mathbf{X},t)$$$ was represented as $$$J_s(\mathbf{X},t)$$$ (Figure 2). We then applied ANTs again between all subsequent time frames $$$J_s(\mathbf{X},t), 2 \leq t \leq 48$$$ and the first frame $$$J_s(\mathbf{X},1)$$$ to compute 47 deformation fields $$$\mathbf{u}_s(\mathbf{X},t), 2 \leq t \leq 48$$$ (Figure 2). Considering each aligned deformation field sequence as a sample of the whole speech task, a first layer of PCA was performed on all the fields from all 17 subjects. This control-specific space represented normal deformation’s features. We performed PCA independently for each labeled region and plotted each subject's projected weight (Figure 3). Since patient motion characteristics was latent, we adopted the two-step PCA method11 and added a secondary PCA layer on the remainder of the patient deformation fields $$$\mathbf{v}_p(\mathbf{X},t), 2 \leq t \leq 48, 1 \leq p \leq 4$$$ after their projection into the control-specific space. The degree of freedom using 4 patients was 3, and we visualized their projections in the 3D patient-specific space in Figure 4. All patient PC weights for each labeled region were summarized in Figure 5.Results and Discussion
When deformation fields are represented using new PC feature spaces, a higher weight indicates more variability among all projected samples. Figure 3 identified subjects (7 and 17) and structures (subject 5, label 6) that varied more from the whole population. To ensure a fair comparison between labeled regions, the weights were normalized by their mean in each label to eliminate the impact of regional deformation magnitude differences. Figure 4 visualized the patient-specific PC space after their control-similar deformation components were subtracted, revealing only patient-specific abnormal deformations. Farthest from the origin, the tongue exhibited the largest magnitude of variations. Hindered from poor speech functionality near the soft palate, patients appeared to rely more on tongue motion. Therefore, deformations in the patient tongues were the largest and most variant. Additionally, Patient 1 with an open cleft displayed the highest weight in the 2nd PC direction, likely associated with distinct open cleft deformation features. Figure 6 showed patient variations in different structures. The tongue had a highest 3.41 weight, confirming the previous observation. The velum (3.28) exhibited the second-highest deformation and variation. The lips and pharyngeal wall (least weighted) barely deformed during the task. The patient with open cleft palate displayed the highest tongue variability once again.Conclusion
We presented an atlas-driven feature learning method on dynamic speech MRI to distinguish cleft palate deformation characteristics from normal motion. Unique patterns in the tongue and velum were identified to predominantly contribute to patient variations, differentiating them from the controls.Acknowledgements
This work was supported by NIH R01DE027989 and R01DC018511. The content is solely the responsibility of the authors and does not necessarily represent the official views of the National Institutes of Health.References
1. Perry, J. L., Kuehn, D. P., Sutton, B. P., & Fang, X. (2017). Velopharyngeal structural and functional assessment of speech in young children using dynamic magnetic resonance imaging. The Cleft Palate-Craniofacial Journal, 54(4), 408-422.
2. Fu, M., Barlaz, M. S., Holtrop, J. L., Perry, J. L., Kuehn, D. P., Shosted, R. K., ... & Sutton, B. P. (2017). High‐frame‐rate full‐vocal‐tract 3D dynamic speech imaging. Magnetic resonance in medicine, 77(4), 1619-1629.
3. Lingala, S. G., Sutton, B. P., Miquel, M. E., & Nayak, K. S. (2016). Recommendations for real‐time speech MRI. Journal of Magnetic Resonance Imaging, 43(1), 28-44.
4. Jin, R., Shosted, R. K., Xing, F., Gilbert, I. R., Perry, J. L., Woo, J., ... & Sutton, B. P. (2022). Enhancing linguistic research through 2‐mm isotropic 3D dynamic speech MRI optimized by sparse temporal sampling and low‐rank reconstruction. Magnetic Resonance in Medicine, 89(2), 652-664.
5. Jin, R., Li, Y., Xing, F., Gilbert, I. R., Perry, J. L., Woo, J., ... & Sutton, B. P. (2023). Optimization of three-dimensional dynamic speech MRI: Poisson-disc under sampling and locally higher-rank reconstruction through partial separability model with regional optimized temporal basis. Magnetic Resonance in Medicine. doi: 10.1002/mrm.29812.
6. Woo, J., Xing, F., Lee, J., Stone, M., & Prince, J. L. (2018). A spatio-temporal atlas and statistical model of the tongue during speech from cine-MRI. Computer Methods in Biomechanics and Biomedical Engineering: Imaging & Visualization, 6(5), 520-531.
7. Woo, J., Xing, F., Stone, M., Green, J., Reese, T. G., Brady, T. J., ... & El Fakhri, G. (2019). Speech map: A statistical multimodal atlas of 4D tongue motion during speech from tagged and cine MR images. Computer Methods in Biomechanics and Biomedical Engineering: Imaging & Visualization, 7(4), 361-373.
8. Xing, F., Jin, R., Gilbert, I. R., Perry, J. L., Sutton, B. P., Liu, X., El Fakhri, G., Shosted, R. K., & Woo, J. (2021). 4D magnetic resonance imaging atlas construction using temporally aligned audio waveforms in speech. Journal of the Acoustical Society of America,150(5), 3500-3508.
9. Avants, B. B., Tustison, N., & Song, G. (2009). Advanced normalization tools (ANTs). Insight j, 2(365), 1-35.
10. Avants, B. B., Epstein, C. L., Grossman, M., & Gee, J. C. (2008). Symmetric diffeomorphic image registration with cross-correlation: evaluating automated labeling of elderly and neurodegenerative brain. Medical image analysis, 12(1), 26-41.
11. Xing, F., Woo, J., Lee, J., Murano, E. Z., Stone, M., & Prince, J. L. (2016). Analysis of 3-D tongue motion from tagged and cine magnetic resonance images. Journal of Speech, Language, and Hearing Research, 59(3), 468-479.
Figures