3119
Evaluation of venous oxygen saturation using k-space energy spectrum analysis1Department of Electrical Engineering, National Sun Yat-sen University, Kaohsiung, Taiwan
Synopsis
Keywords: Data Processing, Oxygenation
Motivation: OEF as a biomarker requires SvO2 quantities which can be estimated via susceptometry-based oximetry (SBO). The fundamental is based on the presence of deoxyhemoglobin which induces local field inhomogeneity. The conventional approach for SvO2 estimation via SBO utilizes the phase difference accrued over time between intra- and extravascular compartments.
Goal(s): Our goal was to demonstrate an alternative for SvO2 estimation with a single-echo GRE image.
Approach: In this study, the k-space energy spectrum analysis was performed to quantify k-energy displacement for field inhomogeneity mapping.
Results: The preliminary result shows a comparable SvO2 value as that from the conventional approach.
Impact: Susceptometry-based oximetry, based on field inhomogeneity, has become a metric for SvO2 estimation. The KESA algorithm was applied to a single-echo GRE image to map field inhomogeneity. The comparable SvO2 indicated the potential of KESA in SvO2 estimation.
INTRODUCTION
Cerebral oxygen metabolism primarily relies on a delicate coupling between cerebral blood flow (CBF) and oxygen extraction fraction (OEF). Accordingly, OEF alterations might indicate the imbalance between oxygen consumption and blood supply and has been shown its relevance to the progress of diseases1, 2. Evaluation of venous oxygen saturation (SvO2) is essential for OEF quantification. Susceptometry-based oximetry (SBO), depending on the paramagnetic property of deoxyhemoglobin, has been developed as a great alternative for SvO2 estimation3. In the SBO model, the phase difference accrued over time between the venous draining vessel and the surrounding brain tissue is directly associated with field inhomogeneity induced by deoxyhemoglobin. Conventionally, a multi-echo gradient echo sequence is performed for phase accumulation, which is subsequently used to quantify SvO2. The k-space energy spectrum analysis (KESA) was proposed for field inhomogeneity mapping4. In this study, the potential of a single-echo GRE for SvO2 estimation via SBO was evaluated by using KESA.METHODS
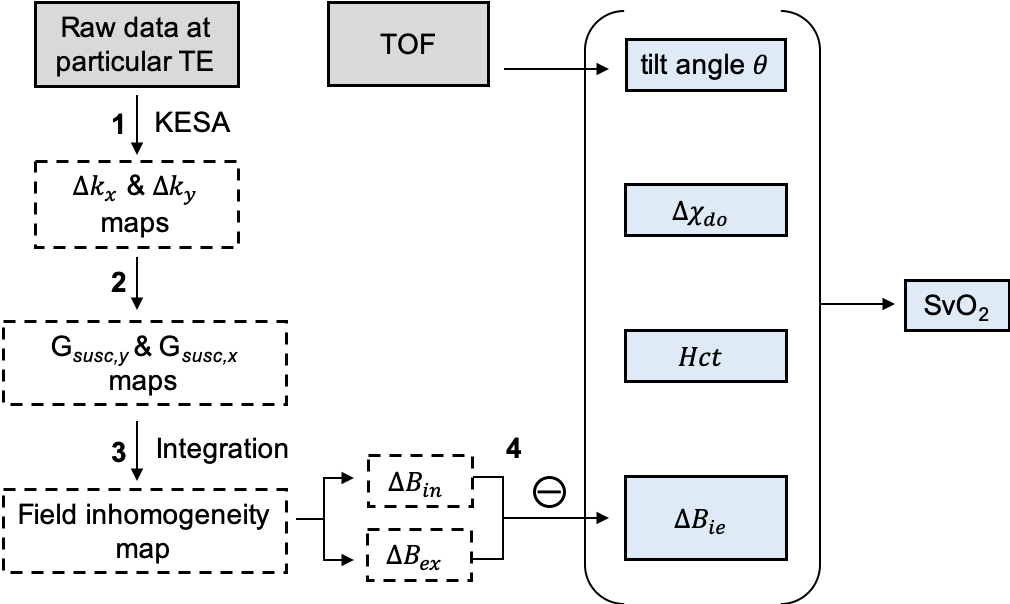
The presence of deoxyhemoglobin in blood causes susceptibility difference (Δχ) relative to the brain tissue, which subsequently induces local field inhomogeneity in the intra- (ΔBin) and extravascular (ΔBex) compartments. In SBO, given the assumptions of an infinite cylinder of the blood vessel and the same effect of the background B0 inhomogeneity in blood and the extravascular tissue, SvO2 can be formulated:$$SvO_{2}=1-\frac{2|\Delta B_{ie}|}{\gamma B_{0}\Delta \chi_{do}Hct(\cos^{2}\theta -\frac{1}{3})} (1)$$
where ΔBie represents the difference between ΔBin and ΔBex, γ is the gyromagnetic ratio, Δχdo represents the susceptibility difference between fully oxygenated and deoxygenated erythrocytes, Hct is the volume fraction of red blood cells, and θ is the vessel tilt angle relative to the main magnetic field (B0).
The deviation of echo peak location in k-space scales with local magnetic field gradient, namely the echo-shifting effect5. As the k-energy displacement can be quantified via KESA, ΔB can be obtained by integrating the field gradients along the frequency (Gsus,x) and phase (Gsus,y) directions, expressed as:
$$G_{sus,x}=\frac{-\Delta k_{x}}{FOV_{x} (\Delta k_{x}\cdot DW+TE)} (2)$$
$$G_{sus,y}=\frac{-\Delta k_{y}}{FOV_{y} \Delta k_{x}} (3)$$
where TE is the designated echo-time, DW represents the dwell time, FOV denotes field-of-view, and Δkx and Δky are the displacement maps along frequency- and phase-encoding directions.
A two-slice interleaved OxFlow sequence was conducted, which was originally developed to simultaneously quantify SvO2 and whole-brain CBF6, 7. Imaging was performed at 3.0T (Siemens Prisma) using a 64-channel head coil. The scanning parameters of OxFlow protocol were: 1x1x5 mm3 voxel size, flip angle of 15°, TR/TE1/ΔTE=20/5.5/3.71 ms in the superior sagittal sinus (SSS).
Image reconstruction and analysis were performed with in-house MATLAB (MathWorks, Natick, MA) scripts. The image collected at TE1 was used for the investigation of the feasibility of KESA for SvO2 estimation. To retain the phase information, coil combination was performed using the Berkeley Advanced Reconstruction Toolbox (BART)8. The moving patch algorithm was applied to facilitate the identification of k-space energy peak displacement. Segmentation of SSS was performed by means of optimum global thresholds determined by maximizing the between-class variance9. The area surrounding the SSS (ref mask) was automatically segmented via morphological processing (i.e., dilation and erosion) of the SSS mask, generating an irregular shape. To verify the estimated SvO2, the phase accumulation between two echoes (∆TE) with equal polarity of the multi-echo GRE was also measured for SvO2 computation. See Figure 1 for data processing diagram.
RESULTS
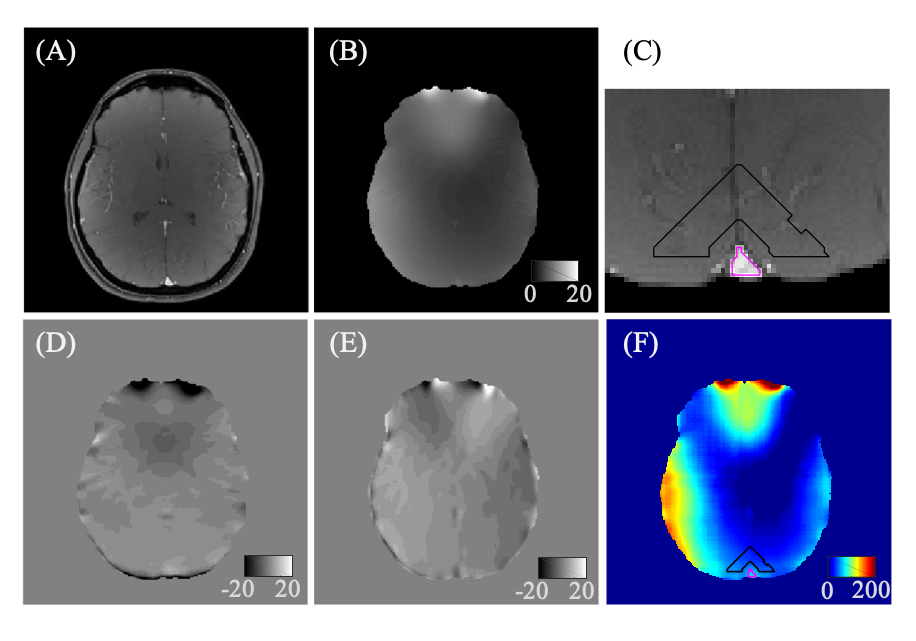
The magnitude and unwrapped phase images collected at TE1 are demonstrated in Figure 2A and 2B. The ROIs of SSS (in magenta, 32 pixels) and the surrounding area (in black, 385 pixels) were overlaid on the zoomed-in magnitude image for better recognition (Fig. 2C). Figure 2D and 2E are the estimated Δkx and Δky displacement maps. The average of Δkx shifting in SSS and the surrounding area are 4 and 1 𝑘-lines. ΔBie was calculated based on the averaged values in SSS (ΔBin) and the surrounding area (ΔBex) from the estimated field inhomogeneity map (Fig. 2F). The tilt angle of 7 degrees, the hematocrit of 37.8%, the susceptibility difference (Δχdo) of 0.193 ppm, along with ΔBie, yields the SvO2 of 63% via the equation 1. In comparison, the SvO2 estimated via phase difference accrued over a time ΔTE was 66.4%.CONCLUSIONS
The purpose of the study was to propose an alternative for SvO2 estimation via SBO by using the KESA algorithm. Further investigation is required to identify an optimal patch size for the most accurate k-energy displacement quantification and for reliable oxygen saturation estimation. In conclusion, our result yielded a comparable SvO2 value in comparison with that from the conventional approach, indicating the potential of KESA in SvO2 estimation.Acknowledgements
This work was supported by the National Science and Technology Council (NSTC 112-2314-B-110-003-).
The co-authors acknowledge the image data from the Laboratory for Structural Physiologic and Functional Imaging led by Dr. Wehrli at University of Pennsylvania.
References
1. Jiang, D., et al., Brain Oxygen Extraction Is Differentially Altered by Alzheimer's and Vascular Diseases. J Magn Reson Imaging, 2020. 52(6): p. 1829-1837.
2. Fan, A.P., et al., Elevated brain oxygen extraction fraction measured by MRI susceptibility relates to perfusion status in acute ischemic stroke. Journal of Cerebral Blood Flow and Metabolism, 2020. 40(3): p. 539-551.
3. Jiang, D. and H. Lu, Cerebral oxygen extraction fraction MRI: Techniques and applications. Magn Reson Med, 2022. 88(2): p. 575-600.
4. Chen, N.K., K. Oshio, and L.P. Panych, Application of k-space energy spectrum analysis to susceptibility field mapping and distortion correction in gradient-echo EPI. Neuroimage, 2006. 31(2): p. 609-22.
5. Posse, S., Direct imaging of magnetic field gradients by group spin-echo selection. Magn Reson Med, 1992. 25(1): p. 12-29.
6. Jain, V., M.C. Langham, and F.W. Wehrli, MRI estimation of global brain oxygen consumption rate. J Cereb Blood Flow Metab, 2010. 30(9): p. 1598-607.
7. Rodgers, Z.B., et al., High temporal resolution MRI quantification of global cerebral metabolic rate of oxygen consumption in response to apneic challenge. J Cereb Blood Flow Metab, 2013. 33(10): p. 1514-22.
8. Ong, F., et al. Berkeley advanced reconstruction toolbox. in International Society for Magnetic Resonance in Medicine. 2015.
9. Otsu, N., A threshold selection method from gray-level histograms. IEEE transactions on systems, man, and cybernetics, 1979. 9(1): p. 62-66.
Figures