3117
Multi-parametric imaging in muscle based on chemical shift encoded multi-echo variable flip angle sequence: initial experience at 5T system1Shenzhen Institute of Advanced Technology,Chinese Academy of Sciences, Shenzhen, China, 2Shanghai United Imaging Healthcare Co., LTD, Shanghai, China
Synopsis
Keywords: Data Processing, Relaxometry, Ultrahigh field MRI
Motivation: Water T1 (wT1) has been shown to be a sensitive biomarker for muscle disease in the 3T system.
Goal(s): The aim of this work was to investigate the feasibility of simultaneous wT1/PDFF/R2* imaging in the 5T system.
Approach: Simultaneous multi-parametric imaging was achieved using chemical shift encoded multi-echo variable flip angle (CSE-VFA) sequences combined with B1 measurement techniques.
Results: Corrected by the preTFL approach, homogeneous wT1 maps are obtained even under B1 varying from 0.37 to 1.12.
Impact: In this work we have tested the feasibility of simultaneous quantification of wT1/PDFF/R2* in the 5T imaging system. This work has laid the foundation for subsequent research into the clinical significance of extracellular volume fraction.
Introduction
Recent work has shown that water T1 (wT1) in the 3T MRI system is a sensitive biomarker for muscle disease[1]. In this work, we investigated the feasibility of simultaneous wT1/proton density fat fraction(PDFF)/R2* mapping at a higher 5T MRI system.Theory
In our previous work[2], simultaneous wT1/PDFF/R2* mapping in abdomen was achieved in 3T MRI system. This work tested the feasibility of simultaneous wT1/PDFF/R2* mapping in muscle at a 5T system. The fat signal is quantified with the combination of fat-water separation technique[3], and the PDFF and R2* are also calculated. The B1+ field inhomogeneity is corrected by the preconditioning RF pulse with short-TR GRE readout (preTFL) sequence [4]. The wT1 is derived from the following equation:$$\frac{S_w(n)}{sin(B_1\cdot \theta _n)} = \frac{S_w(n)}{tan(B_1\cdot \theta _n)}\cdot E_1+C$$
where the Sw(n) is the water signal under n-th flip angle, derived from the multi-echo images using water-fat separation method [2]; B1 is the B1+ inhomogeneity measured by the preTFL sequence;$$$E_1 = e^ {-TR/wT1}$$$ , which represents the longitudinal relaxation in repetition time; C is the constant to be estimated.
Materials and methods
All scans were performed at a 5.0T MRI system (uMR Jupiter 5T, Shanghai United Imaging Healthcare, Shanghai, China).Two healthy volunteers were recruited with informed consent under institutional review board approval in this study. The imaging parameters for the CSE-VFA sequence were: TE = 1.4/3.2/5/6.7/8.5/10.3 ms , flip angle =3°/20°, slice thickness = 4mm, repetition time =15ms, number of slices =24, FOV = 300*400mm2, resolution = 1.56*1.56 mm2. The parameters of the preTFL sequences were: echo time =1.8ms, repetition time =3.6ms, flip angle =40°, slice thickness = 10mm, FOV = 300*400mm2, resolution = 6.25*6.25 mm2. To enable the fully recovery of the preconditioned RF pulse, the interval between two readouts was set to 10s. The thighs were fastened to minimize the motion artifacts during the scans.
Fat-water separation was applied on the acquired multi-echo images to obtain the water-only signals using the TREE algorithm [2]. The water signals under different flip angles were further applied for the T1 calculation with the combination of B1+ correction. Proton density fat fractions (PDFF) and R2* were also calculated by the multi-echo GRE images under FA=3°.
Results
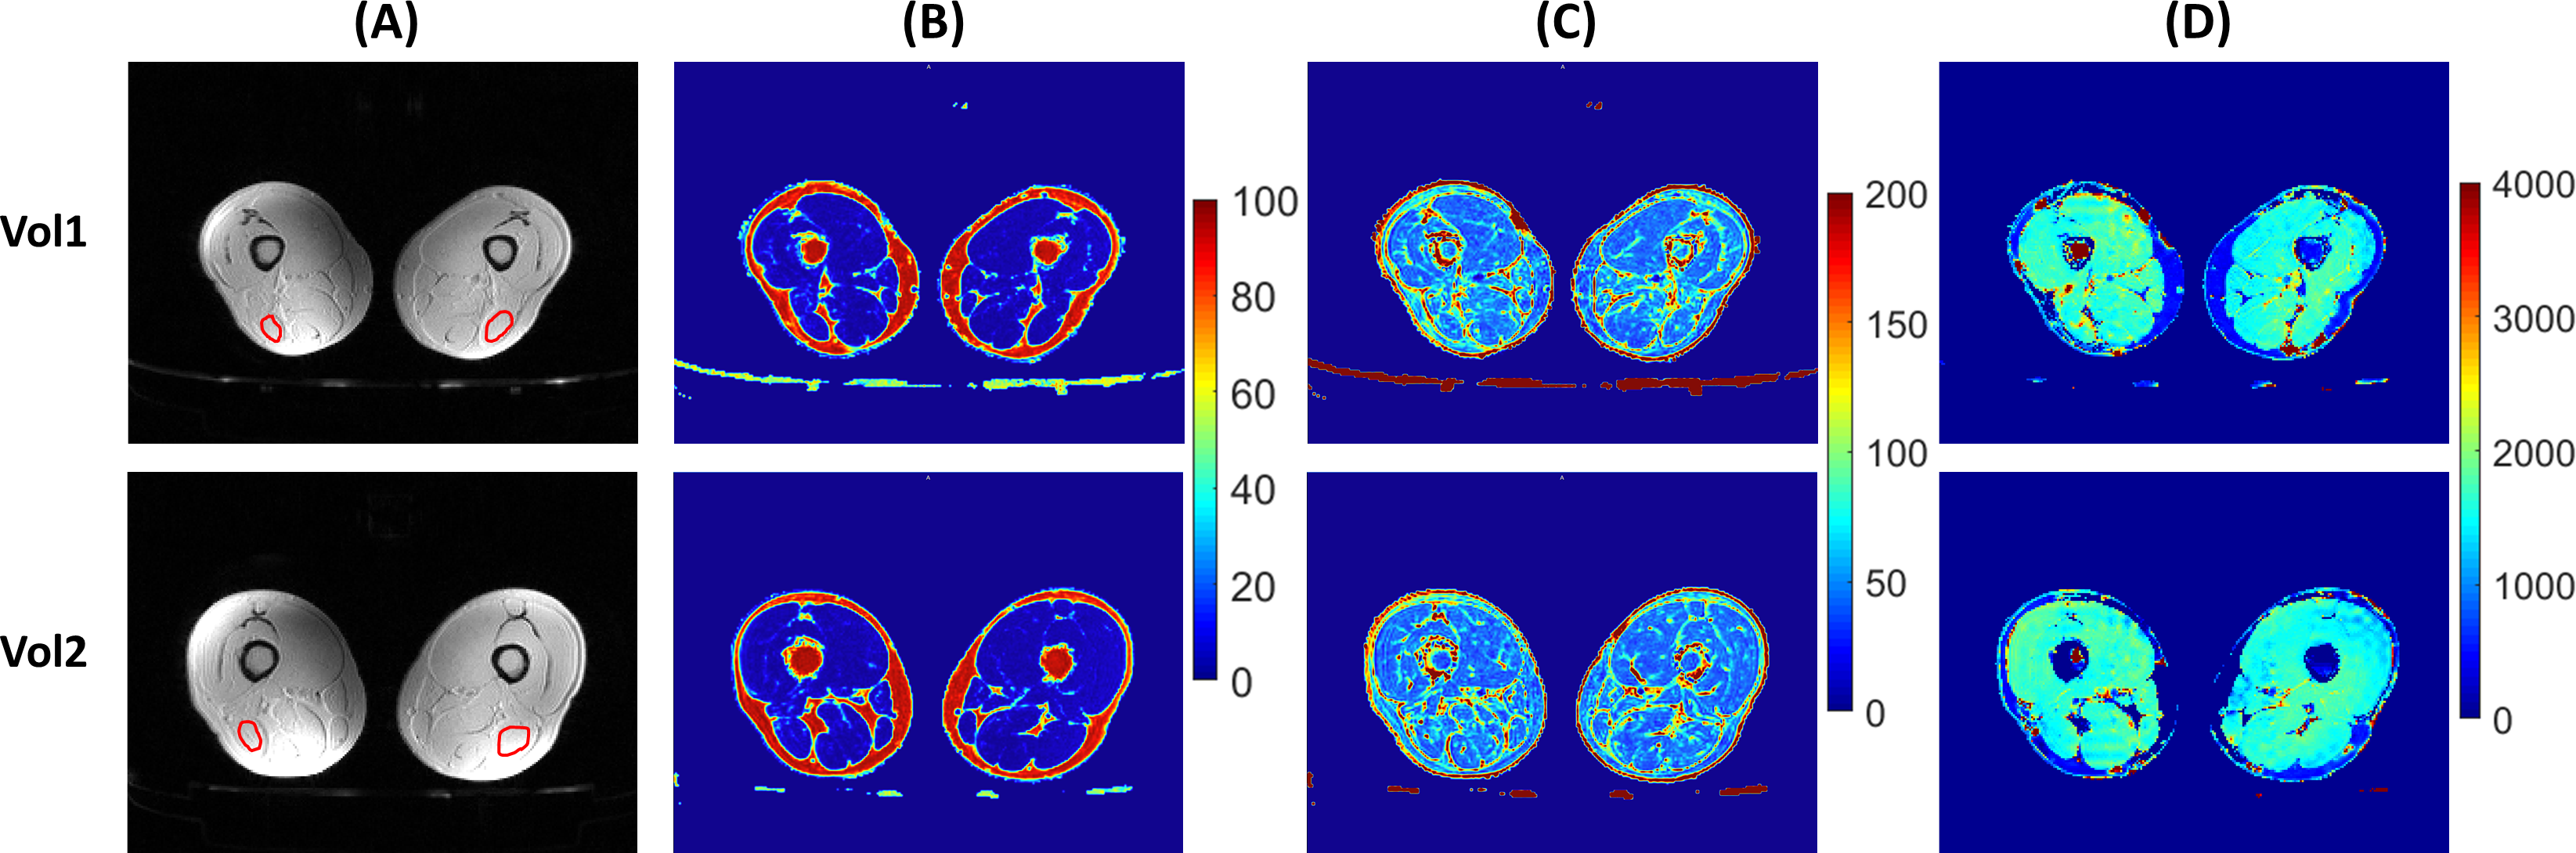
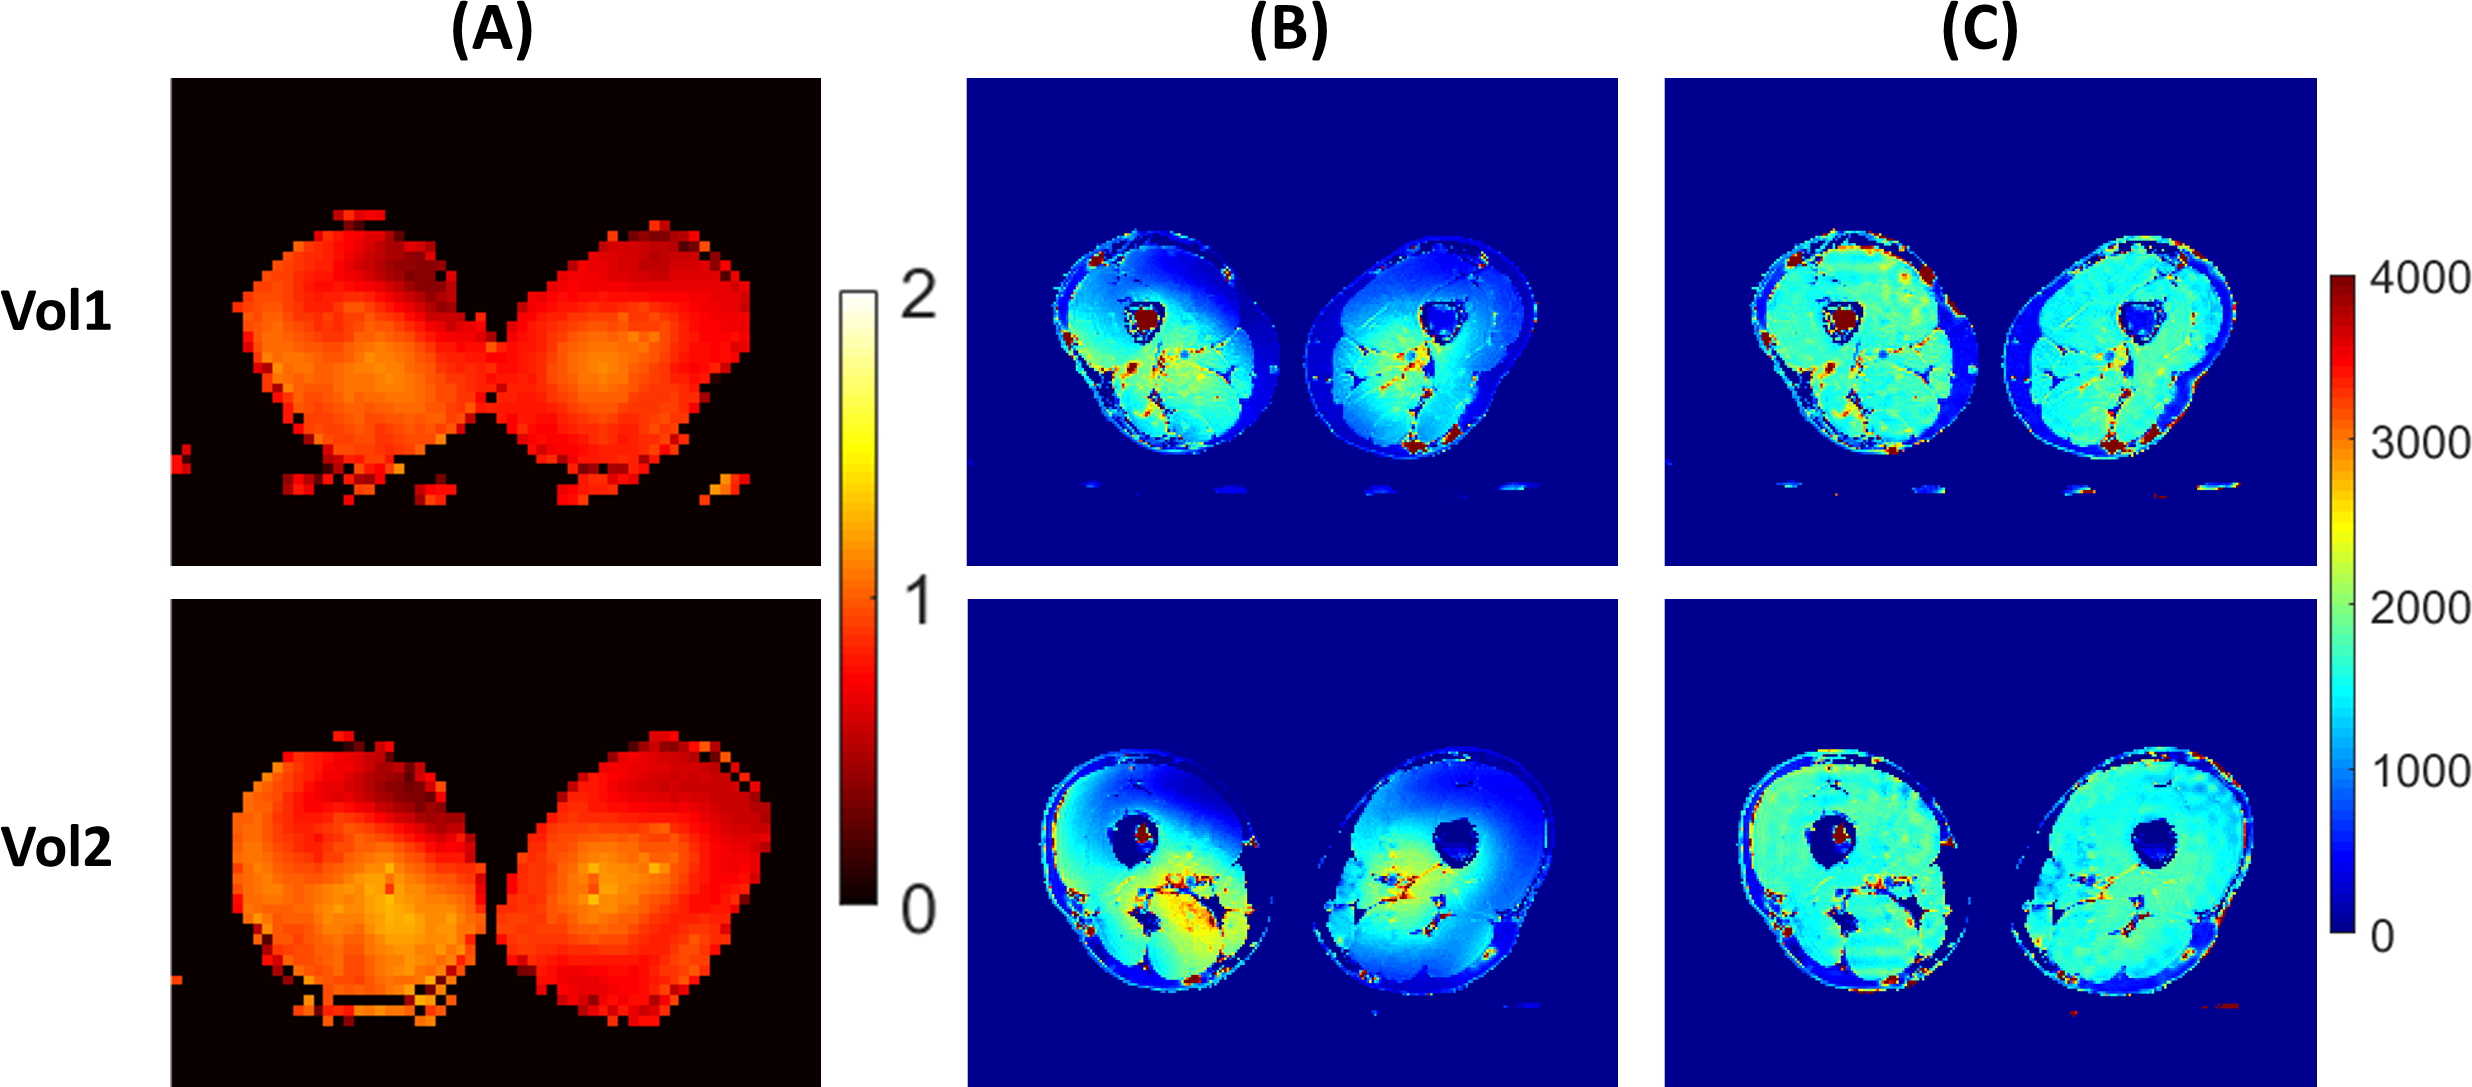
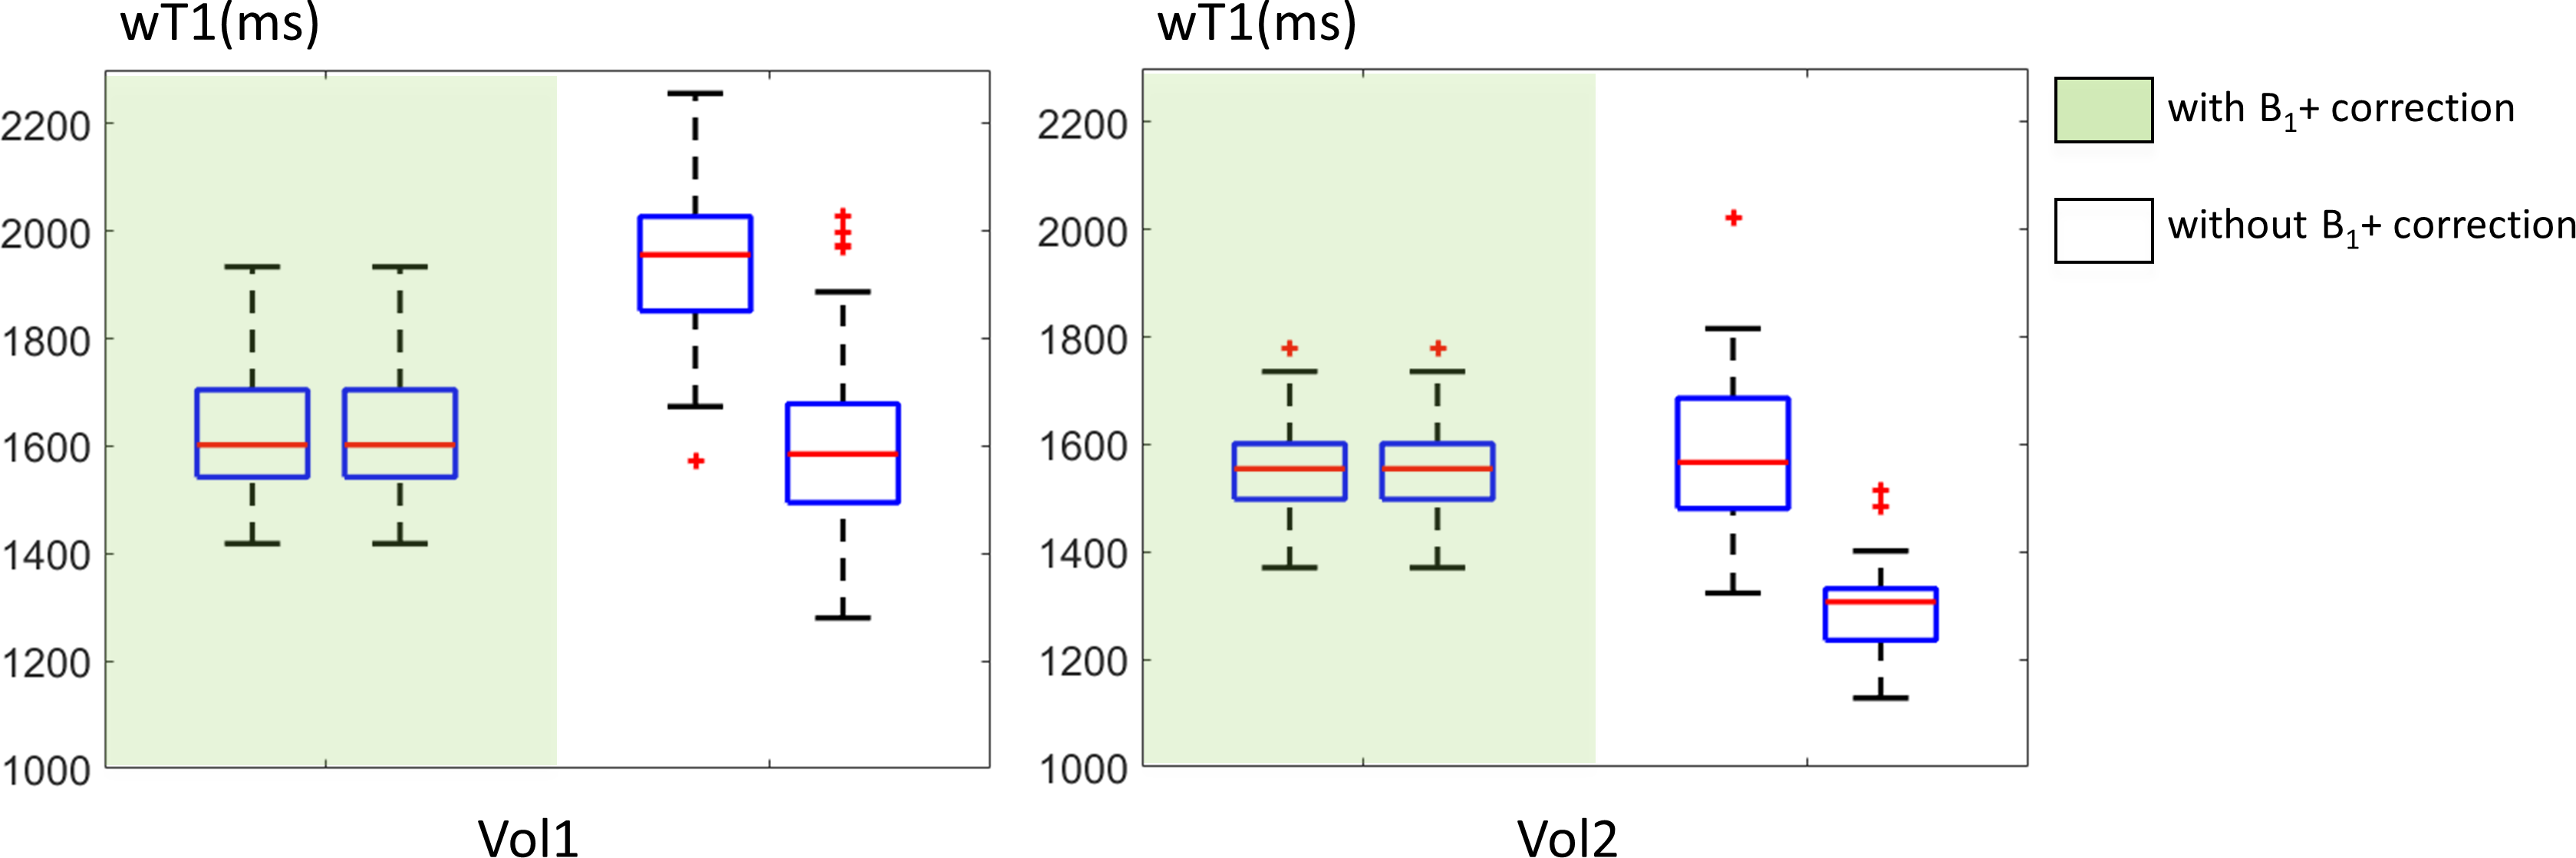
The magnitude of the first echo under flip angle 3°, PDFF, B1, R2* and wT1 maps are shown in Fig.1. The wT1 maps with and without B1 correction are shown in Fig.2, and the wT1 distribution with and without B1 correction are shown in Fig.3. For the first volunteer, the wT1 in the left and right thighs (marked with red ellipse) are 1686.4±121.8ms and 1623.3±161.1ms respectively. Without B1 correction, the wT1 values are 1943.0±156.4ms and 1597.5±152.7ms in the left and right thighs. PDFF of the left thigh is 6.9±5.0%, R2* is 62.1±41.3 s-1; the PDFF of the right thigh is 4.6±2.0%, R2* is 54.0±18.2 s-1.For the second volunteer, wT1 are 1556.0±82.7ms and 1644.2±86.4ms in the left and right thighs respectively (also marked with red ellipse). Without B1 correction, the wT1 are 1580.1±146.9ms and 1287.5±76.2ms, showed significant discrepancy in the left and right thighs. PDFF of the left thigh is 6.4±4.2%, R2* is 47.5±21.5 s-1; for the right thigh, PDFF is 4.8±2.1%, R2* is 53.8±18.1 s-1.
Discussion and conclusions
In this work, we have tested the feasibility of simultaneous quantification of wT1/PDFF/R2* in muscle at the 5T MRI system. Compared with 3T, the B1 inhomogeneity is more prominent in the 5T system, which may become a challenge for B1+ correction. By using the B1+ measurement method based on preTFL sequence, homogeneous wT1 maps are obtained, indicating the excellent performance of the proposed method even under the B1 varying from 0.37 to 1.12.The wT1 of the muscle was reported to be around 1200 ms in the 3T system according to the previous work [1]. In this work, the wT1 was estimated to be around 1600 ms in the 5T system. Although it has not been validated by the other techniques, the longer wT1 measured by the 5T system is considered to be in the plausible range. Further comparisons with other T1 quantification methods such as MRS are ongoing. In addition, the optimization of the imaging parameters of both the preTFL sequence and the CSE-VFA sequence will be explored.
Acknowledgements
No acknowledgement found.References
[1] Marty B, Baudin P-Y, Caldas de Almeida Araujo E, Fromes Y, Wahbi K, and Reyngoudt H. Assessment of Extracellular Volume Fraction in Becker Muscular Dystrophy by Using MR Fingerprinting. Radiology. 2023;307:e221115.
[2] Peng H, Cheng C, Wan Q, et al. Fast multi-parametric imaging in abdomen by B1+ corrected dual-flip angle sequence with interleaved echo acquisition. Magn Reson Med. 2022;87:2194-2208.
[3] Peng H, Zou C, Cheng C, et al. Fat-water separation based on Transition REgion Extraction (TREE). Magn Reson Med. 2019;82:436-448.
[4] Chung S, Kim D, Breton E, and Axel L. Rapid B1+ mapping using a preconditioning RF pulse with TurboFLASH readout. Magnetic resonance in medicine. 2010;64:439-446.
Figures