3116
Benchmarking a clinical analysis software tool for SAGE based DSC MRI1Barrow Neurological Institute, Phoenix, AZ, United States, 2The University of Texas MD Anderson Cancer Center, Houston, TX, United States, 3Jensen Informatics, LLC, Milwaukee, WI, United States, 4Imaging Biometrics, LLC, Milwaukee, WI, United States
Synopsis
Keywords: Software Tools, Data Processing, analysis tools
Motivation: To benchmark multi-echo based DSC-MRI SAGE sequence, a compelling alternative to single echo acquisition analysis tool that is targeted for clinical translation.
Goal(s): Comparison of rCBV values derived from the two software (IB Neuro X2, in-house algorithm).
Approach: We expanded a single-echo DSC-MRI brain tumor digital reference object (DRO) into an anthropomorphic phantom that recapitulates clinical DSC-MRI data structure and anatomy.
Results: The rCBV values obtained from both softwares are strongly correlated.
Impact: This study would potentially deliver a robust and reproducible post-processing tool for multi-site, multi-vendor SAGE-based DSC-MRI that can be used for clinical trials.
Summary
Multi-echo based DSC-MRI, spin and gradient echo (SAGE) sequence, in particular, could be a compelling alternative to a single-echo acquisition in terms of improved accuracy of the derived hemodynamic parameters, identification of the arterial input function, and mitigation of leakage effects due to a disrupted blood brain barrier. In this study, we partnered with Imaging Biometrics to develop and benchmark a SAGE perfusion analysis tool that is targeted for clinical translation. We present the comparison of rCBV values derived from the two software (IB Neuro X2, in-house algorithm).Introduction
With robust acquisition and optimized analysis techniques, multi-echo spin and gradient echo (SAGE) based DSC-MRI could become a valuable tool for brain tumor patient management, substantially improving the characterization of tumor status and therapy response assessment 1,2. To aid in clinical translation, we recently validated a harmonized, multi-vendor SAGE protocol, as part of a NIH quantitative imaging network (QIN) project 8 . In this study, we partnered with Imaging Biometrics, LLC (IB) (Elm Grove, WI, United States), a company with well-established and validated DSC-MRI perfusion analysis software in clinical use, to develop and benchmark a SAGE perfusion analysis tool. The long-term goal is to deliver a robust and reproducible post-processing tool for multi-site, multi-vendor SAGE-based DSC-MRI that can be used for clinical trials.Methods
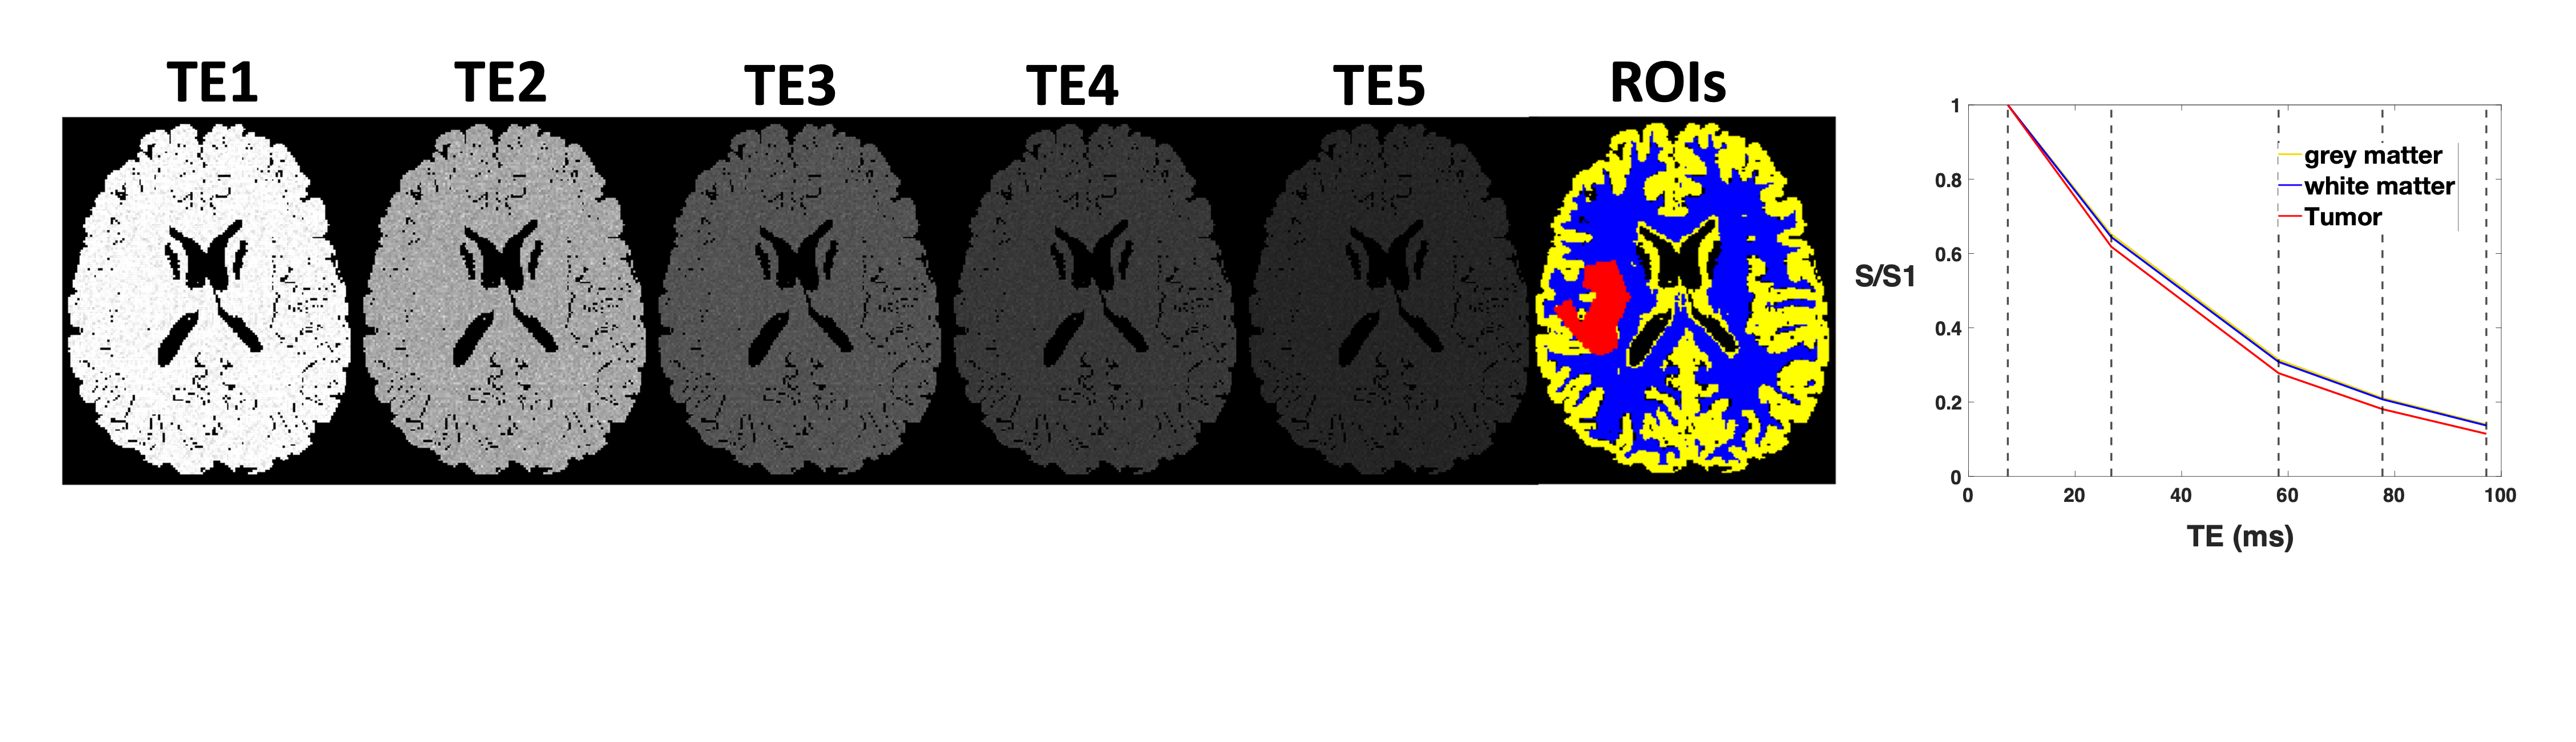
To establish the SAGE-based DSC-MRI benchmark, we first expanded a single-echo DSC-MRI brain tumor digital reference object (DRO) 3,4 into an anthropomorphic phantom that recapitulates clinical DSC-MRI data structure and anatomy (Figure 1). The SAGE DRO encompasses around 12,000 unique brain voxels that include tumor tissue with a disrupted blood brain barrier (BBB), as well as grey matter (GM) and white matter (WM) with an intact BBB. Simulated SAGE data were obtained for two gradient-echoes (GRE), two asymmetric spin-echoes, and one spin-echo (SE) corresponding to TEs = 7.37, 26.8, 57.7, 77.7, 97.2 milliseconds, with TR = 1.5 seconds, slice thickness = 5.5 mm; FA = 90°, and matrix size = 172 x 138 x 18. Post-processing was performed with established in-house (Matlab) software tools2 and algorithms 2,5,6 developed by Imaging Biometrics (IB), LLC. Data were corrected for contrast agent leakage effects using the Boxerman–Schmainda–Weisskoff (BSW) 7 method prior to computing rCBV maps. The single- and dual-echo DSC-MRI analysis tools developed by IB are available as plugins for OsiriX MD (Pixmeo SARL, Bernex, Switzerland), and termed IB Neuro and IB Neuro X2, respectively. This plugin was modified to read in multi-vendor SAGE DICOM images and compute GRE and SE hemodynamic parameters. Concordance correlation coefficients (CCC) and values were computed to compare SAGE-based GRE and SE rCBV maps derived from in-house algorithms and IB Neuro X2.Results/Discussion
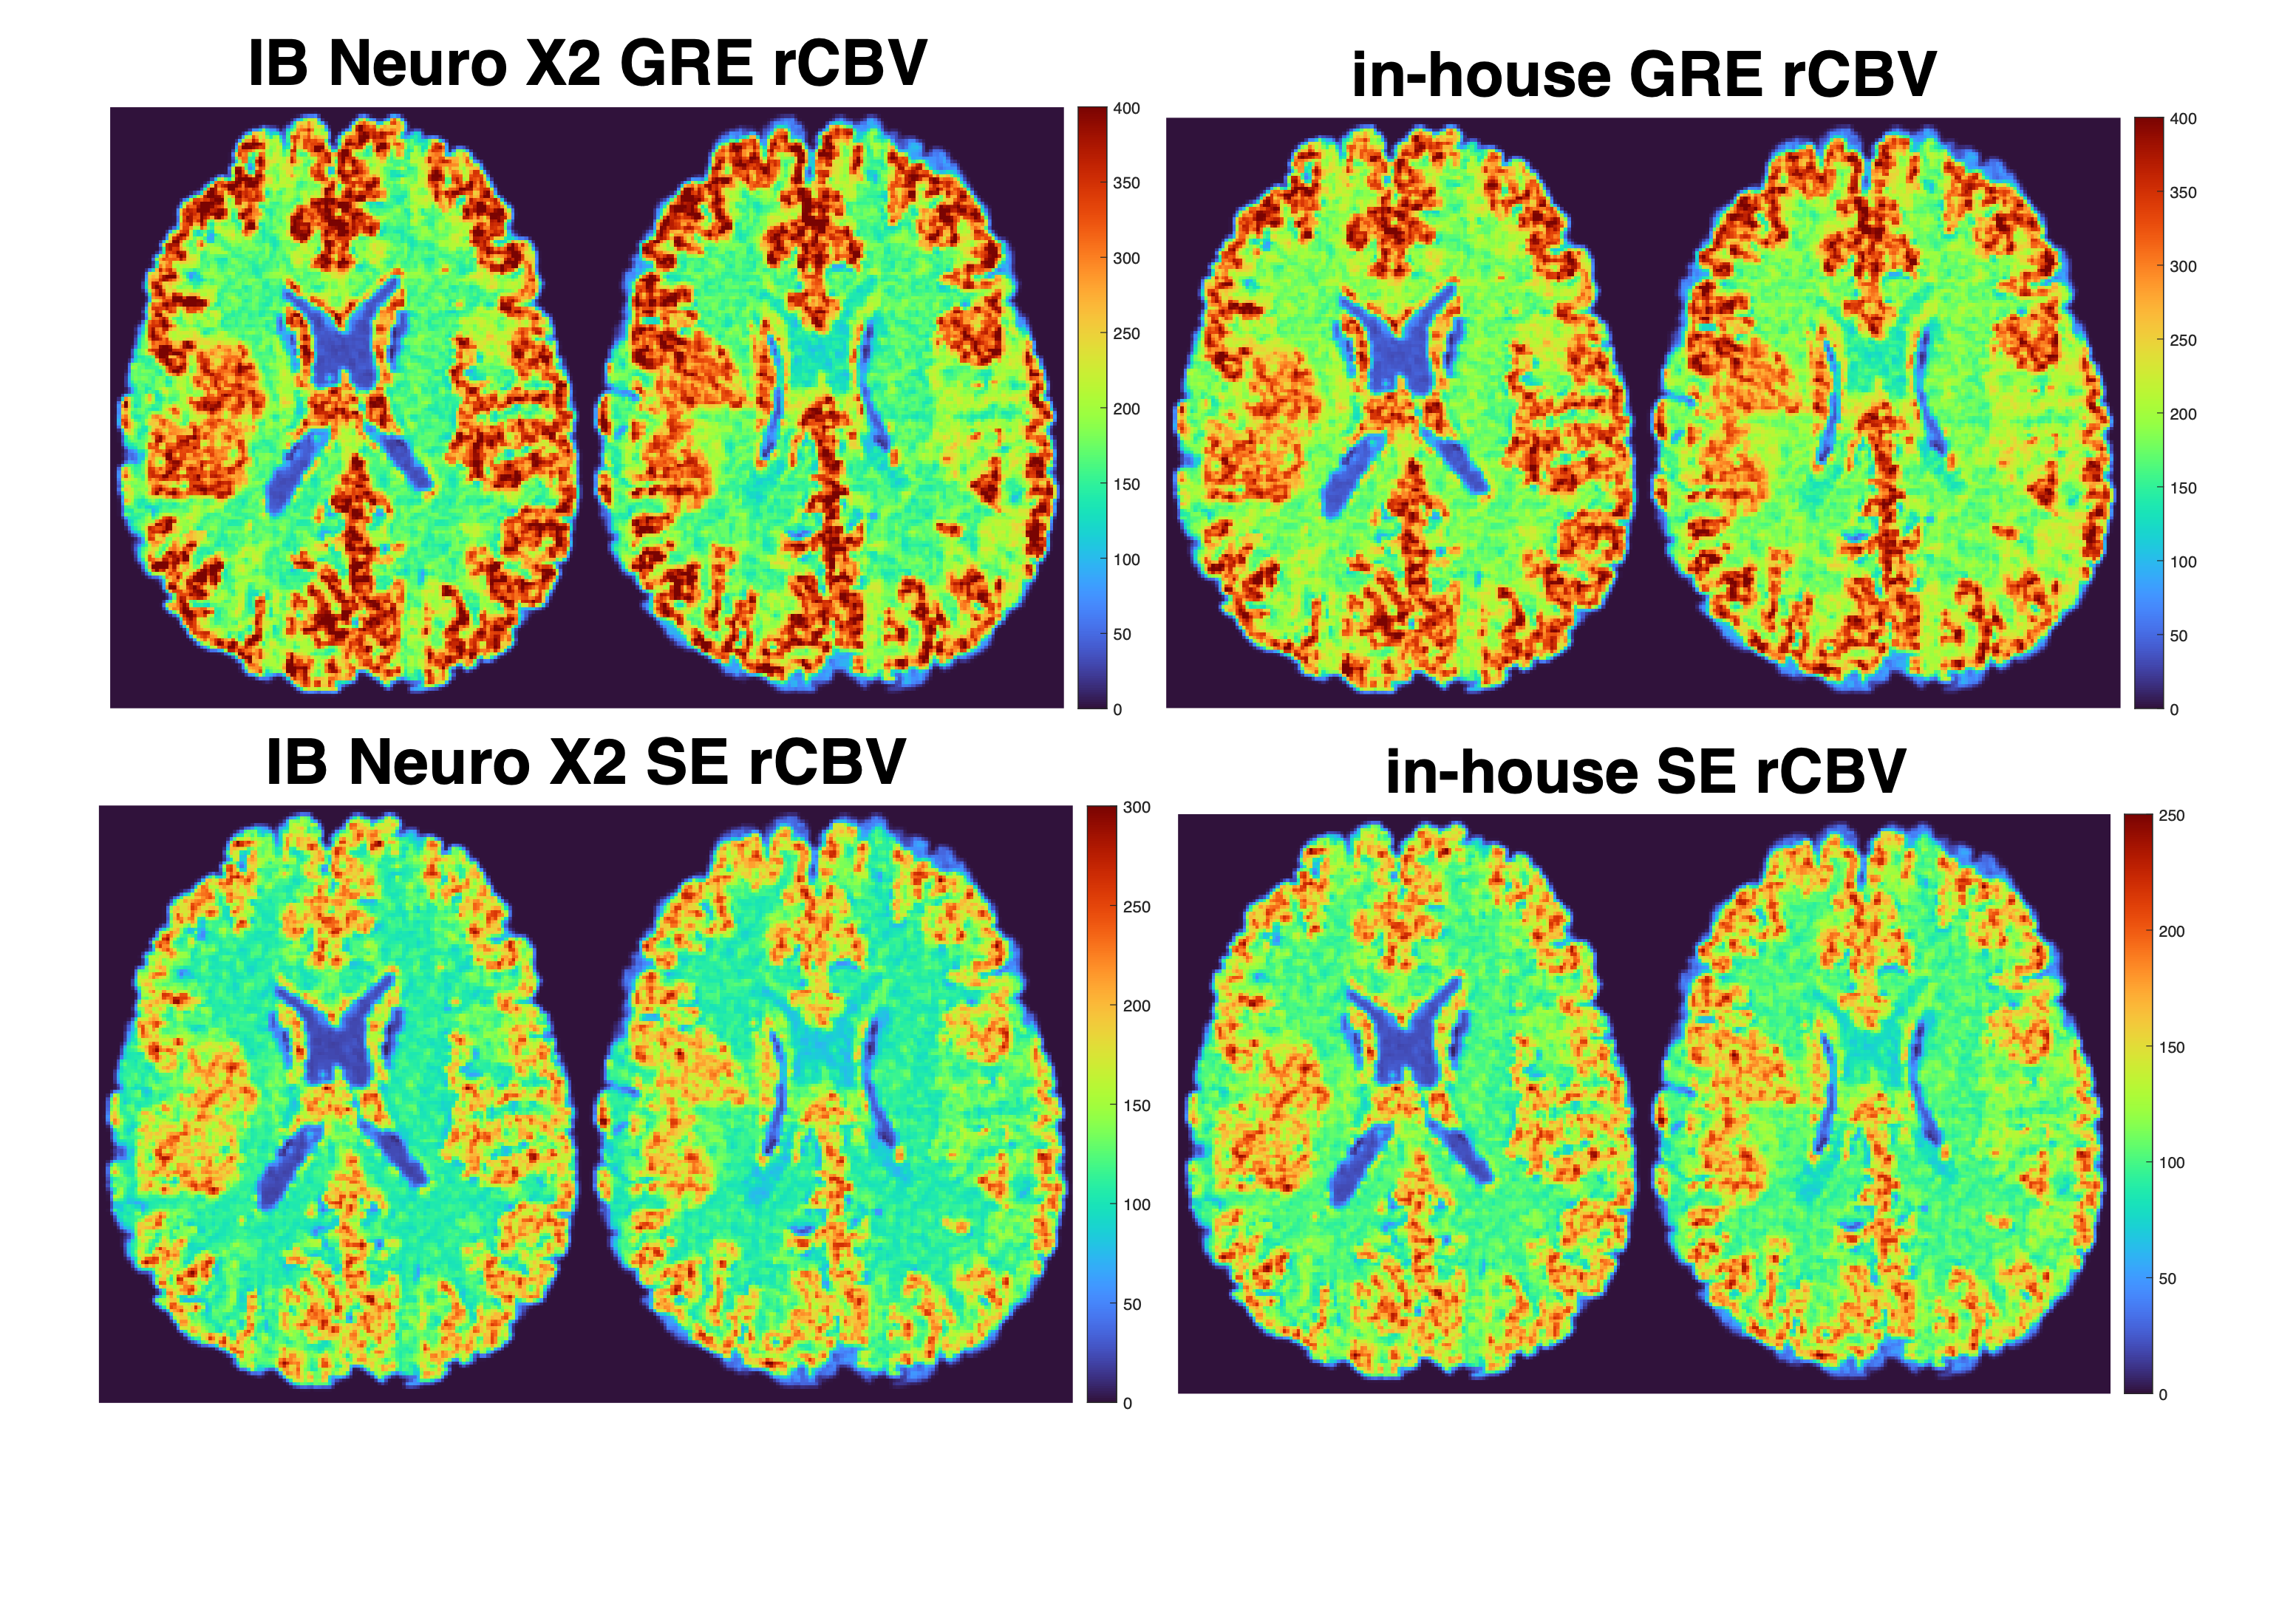
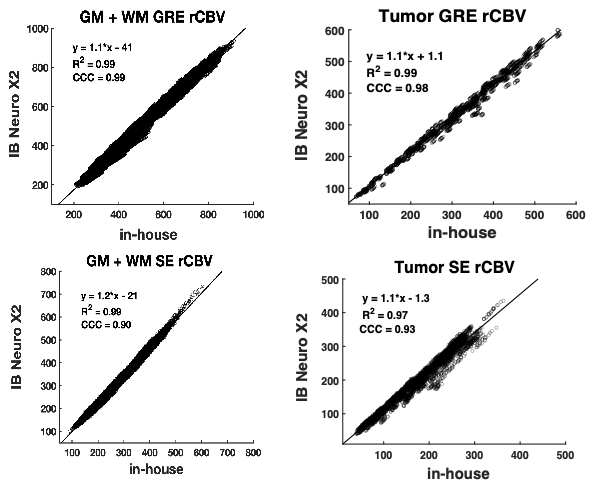
Figure 2 shows the visual similarity between GRE and SE rCBV maps derived from the IB Neuro X2 plugin and in-house algorithms. The contrast in GRE (total vasculature) and SE (microvasculature) derived rCBV maps is also similar between the two software. In Figure 3, the CCC values for grey matter (GM), white matter (WM) and tumor voxels show excellent agreement for GRE (top) and SE (bottom) based rCBV values (GM+WM GRE rCBV CCC = 0.99; tumor GRE rCBV CCC = 0.98; GM+WM SE rCBV CCC = 0.99; tumor SE rCBV CCC = 0.93). The differences in post-processing steps such as masking, baseline calculation difference could be the reason behind the not perfect correlation, which needs to be investigated in future.Conclusion
To support the standardization and reproducibility of multi-site and multi-vendor SAGE based DSC-MRI, we developed an anthropomorphic phantom that can be used to benchmark SAGE analysis tools. In this project, the anthropomorphic phantom data were applied to validate rCBV maps using a commercially-available toolbox from Imaging Biometrics. Going forward, the anthropomorphic phantom will be extended to characterize numerous pre-processing (e.g. filtering and smoothing) and post-processing steps that could affect parameter accuracy. We will also expand the analysis tools to assess other advanced perfusion parameters (e.g., vascular architecture) and BBB permeability parameters using DCE-MRI. Once established, the SAGE DRO will be made publicly available.Acknowledgements
This work was supported by the National Institutes of Health award number NIH/NCI 1UG3CA247606-01.References
1. Schmiedeskamp, H. et al. Combined spin‐and gradient‐echo perfusion‐weighted imaging. Magnetic resonance in medicine 68, 30–40 (2012).
2. Stokes, A. M., Skinner, J. T., Yankeelov, T. & Quarles, C. C. Assessment of a simplified spin and gradient echo (sSAGE) approach for human brain tumor perfusion imaging. Magn Reson Imaging 34, 1248–1255 (2016).
3. Semmineh, N. B. et al. An efficient computational approach to characterize DSC-MRI signals arising from three-dimensional heterogeneous tissue structures. PloS one 9, e84764 (2014).
4. Semmineh, N. B., Stokes, A. M., Bell, L. C., Boxerman, J. L. & Quarles, C. C. A population-based digital reference object (DRO) for optimizing dynamic susceptibility contrast (DSC)-MRI methods for clinical trials. Tomography 3, 41–49 (2017).
5. Stokes, A. M. & Quarles, C. C. A simplified spin and gradient echo approach for brain tumor perfusion imaging. Magn Reson Med 75, 356–362 (2016).
6. Skinner, J. T. et al. Evaluation of a multiple spin- and gradient-echo (SAGE) EPI acquisition with SENSE acceleration: applications for perfusion imaging in and outside the brain. Magn Reson Imaging 32, 1171–1180 (2014).
7. Boxerman, J. L., Schmainda, K. M. & Weisskoff, R. M. Relative cerebral blood volume maps corrected for contrast agent extravasation significantly correlate with glioma tumor grade, whereas uncorrected maps do not. AJNR Am J Neuroradiol 27, 859–867 (2006).
8. Poonam Choudhary, YuXiang Zhou, Sudarshan Ragunathan, Ethan Mathew, Aliya Anil, Natenael Semmineh, Belinda Gutierrez, John P Karis, Leland S. Hu, Kathleen M. Schmainda, Ashley M. Stokes, and C. Chad Quarles. Repeatability and reproducibility of a multi-vendor spin and gradient echo (SAGE) pulse sequence for dynamic susceptibility contrast MRI. ISMRM 2023.
Figures