3115
Robust, Semi-Automatic Detection of Vascular Input Function in Brain DCE-MRI1RaySearch Laboratories AB, Stockholm, Sweden, 2Radiation Oncology, The University of Texas M.D. Anderson Cancer Center, Houston, TX, United States
Synopsis
Keywords: Software Tools, Perfusion, Segmentation, DCE-MRI Perfusion, Analysis/Processing
Motivation: In order to extract quantitative measures from perfusion imaging, pharmacokinetic models such as the (extended) Tofts are utilized. These models require contrast agent concentration in plasma to be estimated in a robust way for model fitting.
Goal(s): Develop a method to measure the vascular input function in DCE-MRI brain scans based on superior sagittal sinus (SSS) values which is semi-automatic and robust to user input.
Approach: Given a user selected seed point inside the SSS, image segmentation in combination with voxel-wise intensity analysis is used.
Results: The method was shown to be robust towards user input in a small patient cohort.
Impact: The presented method has the potential to improve the robustness of perfusion parameters, such as Ktrans, ve, and vp, making their usage as quantitative imaging biomarkers more feasible through a more consistent vascular input function definition.
Introduction
It has been shown that perfusion characteristics differ in tumorous and healthy tissues1. Therefore, it has been suggested to evaluate tumor progression and characteristics based on deviations in perfusion parameters2. The analysis of perfusion after treatment can also reveal if all parts of the tumor were removed or affected, or if residual cancerous cells are still present. It is possible to obtain quantitative measures of perfusion parameters by fitting a pharmacokinetic model such as (extended) Tofts to DCE-MRI data3. To fully utilize the potential of perfusion measures such as Ktrans, ve, and vp as quantitative biomarkers, all model inputs need to be robustly estimated4. In this study, we propose such a method for contrast agent (CA) concentration estimation for the vascular input function (VIF) and integrate the method in a research version of a radiotherapy treatment planning system.Method
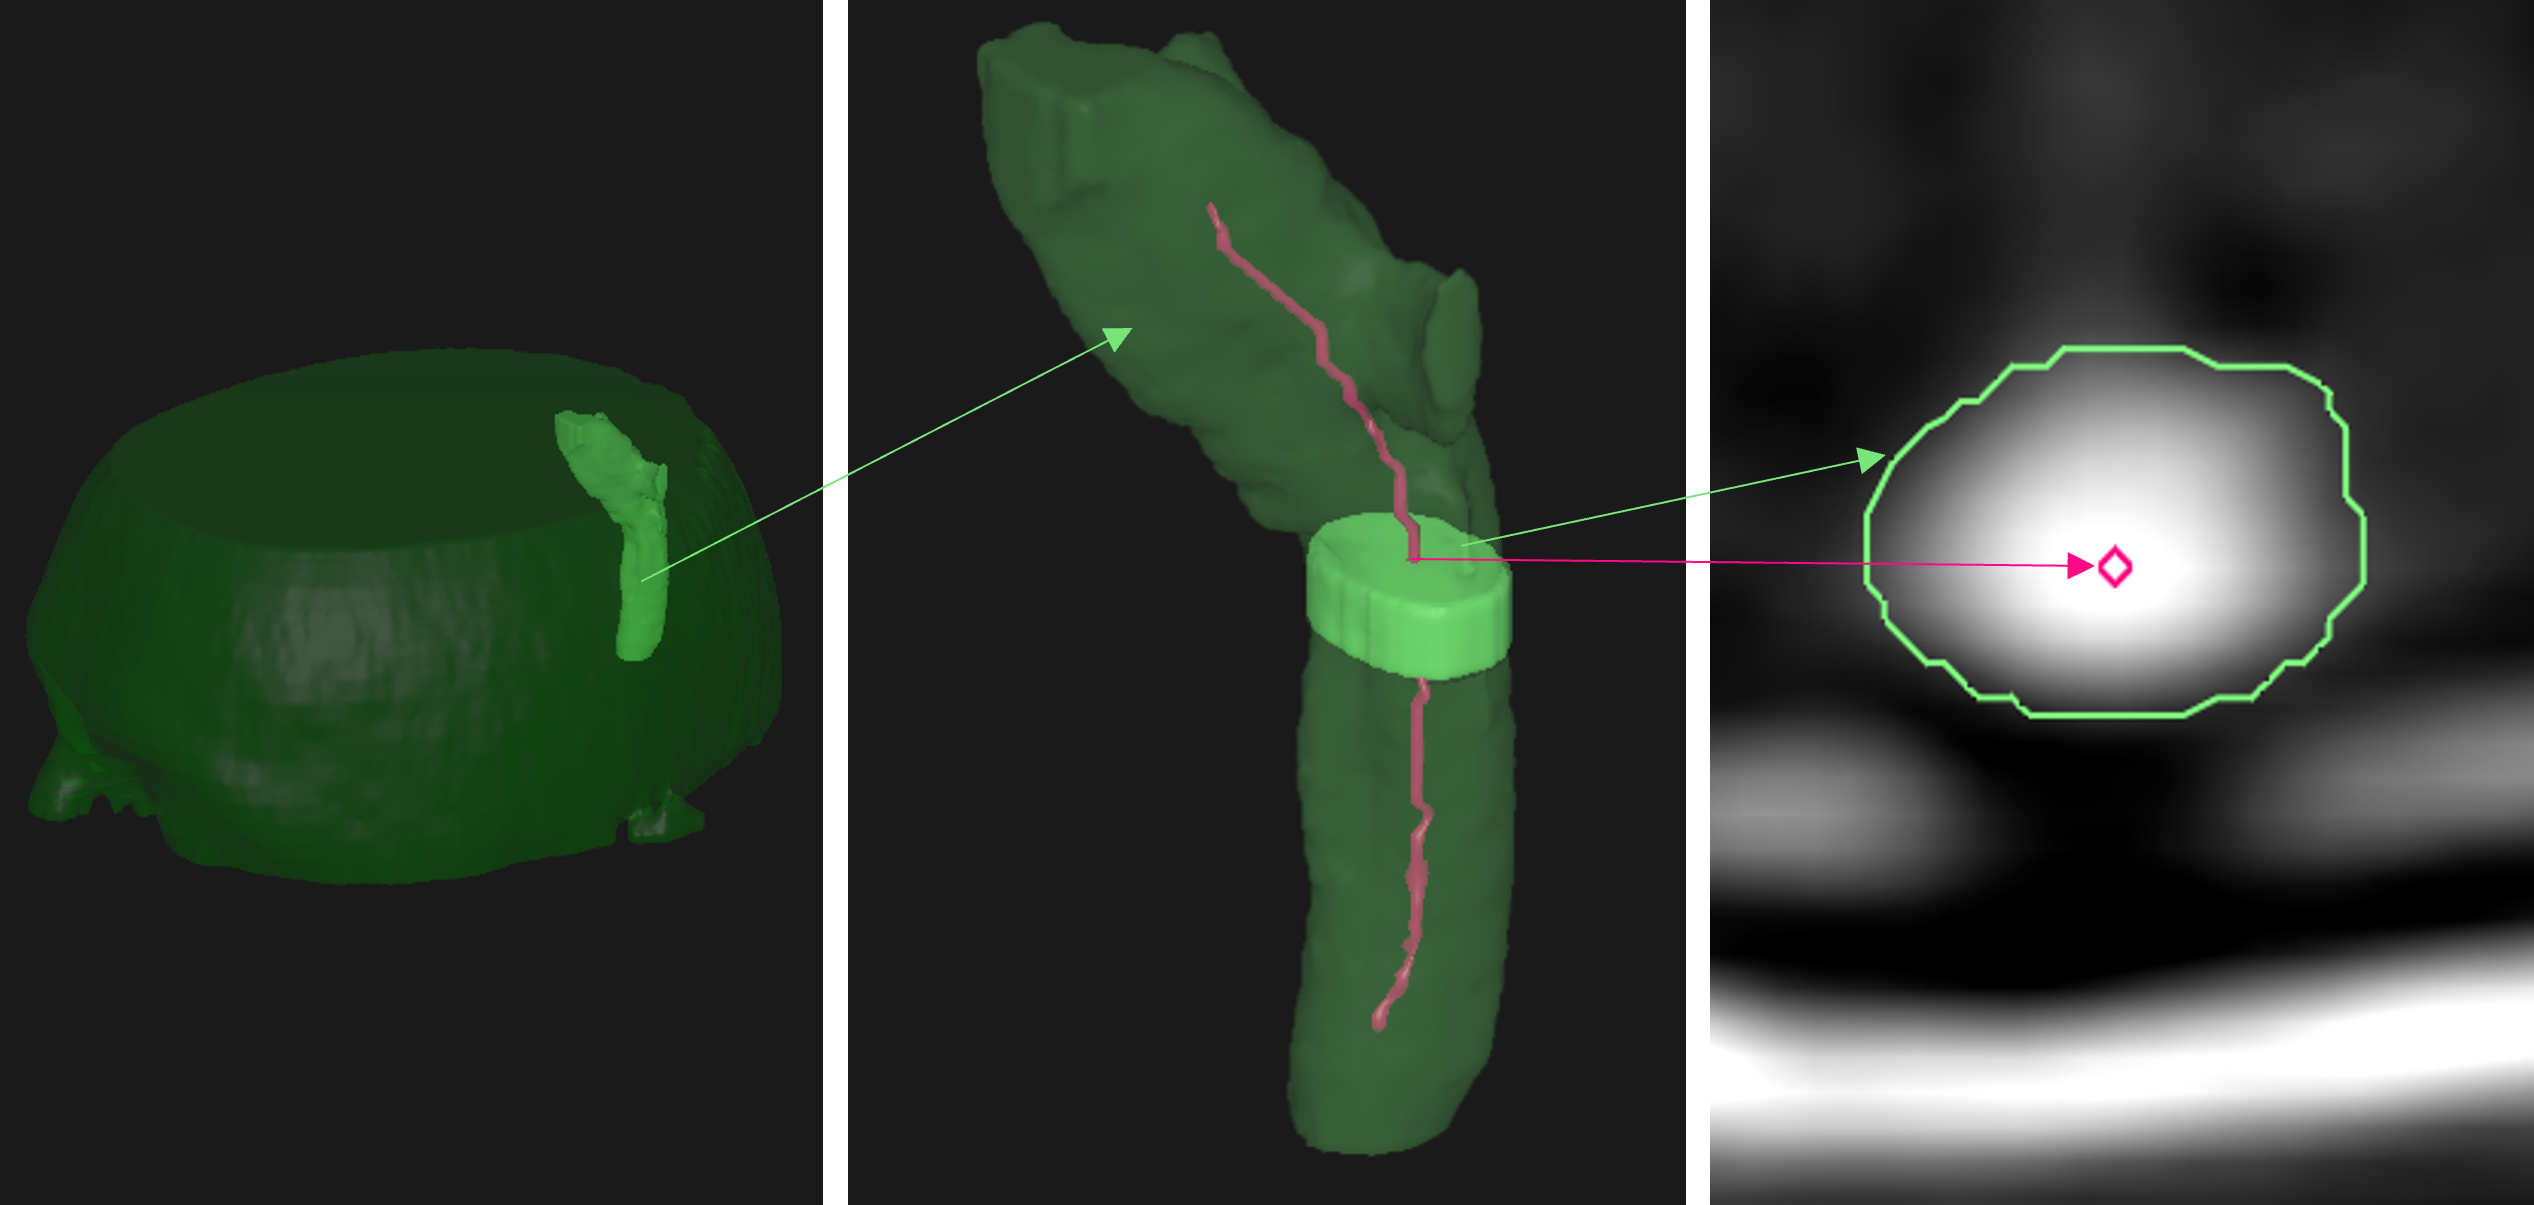
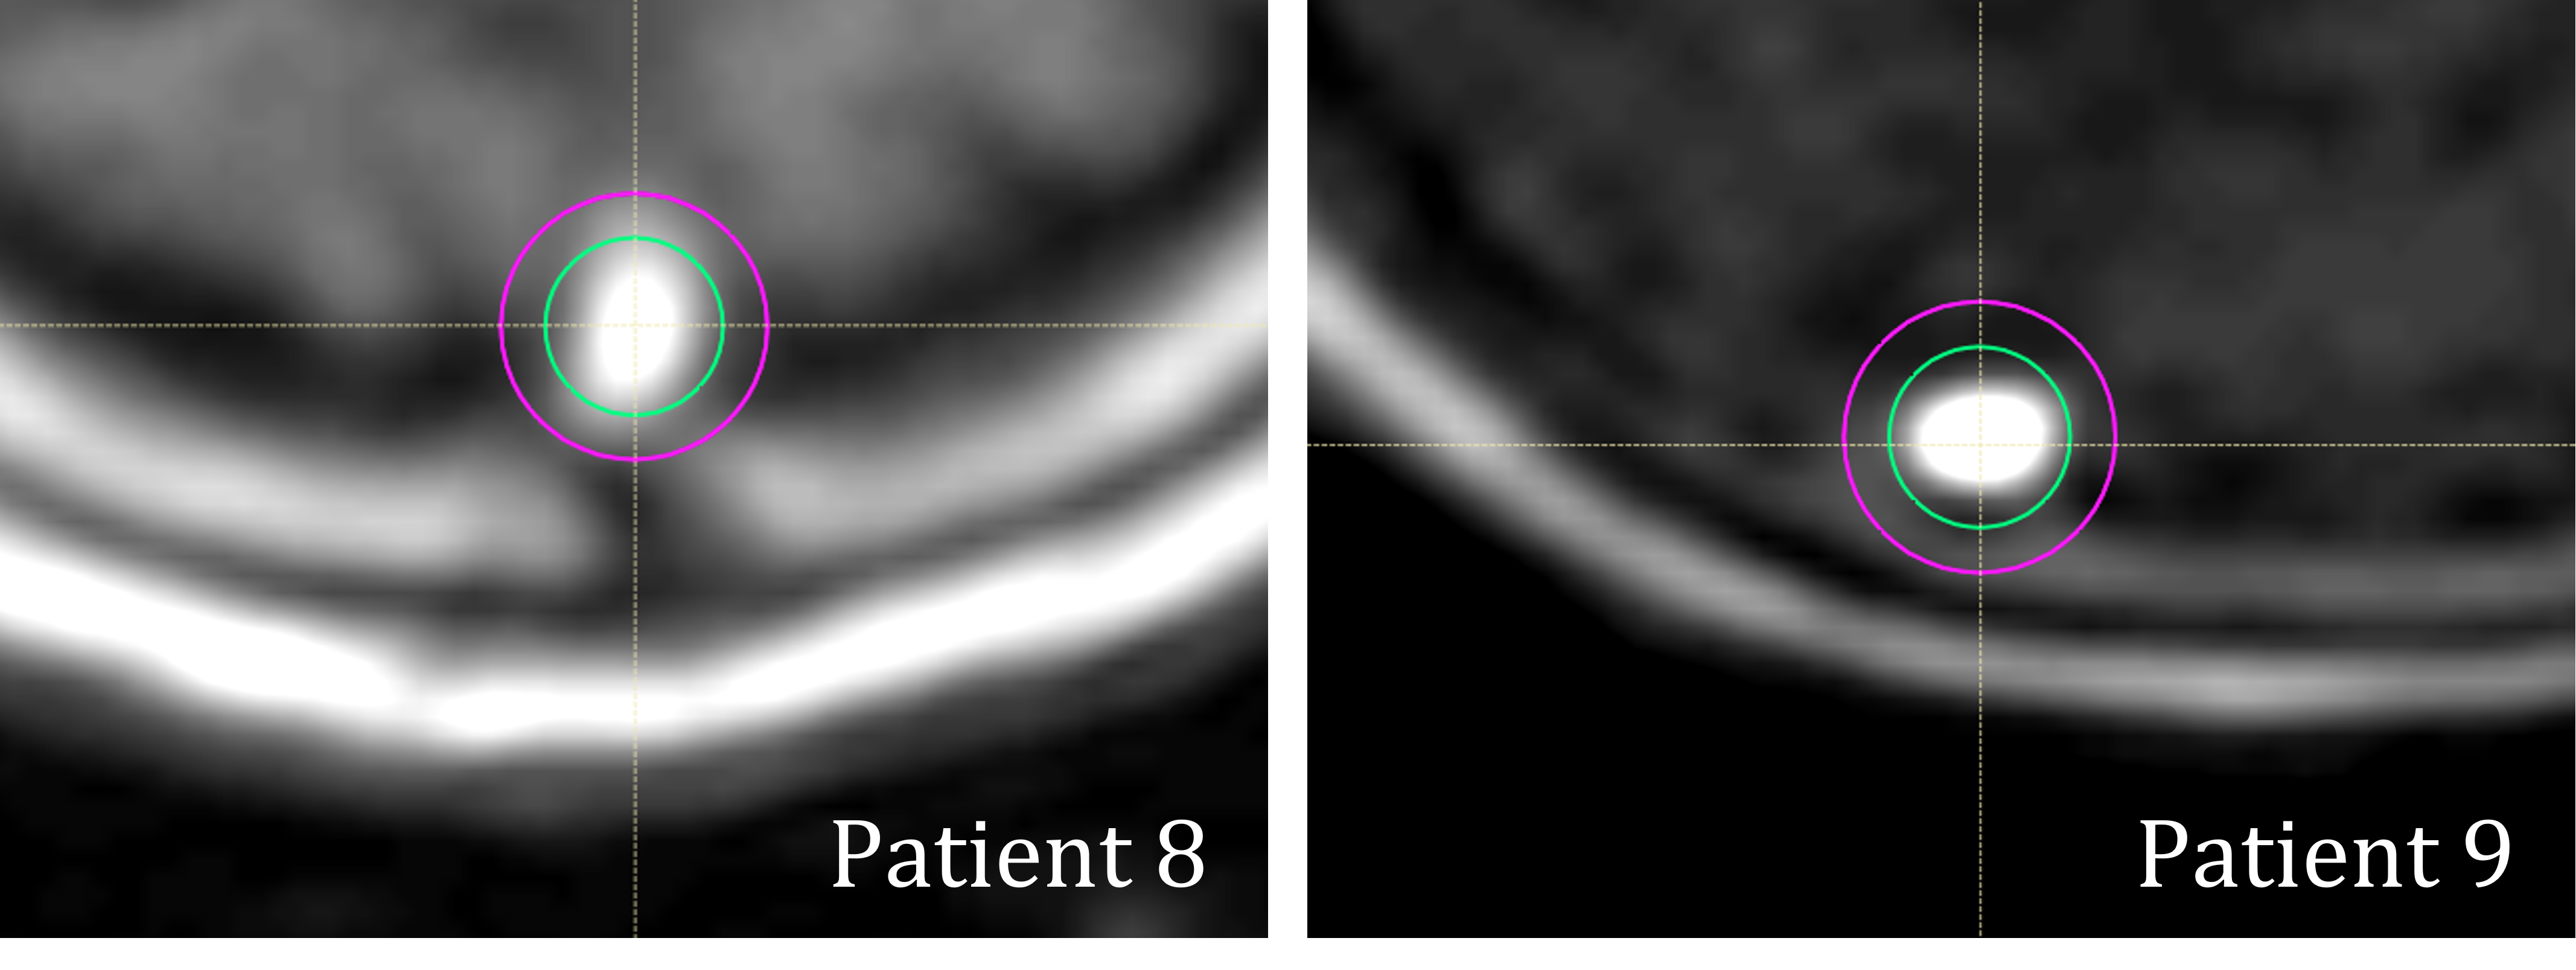
Given a user-selected seed point placed inside the superior sagittal sinus (SSS) in one of the DCE-MRI volumes, all volumes are automatically searched and the one with the highest intensity value is selected for segmentation. The SSS is automatically segmented in this volume using region growing, bounded by lower and higher intensity thresholds. The top and bottom slices are excluded from the region growing. CA curves for all voxels inside the segmentation are generated and the one with the highest peak is selected as the VIF. See Figure 1, for a segmented SSS. As the VIF acquisition depends on values from a single voxel, the method would be sensitive to noise if applied directly to the data. To lower the impact of noise, the DCE-MRI data is filtered, slice-wise, using a 2D Gaussian with σx = σy = 1mm.The robustness of the method was validated with respect to user input by simulating a large set of seed point placements, both within the same slice, as illustrated in Figure 2, and in different slices along the SSS, as illustrated in Figure 1.
The robustness analysis was performed using a cohort of nine patients. The patient data was supplied by the University of Texas M.D. Anderson Cancer Center. All data was collected with prior informed consent of the patient under institutional review board protocol (PA 17-0844). All DCE-MRI images were acquired on the same 1.5T scanner (spatial resolution: 0.1×0.1×0.5cm3, temporal resolution: around 6s, 60 time frames, TR = 7.8ms, TE = 1.36ms, FA = 25°, bolus agent Gd-DO3A-butrol).
Results
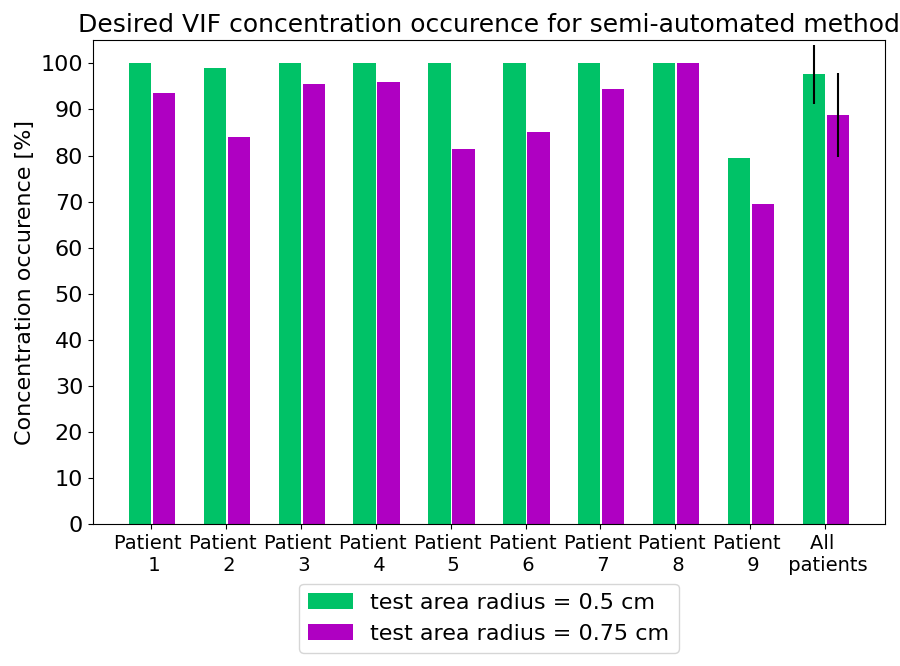
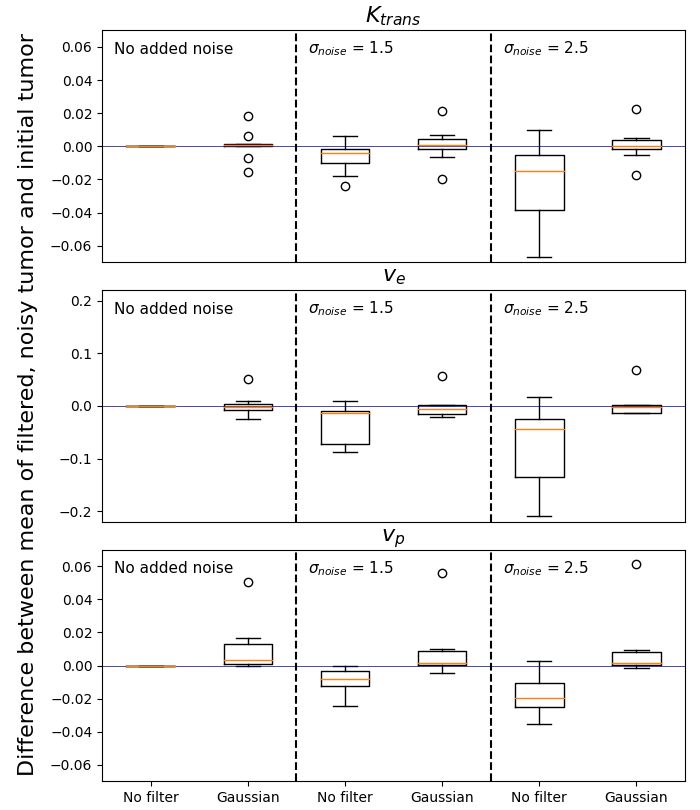
Simulations of seed point placements within a slice were conducted. Figure 2 illustrates the two circular areas (centered around the SSS with radii of 0.5cm and 0.75cm respectively), inside which 200 random test points were placed. Figure 3 shows the occurrence of desired VIF concentrations. The smaller area (containing points that would more plausibly be selected manually) resulted in finding a desired VIF almost 100% of the time. The slice-based test showed that the method was robust when selecting a point inside the SSS in a central slice.As previously mentioned, without preprocessing, the VIF acquisition is sensitive to noise. This is remedied by applying a Gaussian filter. The effect of the filter is illustrated by the box-and-whisker plot in Fig. 4, where the impact on Ktrans, ve, and vp is shown, with and without filtering, for different noise levels. The same noise model was used as for the digital reference object QIBA_T1_v03 referenced in the Radiological Society of North America’s Quantitative Imaging Biomarkers Alliance/(QIBA®) profile for DCE-MRI Quantification5. The effect of noise is shown by the difference between the mean parameter value before and after noise addition. The deviation from the mean increases as the noise increases. The proposed filter reduces this deviation and brings the difference back close to 0.
Discussion
While our initial robustness analysis was performed on a small cohort of patients, results are promising. Next steps are to extend the study to a large cohort, with images acquired across different scanners, and field strengths. The intensity thresholds for the region-growing based segmentation were somewhat tailored to the cohort. Going forward, we aim to automate this threshold detection.The proposed semi-automated VIF method requires preprocessed DCE-MRI images. In this study, we used a simple 2D Gaussian filter, but plan to perform a thorough investigation of the impact of different filtering methods.
Additionally, while the seed point selection is currently manual, we plan to automate this choice, to fully automate the VIF definition for quantitative, model-based DCE-MRI.
Conclusion
A semi-automatic method for detecting the vascular input function for brain DCE-MRI was introduced showing promising results with respect to robustness towards user input and noise.Acknowledgements
The authors thank Renjie He (Ph.D., University of Texas M.D. Anderson Cancer Center) for valuable discussions.References
1Essig, M. et al. Perfusion MRI: The Five Most Frequently Asked Clinical Questions. Am. J. Roentgenol. 201, W495–W510 (2013)
2Di Nallo, A. M. et al. Quantitative analysis of CT-perfusion parameters in the evaluation of brain gliomas and metastases. J. Exp. Clin. Cancer Res. 28, 38 (2009)
3Tofts, P. S. et al. Estimating kinetic parameters from dynamic contrast-enhanced T1-weighted MRI of a diffusable tracer: Standardized quantities and symbols. J. Magn. Reson. Imaging 10, 223–232 (1999)
4Kim, H. Variability in Quantitative DCE-MRI: Sources and Solutions. J. Nat. Sci. 4, e484 (2018)
5QIBA Profile: DCE-MRI Quantification (DCEMRI-Q). https://qibawiki.rsna.org/images/1/1f/QIBA_DCE-MRI_Profile-Stage_1-Public_Comment.pdf (2017)
Figures