3114
The evaluation of white matter lesion with 3D-T1 weighted imaging for predicting dementia1Department of Radiology, Juntendo University Graduate School of Medicine, Tokyo, Japan, 2Department of Radiological Sciences, Tokyo Metropolitan University Graduate School of Human Health Sciences, Tokyo, Japan, 3Department of Data Science, Juntendo University Graduate School of Medicine,, Tokyo, Japan, 4Faculty of Health Data Science, Juntendo University Graduate School of Medicine,, Chiba, Japan
Synopsis
Keywords: Segmentation, Segmentation, Dementia, Alzheimer's disease, Brain, White matter, Neuro
Motivation: Evaluating cognitive function-related white matter lesions (WML) conventionally requires 3D fluid attenuated inversion recovery (3D-FLAIR), which isn't always available. We aimed to explore the suitability of routinely acquired 3D-T1 weighted images (3D-T1WI) for WML assessment.
Goal(s): This study investigated whether 3D-T1WI could replace 3D-FLAIR in WML assessment.
Approach: We compared the correlation coefficient, ICC, and DSC of WML volume between 3D-FLAIR and 3D-T1WI, as well as its correlation with cognitive scores.
Results: WML based on 3D-T1WI strongly correlated with WML based on 3D-FLAIR, with high ICC, DSC, and cognitive score associations, indicating the potential of 3D-T1WI for WML assessment alternative to 3D-FLAIR.
Impact: White matter lesions (WML) based on 3D-T1 weighted images (3D-T1WI) closely matched 3D-fluid attenuated inversion recovery (3D-FLAIR) in WML area, volume, and cognitive function associations. It is suggested 3D-T1WI is valuable alternative to 3D-FLAIR for WML volume assessment.
INTRODUCTION
WML is closely associated with cognitive function1-4 and considered to be useful to predict dementia5, 6. Although WML is usually evaluated using 3D-FLAIR, it is rarely acquired compared to 3D-T1WI which is used for brain morphometry in clinical study. Therefore, the alternative use of 3D-T1WI for detecting WML, which is frequently acquired in clinical studies, is expected to be useful for predicting dementia. However, it is still unclear how much WML based on 3D-T1WI mirrors WML based on 3D-FLAIR. Therefore, this study investigated whether WML based on 3D-T1WI can serve as a useful alternative to WML based on 3D-FLAIR. This comparison included the evaluation of WML area and volume between 3D-FLAIR and 3D-T1WI, as well as the association of cognitive scores with each WML volume.METHODS
This study included longitudinal data (timepoints: baseline and 1 year later) involving 129 participants, including cognitively normal (CN) (52 patients), mild cognitive impairment (MCI) (55 patients), Alzheimer’s disease (AD) (22 patients) from ADNI3 database with 3D-T1WI, 3D-FLAIR and cognitive scores (Mini-Mental State Examination [MMSE], Montreal Cognitive Assessment [MoCA], Clinical Dementia Rating Sum of Boxes [CDRSB], Alzheimer’s Disease Assessment Scale [ADAS]-cog13, Logical Memory Delayed Recall Total [LDELTOTAL]). MR images were acquired using 5 models of 3T Siemens scanners.WML volume was evaluated using the Lesion Segmentation Tool (LST) for 3D-FLAIR and using FreeSurfer and Computational Anisotropy Toolbox 12 (CAT12) for 3D-T1WI (Figure 1). To compare the extracted WML area and volume based on 3D-FLAIR and 3D-T1WI, we calculated the Pearson’s correlation coefficient (r), the intraclass correlation coefficient (ICC (2,1)), and the Dice similarity coefficient (DSC). Cross-sectional (i.e., baseline) and longitudinal associations (i.e., 1 years later - baseline) of cognitive scores with WML volume in MCI and AD were assessed using Spearman’s partial correlation coefficient (rs) with covariates of age, gender, years of education, and intracranial volume. We also evaluated differences in the correlation coefficient using Fisher z transformation.
RESULTS
The correlation coefficient between WML volumes based on 3D-FLAIR and 3D-T1WI was 0.94 (p < 0.001) for both FreeSurfer and CAT12 (Figure 2). ICC (2, 1) was 0.73 (p < 0.001) for FreeSurfer and 0.92 (p < 0.001) for CAT12, respectively. DSC decreased as WML volume became smaller (Figure 3), and the average of DSCs of WML based on 3D-FLAIR and 3D-T1WI was 0.34 and 0.37 for FreeSurfer and CAT12, respectively.The cross-sectional WML volume was significantly associated with MMSE, ADAS-cog13 and the longitudinal change of WML volume was significantly associated with MMSE, CDRSB and LDELTOTAL (Figure 4). The average differences in z-transformed correlation coefficients were 0.08 and 0.10 in cross-sectional data and 0.17 and 0.10 in longitudinal data for FreeSurfer and CAT12, respectively (Figure 5).
DISCUSSION
The correlation coefficient between WML volume based on 3D-FLAIR and 3D-T1WI was quite consistent with previous study10 that compared WML volume based on 3D-FLAIR using LST with WML volume based on 3D-T1WI using FreeSurfer (r = 0.94, p < 0.001). In another previous study11 that compared WML volume based on 3D-FLAIR that was manually segmented with WML volume based on 3D-T1WI using FreeSurfer, the correlation coefficient was 0.94 (p < 0.05) and DSC was 0.44. The result also matched our results.The previous studies on the association between WML volume and cognitive function demonstrated that cross-sectional WML volume based on 3D-FLAIR was significantly associated with MMSE12 and with ADAS-Cog1113. Moreover, a longitudinal study also showed the changes of WML based on 3D-FLAIR was significantly associated with the changes of MMSE13,14, CDRSB13. Our findings suggest a comparable trend with the previously reported results. Additionally, concerning WML volume correlation, ICC, DSC and association of cognitive scores, WML based on 3D-T1WI using CAT12 more accurately mirrored WML based on 3D-FLAIR when compared to FreeSurfer.
These findings indicate that the volume of WML based on 3D-T1WI using CAT12 could be a beneficial substitute for WML volumes based on 3D-FLAIR.
CONCLUSION
WML volume based on 3D-T1WI using CAT12 were highly consistent with that based on 3D-FLAIR in terms of WML area, volume, and associations with cognitive functions, and could be a useful alternative to 3D-FLAIR.Acknowledgements
This research was supported by Brain/MINDS Beyond program (grant no. JP18dm0307006, JP18dm0307001, JP18dm0307004, JP18dm0307008, JP19dm0207069, JP19dm0307101, and JP22dm0307002) of the Japan Agency for Medical Research and Development (AMED), AMED under grant number JP21wm0425006, JSPS KAKENHI (grant nos. 20K16737, 21K07690, 21K12153, 21K15833, 22H04926, 23H02865), a Grant- in-Aid for Special Research in Subsidies for ordinary expenses of private schools from The Promotion and Mutual Aid Corporation for Private Schools of Japan, and the Juntendo Research Branding Project. This study was also supported by the World Premier International-International Research Center for Neurointelligence [9] (WPI-IRCN) and Japan Science and Technology Agency (JST) Moonshot R&D Grant Number JPMJMS2021.
References
1. Guo W, Shi J. White matter hyperintensities volume and cognition: A meta-analysis. Front Aging Neurosci. 2022;14:949763.
2. Ikram MA, Vrooman HA, Vernooij MW, den Heijer T, Hofman A, Niessen WJ, et al. Brain tissue volumes in relation to cognitive function and risk of dementia. Neurobiol Aging. 2010;31(3):378-86.
3. Junque C, Pujol J, Vendrell P, Bruna O, Jodar M, Ribas JC, et al. Leuko-araiosis on magnetic resonance imaging and speed of mental processing. Arch Neurol. 1990;47(2):151-6.
4. Wakefield DB, Moscufo N, Guttmann CR, Kuchel GA, Kaplan RF, Pearlson G, et al. White matter hyperintensities predict functional decline in voiding, mobility, and cognition in older adults. J Am Geriatr Soc. 2010;58(2):275-81.
5. Smith EE, Egorova S, Blacker D, Killiany RJ, Muzikansky A, Dickerson BC, et al. Magnetic resonance imaging white matter hyperintensities and brain volume in the prediction of mild cognitive impairment and dementia. Arch Neurol. 2008;65(1):94-100.
6. Prasad K, Wiryasaputra L, Ng A, Kandiah N. White matter disease independently predicts progression from mild cognitive impairment to Alzheimer's disease in a clinic cohort. Dement Geriatr Cogn Disord. 2011;31(6):431-4.
7. Azizyan A, Sanossian N, Mogensen MA, Liebeskind DS. Fluid-attenuated inversion recovery vascular hyperintensities: an important imaging marker for cerebrovascular disease. AJNR Am J Neuroradiol. 2011;32(10):1771-5.
8. Waymont JMJ, Petsa C, McNeil CJ, Murray AD, Waiter GD. Validation and comparison of two automated methods for quantifying brain white matter hyperintensities of presumed vascular origin. J Int Med Res. 2020;48(2):300060519880053.
9. Badji A, Westman E. Cerebrovascular pathology in Alzheimer's disease: Hopes and gaps. Psychiatry Res Neuroimaging. 2020;306:111184.
10. Cedres N, Ferreira D, Machado A, Shams S, Sacuiu S, Waern M, et al. Predicting Fazekas scores from automatic segmentations of white matter signal abnormalities. Aging (Albany NY). 2020;12(1):894-901.
11. Hotz I, Deschwanden PF, Liem F, Merillat S, Malagurski B, Kollias S, et al. Performance of three freely available methods for extracting white matter hyperintensities: FreeSurfer, UBO Detector, and BIANCA. Hum Brain Mapp. 2022;43(5):1481-500.
12. Lo RY, Jagust WJ, Alzheimer's Disease Neuroimaging I. Vascular burden and Alzheimer disease pathologic progression. Neurology. 2012;79(13):1349-55.
13. Wang YL, Chen W, Cai WJ, Hu H, Xu W, Wang ZT, et al. Associations of White Matter Hyperintensities with Cognitive Decline: A Longitudinal Study. J Alzheimers Dis. 2020;73(2):759-68.
14. Gertje EC, Janelidze S, van Westen D, Cullen N, Stomrud E, Palmqvist S, et al. Associations Between CSF Markers of Inflammation, White Matter Lesions, and Cognitive Decline in Individuals Without Dementia. Neurology. 2023;100(17):e1812-e24.
Figures
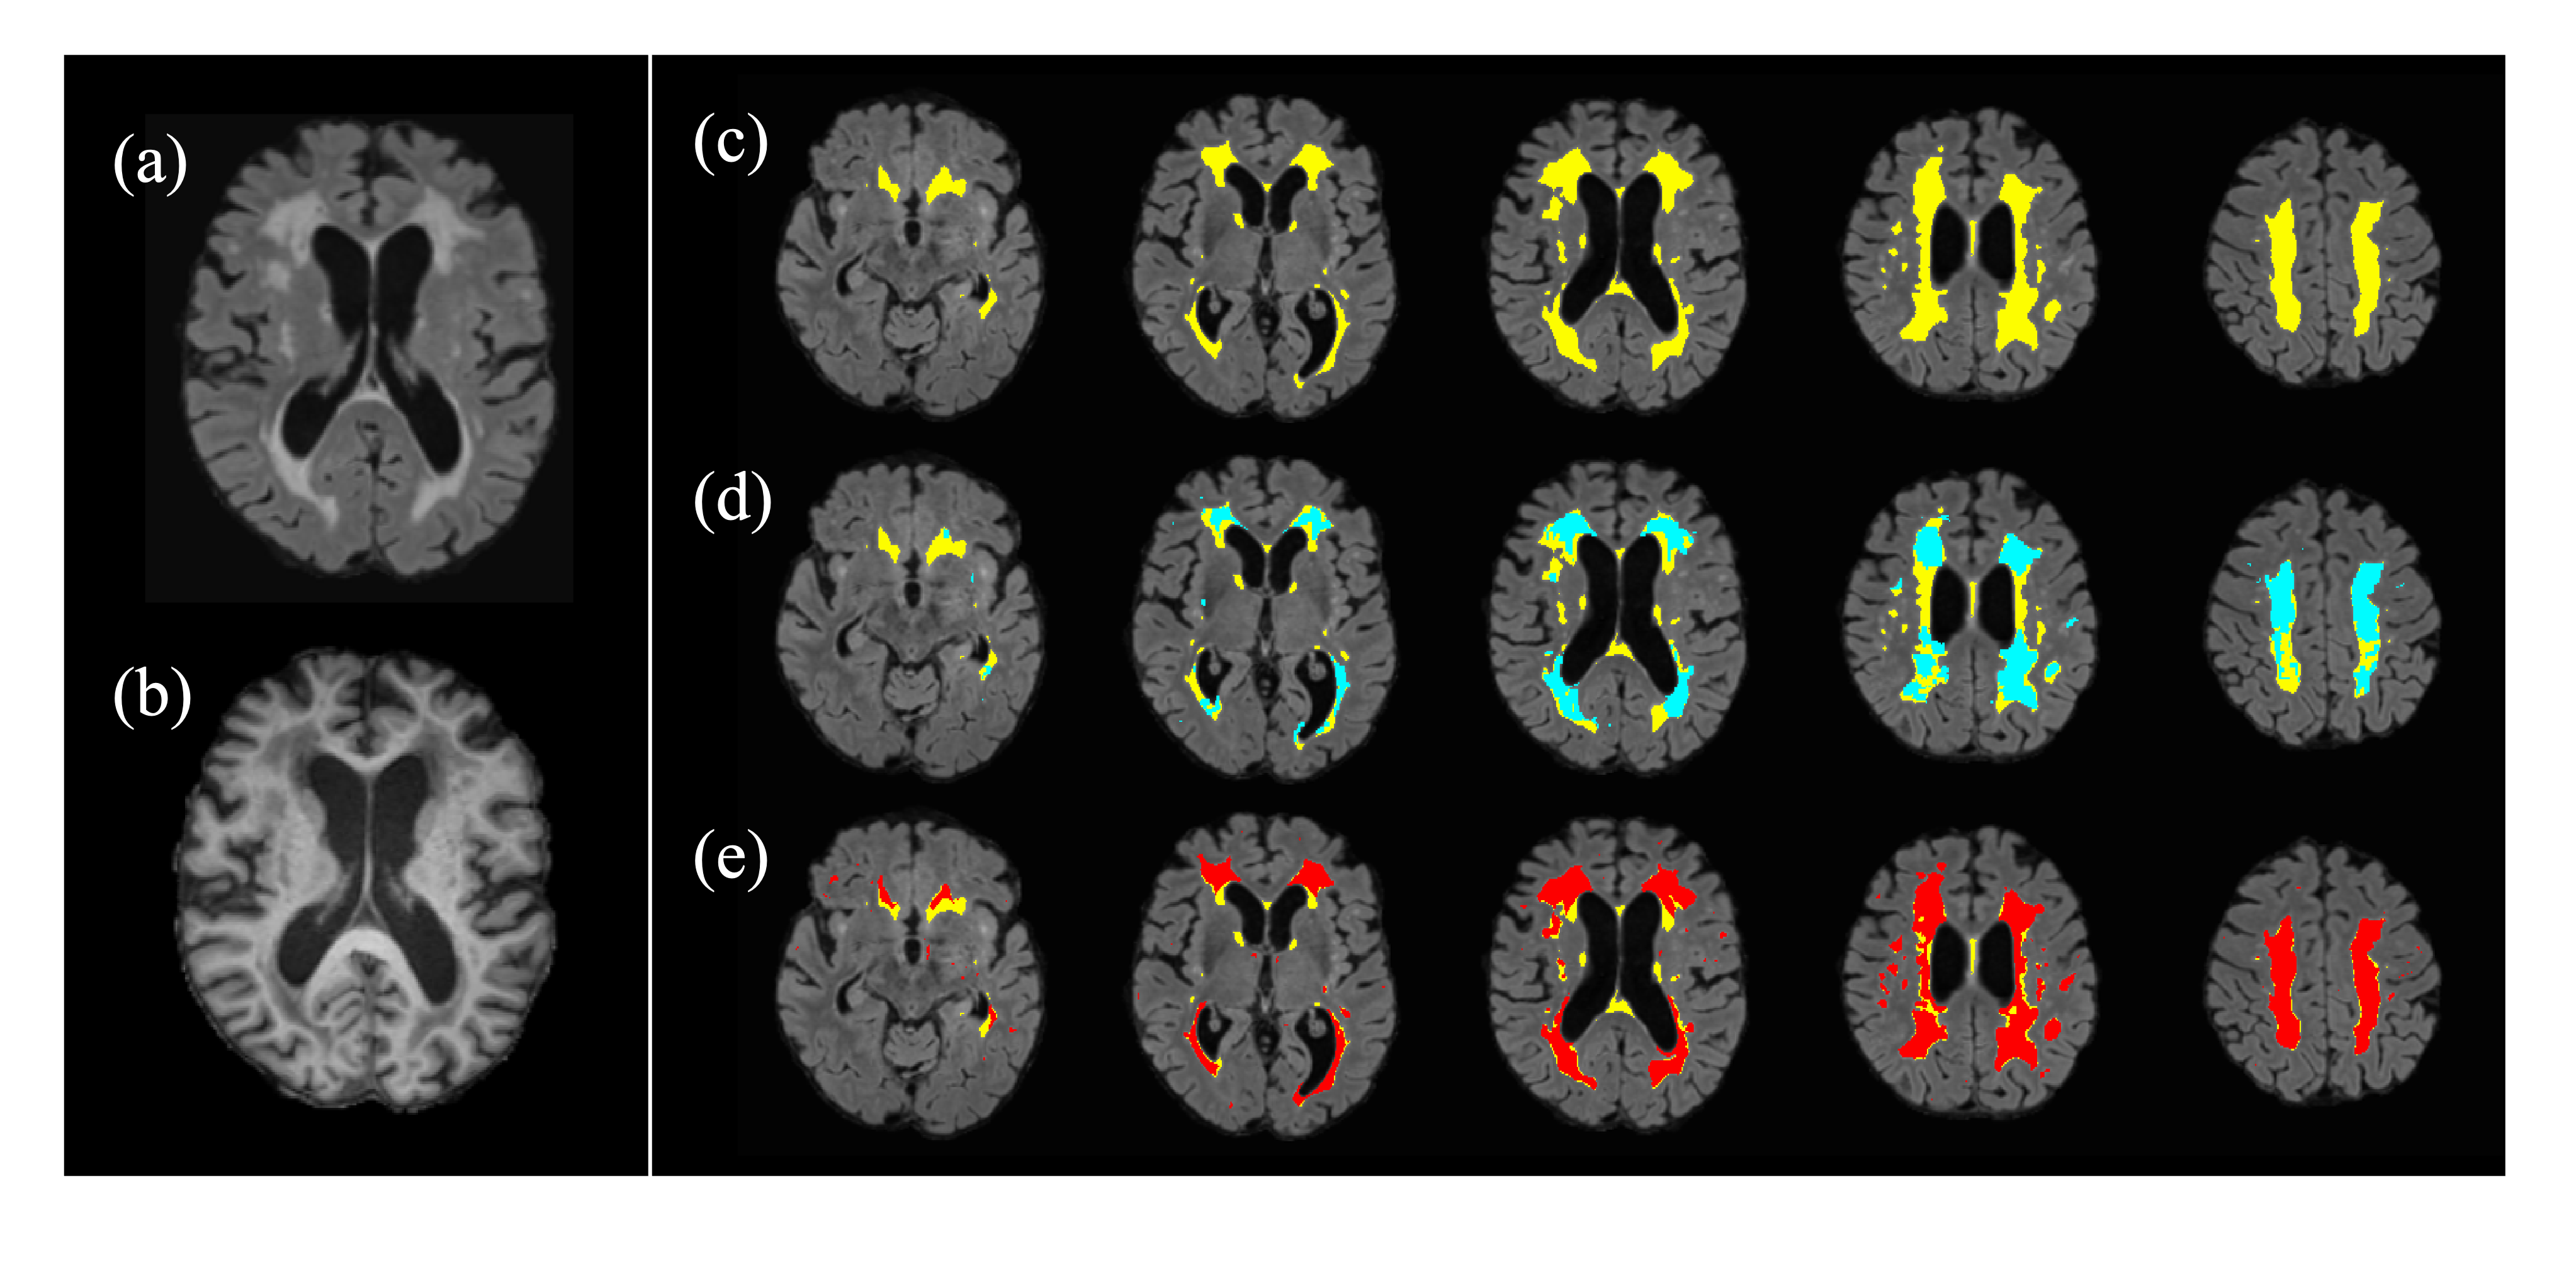
Figure 1. An example of FLAIR (a), 3D-T1WI image (b) and comparison of WML from each segmentation (c)-(e)
An example of 3D-FLAIR(a), 3D-T1WI(b) is shown. While WML on FLAIR has high signal intensity than surrounding white matter, WML on 3D-T1WI has lower signal intensity. (c)-(e) illustrate WML segmented in each way on FLAIR image. (c) represents WML using LST (color: yellow). In (d), WML using FreeSurfer (color: blue) is overlaied on top of WML using LST (color: yellow). Likewise, in (c), WML using CAT12 (color: red) is overlaied on top of WML using LST (color: yellow).
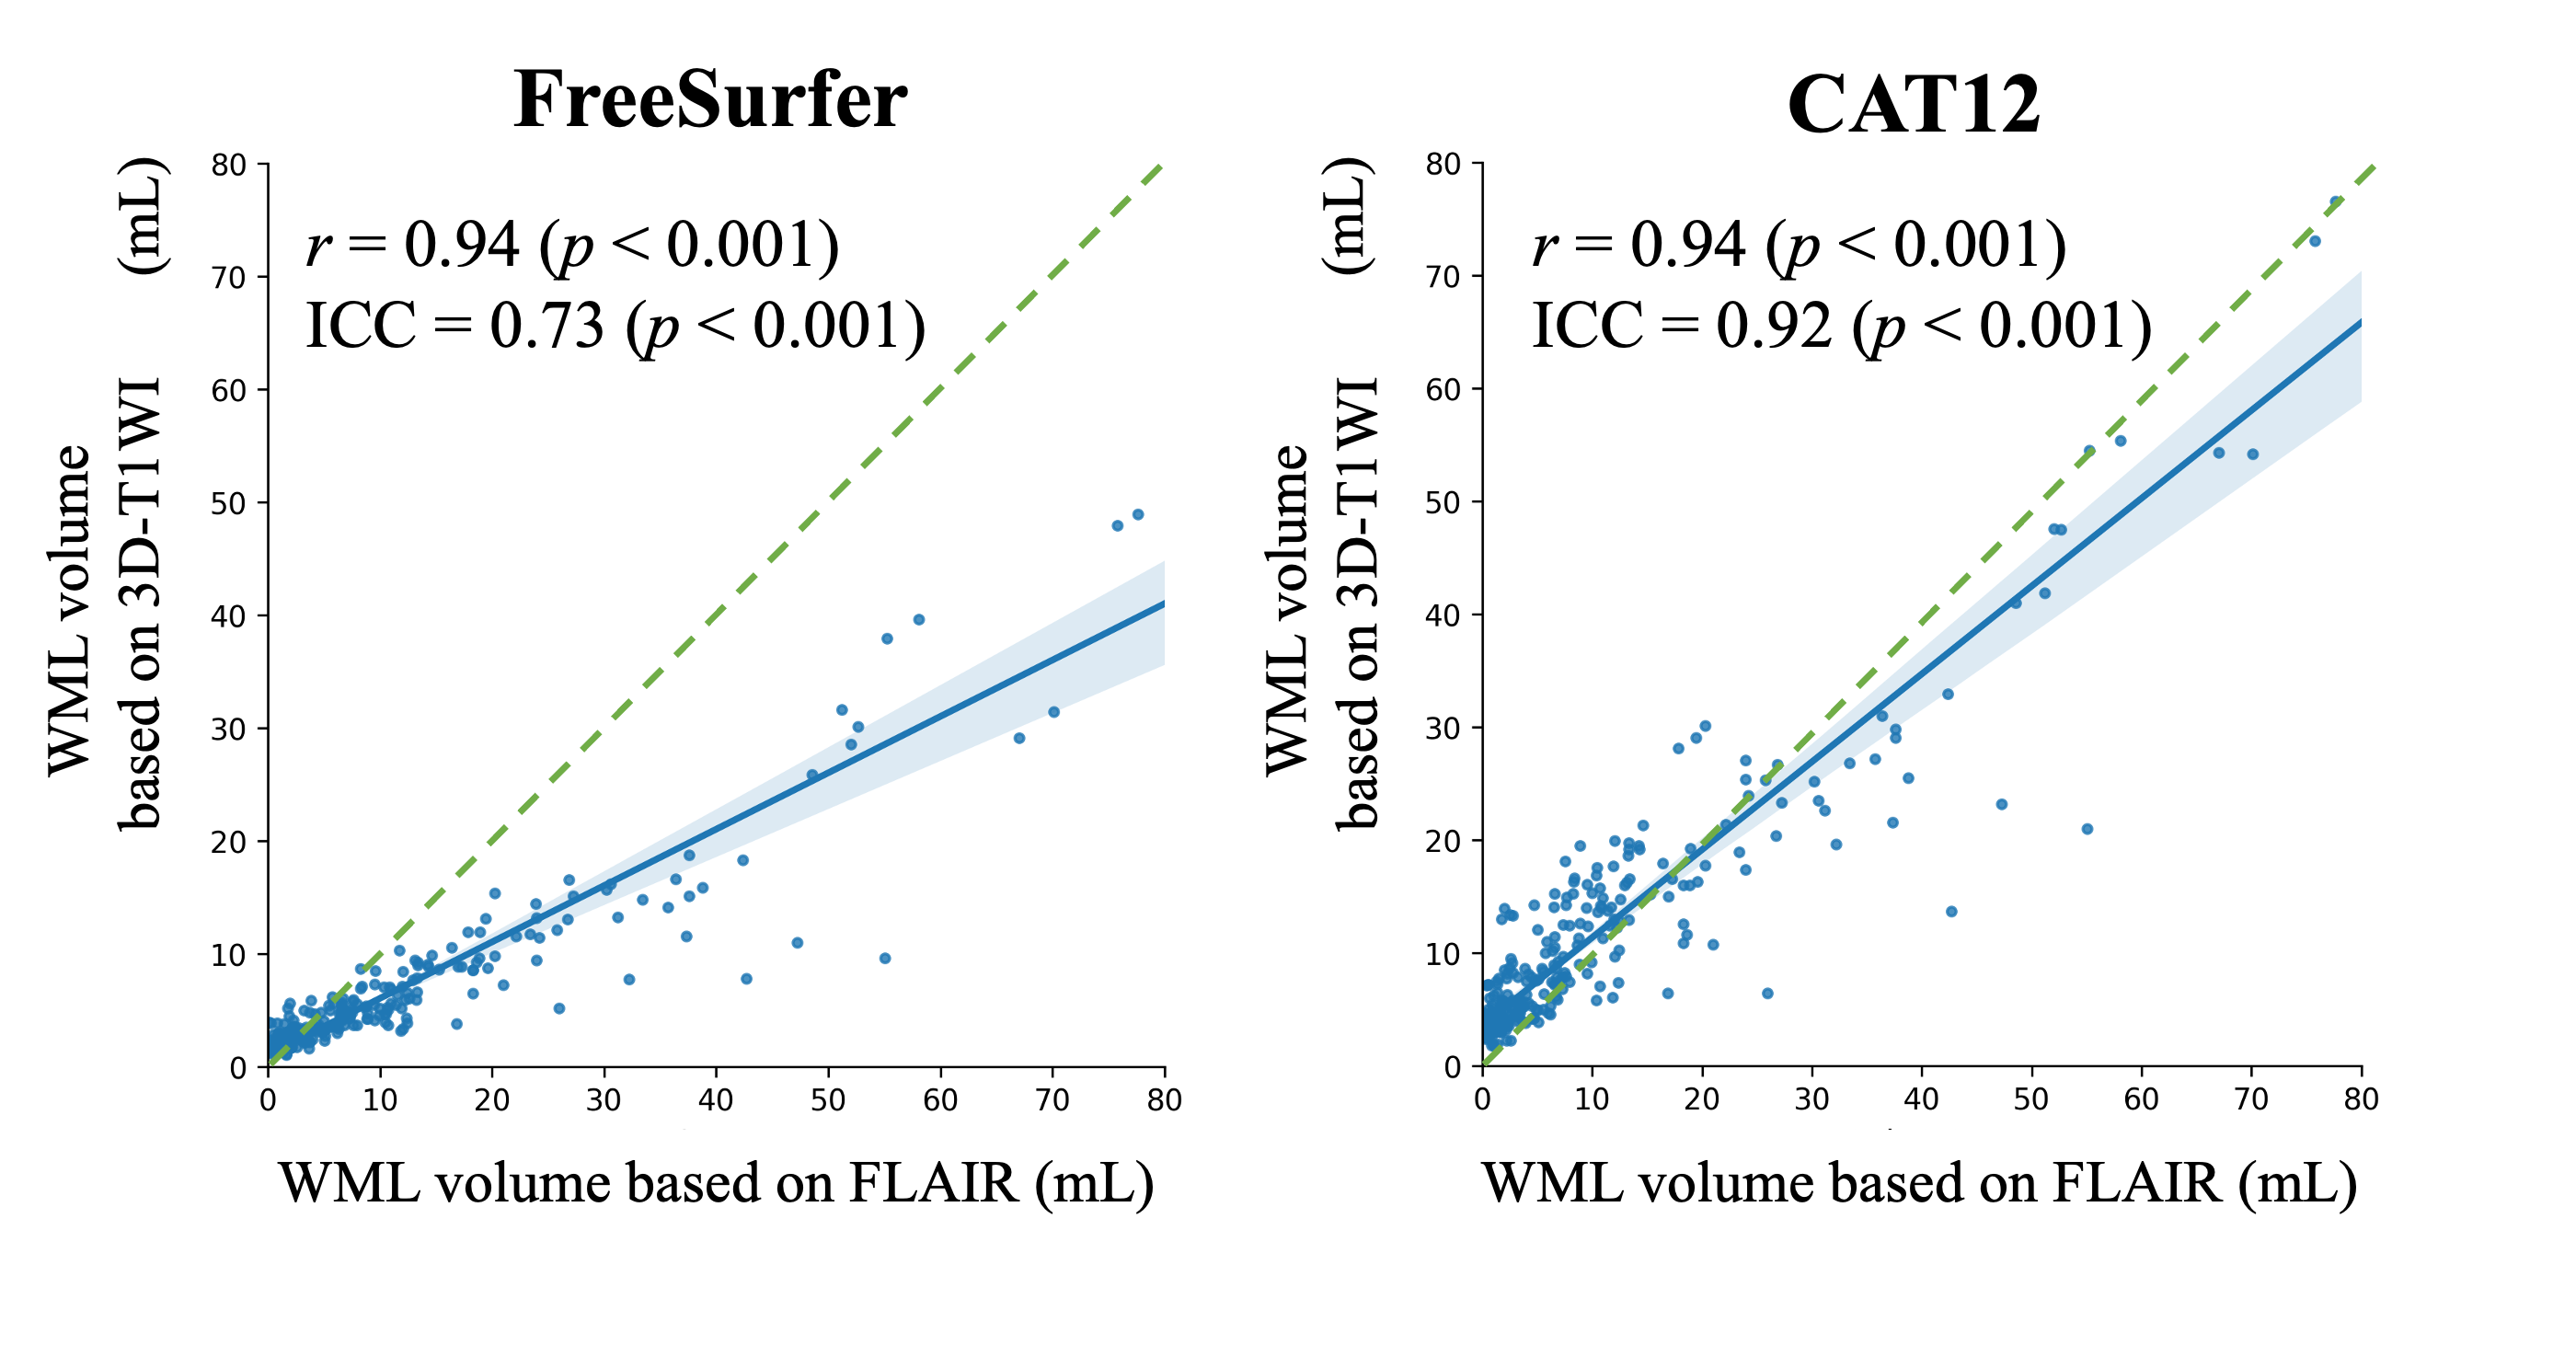
Figure 2. The correlation of WML volume between FLAIR and 3D-T1WI
The graphs show the associations between WML volumes based on 3D-FLAIR (i.e., LST) and 3D-T1WI (i.e., FreeSurfer and CAT12). The blue area indicates 95% CIs and green dotted line means the line of y = x. The correlation coefficient is 0.94 (p < 0.001) for both FreeSurfer and CAT12. Moreover, ICC (2,1) was 0.73 (p < 0.001) for FreeSurfer and 0.92 (p < 0.001) for CAT12, respectively.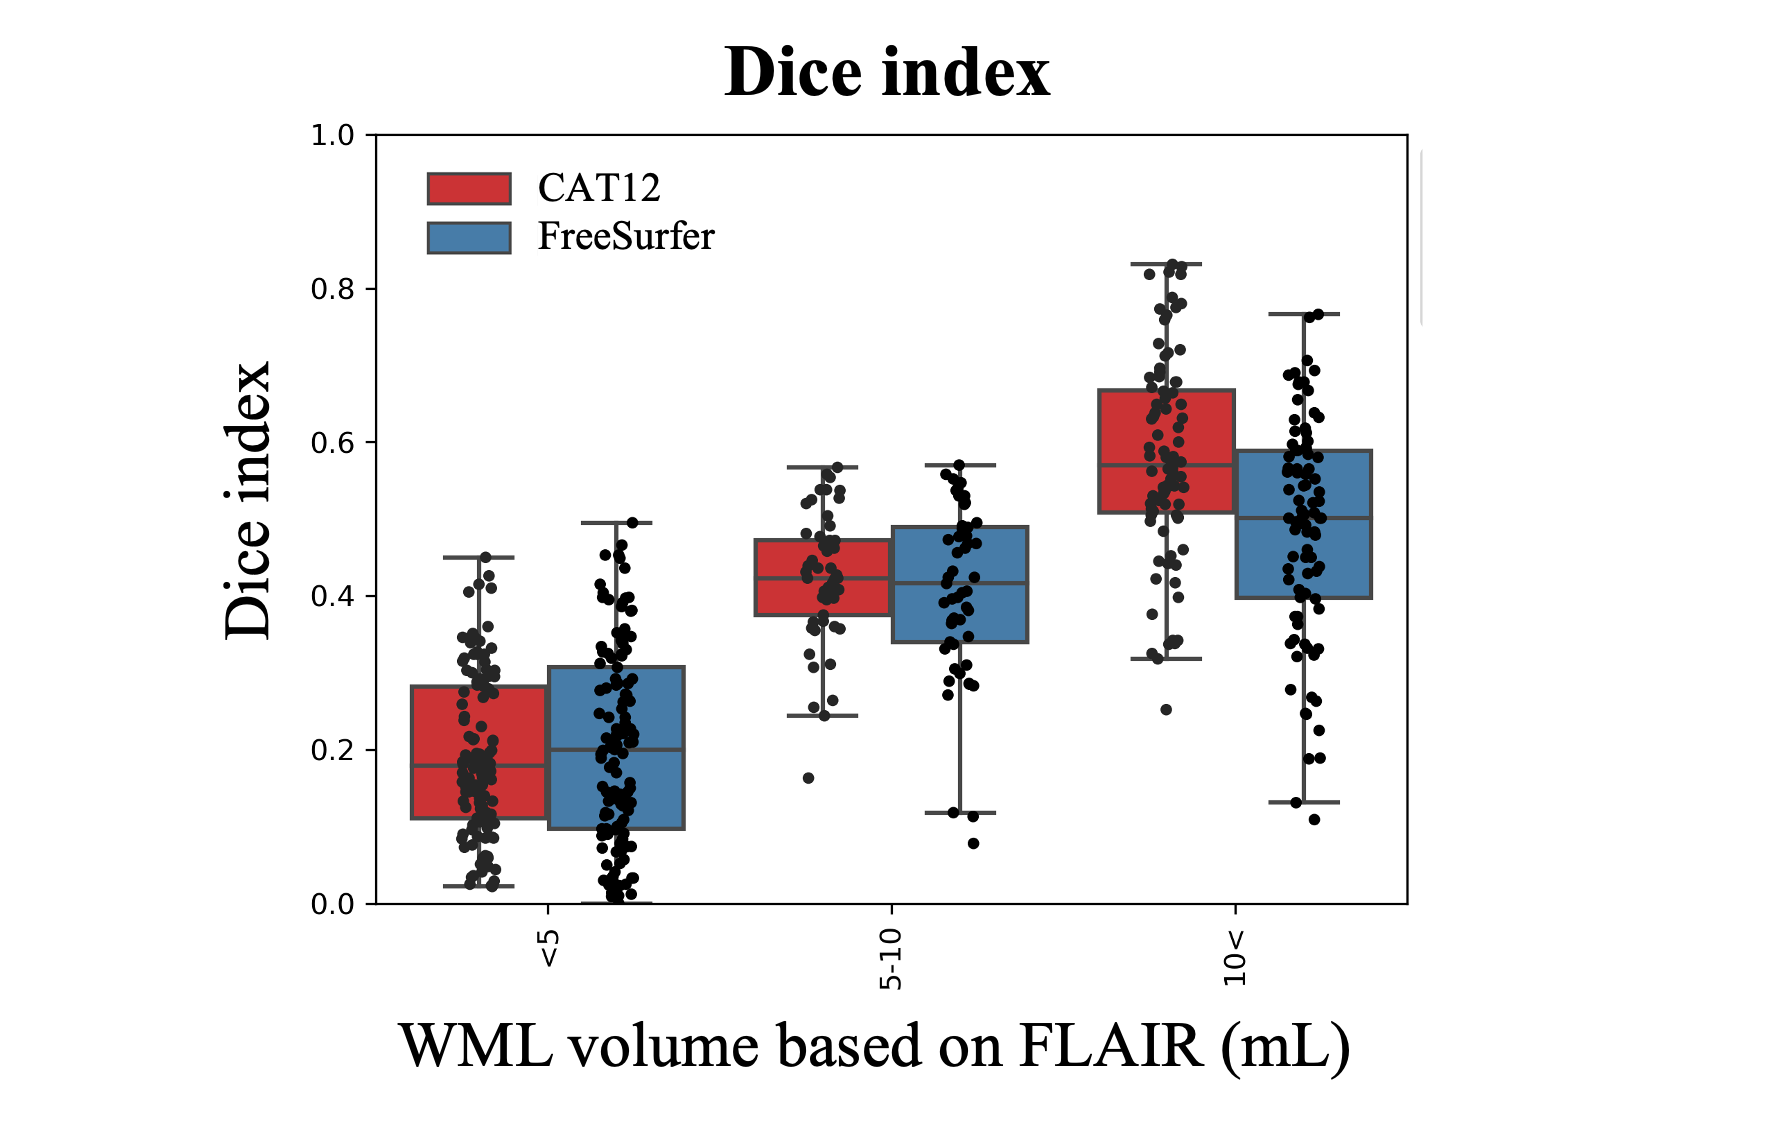
Figure 3. Dice coefficient distribution between WML based on FLAIR and WML based on 3D-T1WI
This graph shows a variability of Dice coefficient between WML based on FLAIR and WML based on 3D-T1WI. Also, Dice coefficient distribution were shown as WML volume based on FLAIR were divided into 0∼5 [mL], 5∼10 [mL] and 10 [mL]∼.
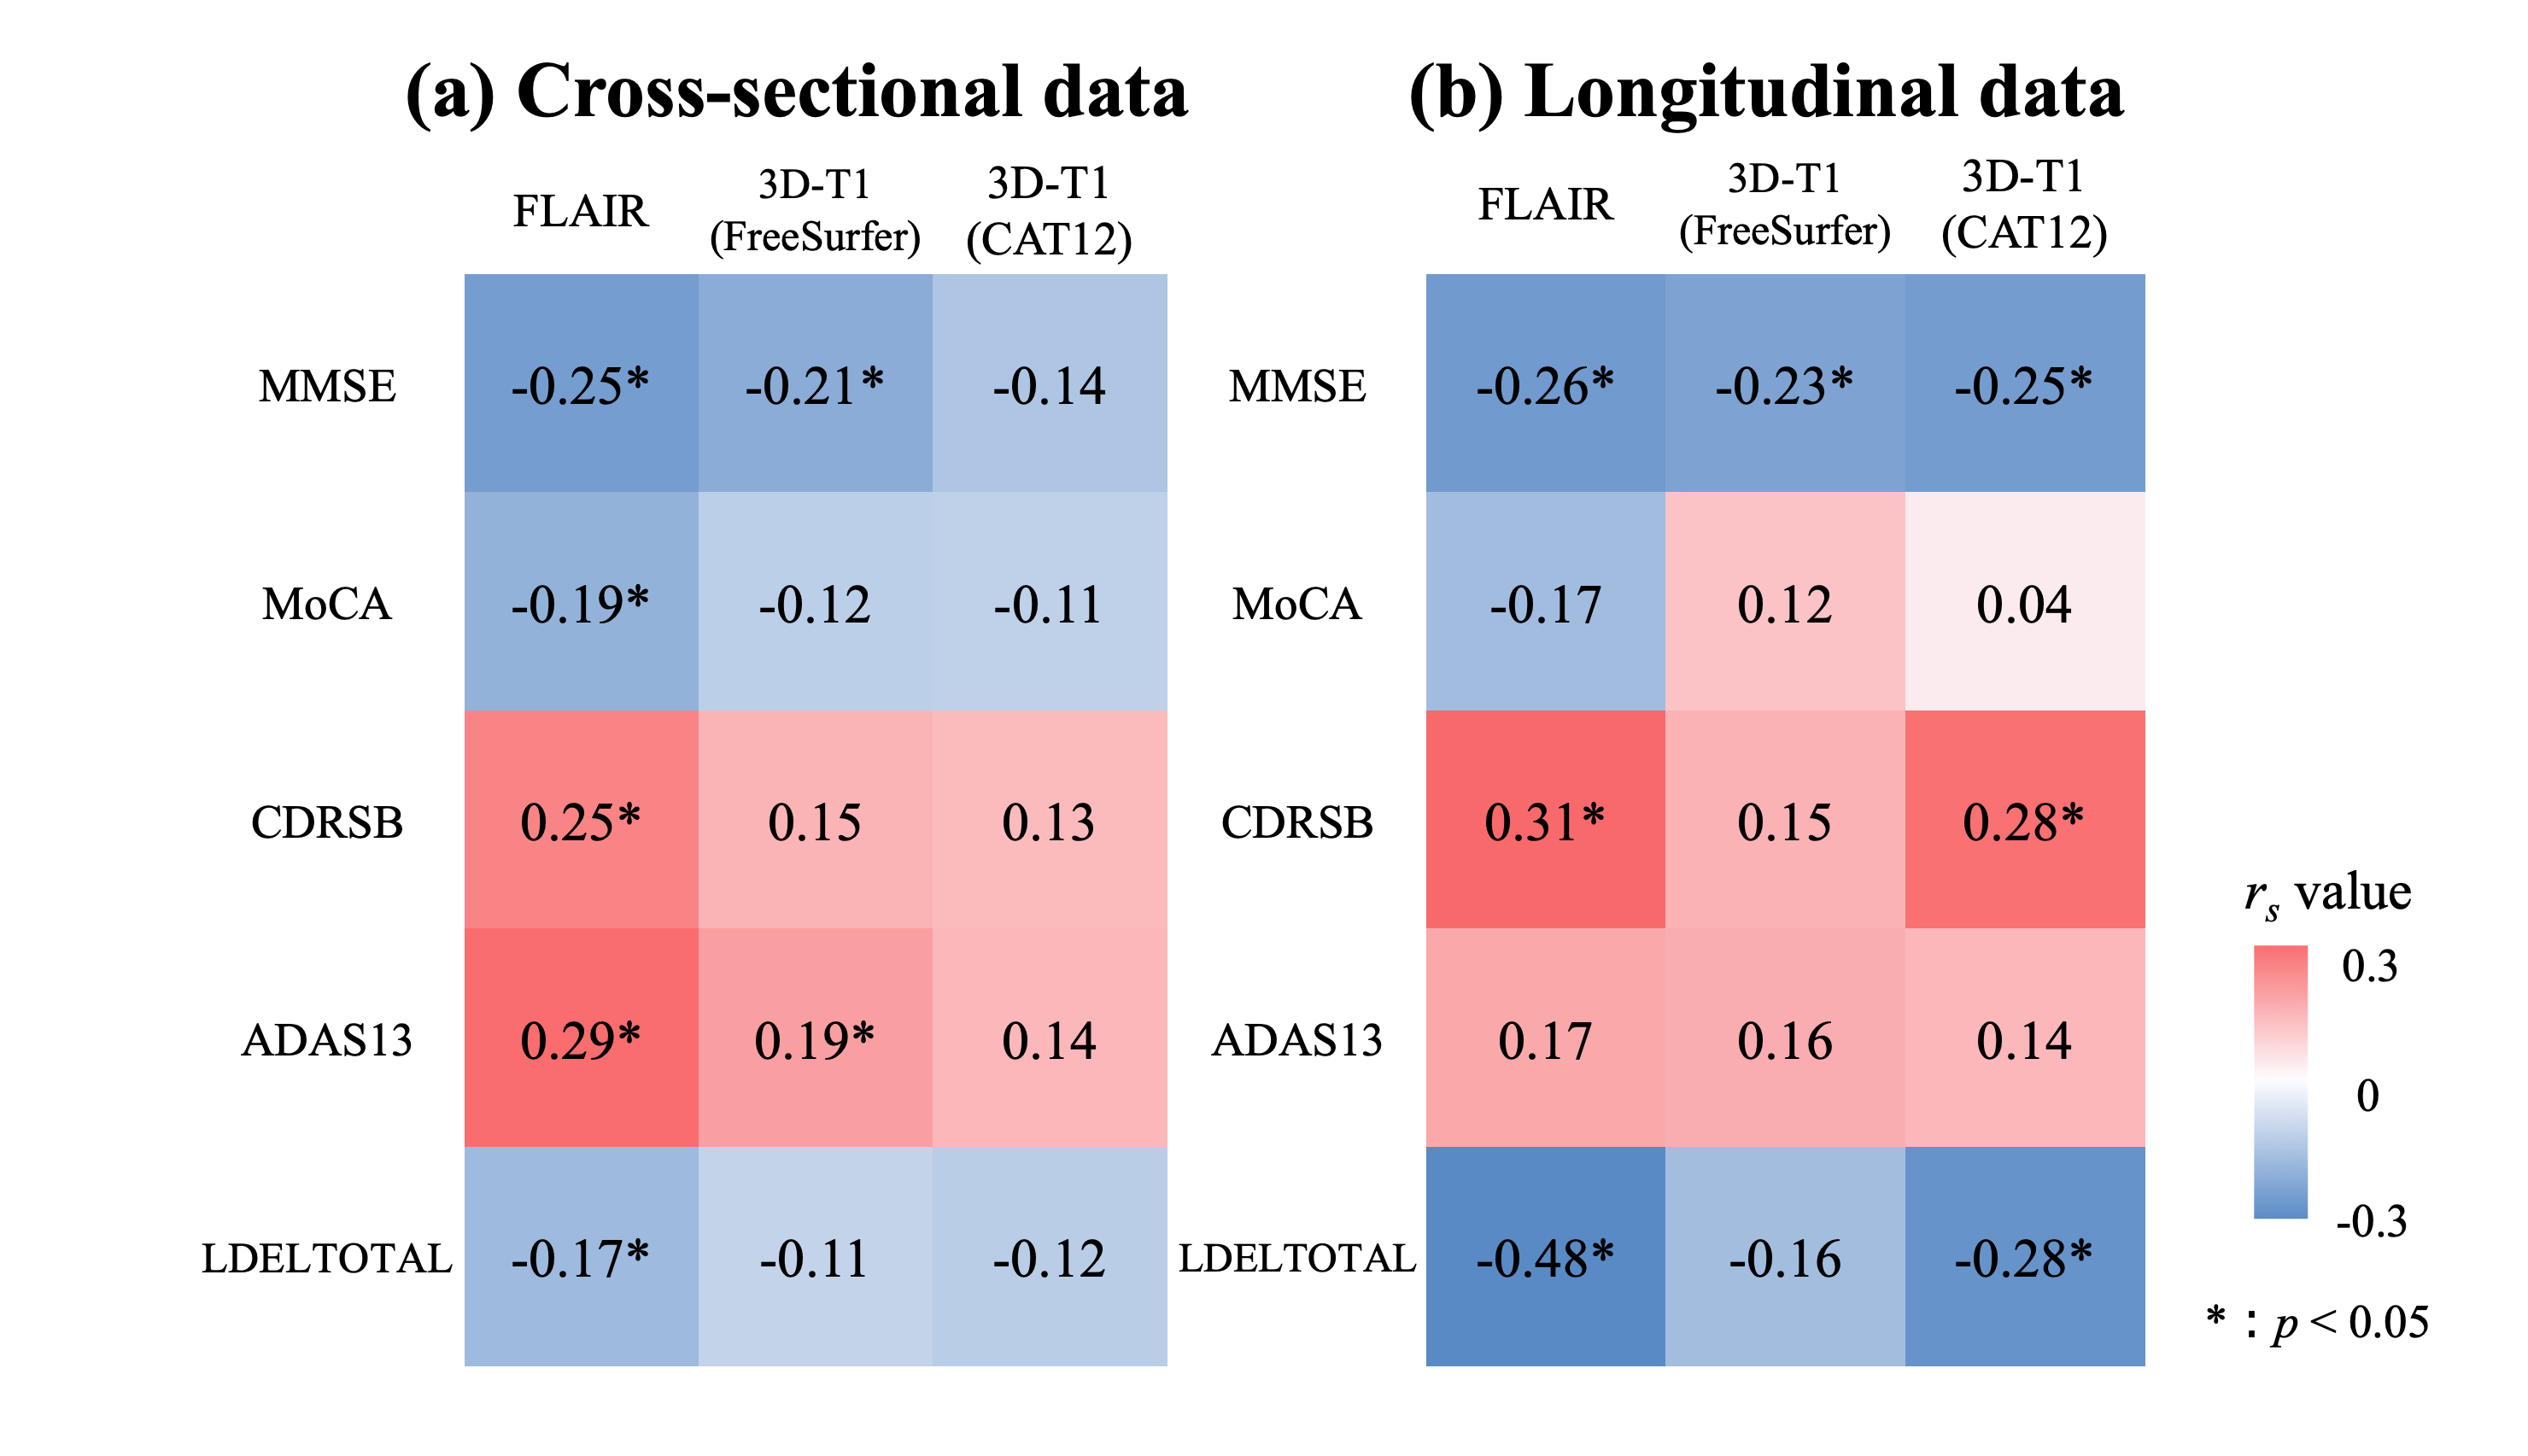
Figure 4. The correlation between WML volume and cognitive scores
The heat map shows Spearman’s correlation coefficient between WML volume and cognitive score. (a) The correlation between WML volume and each cognitive scores in cross-sectional data (i.e, baseline). (b) The correlation between WML volume change and cognitive score change for 1 year in longitudinal data (i.e., 1 years later - baseline).
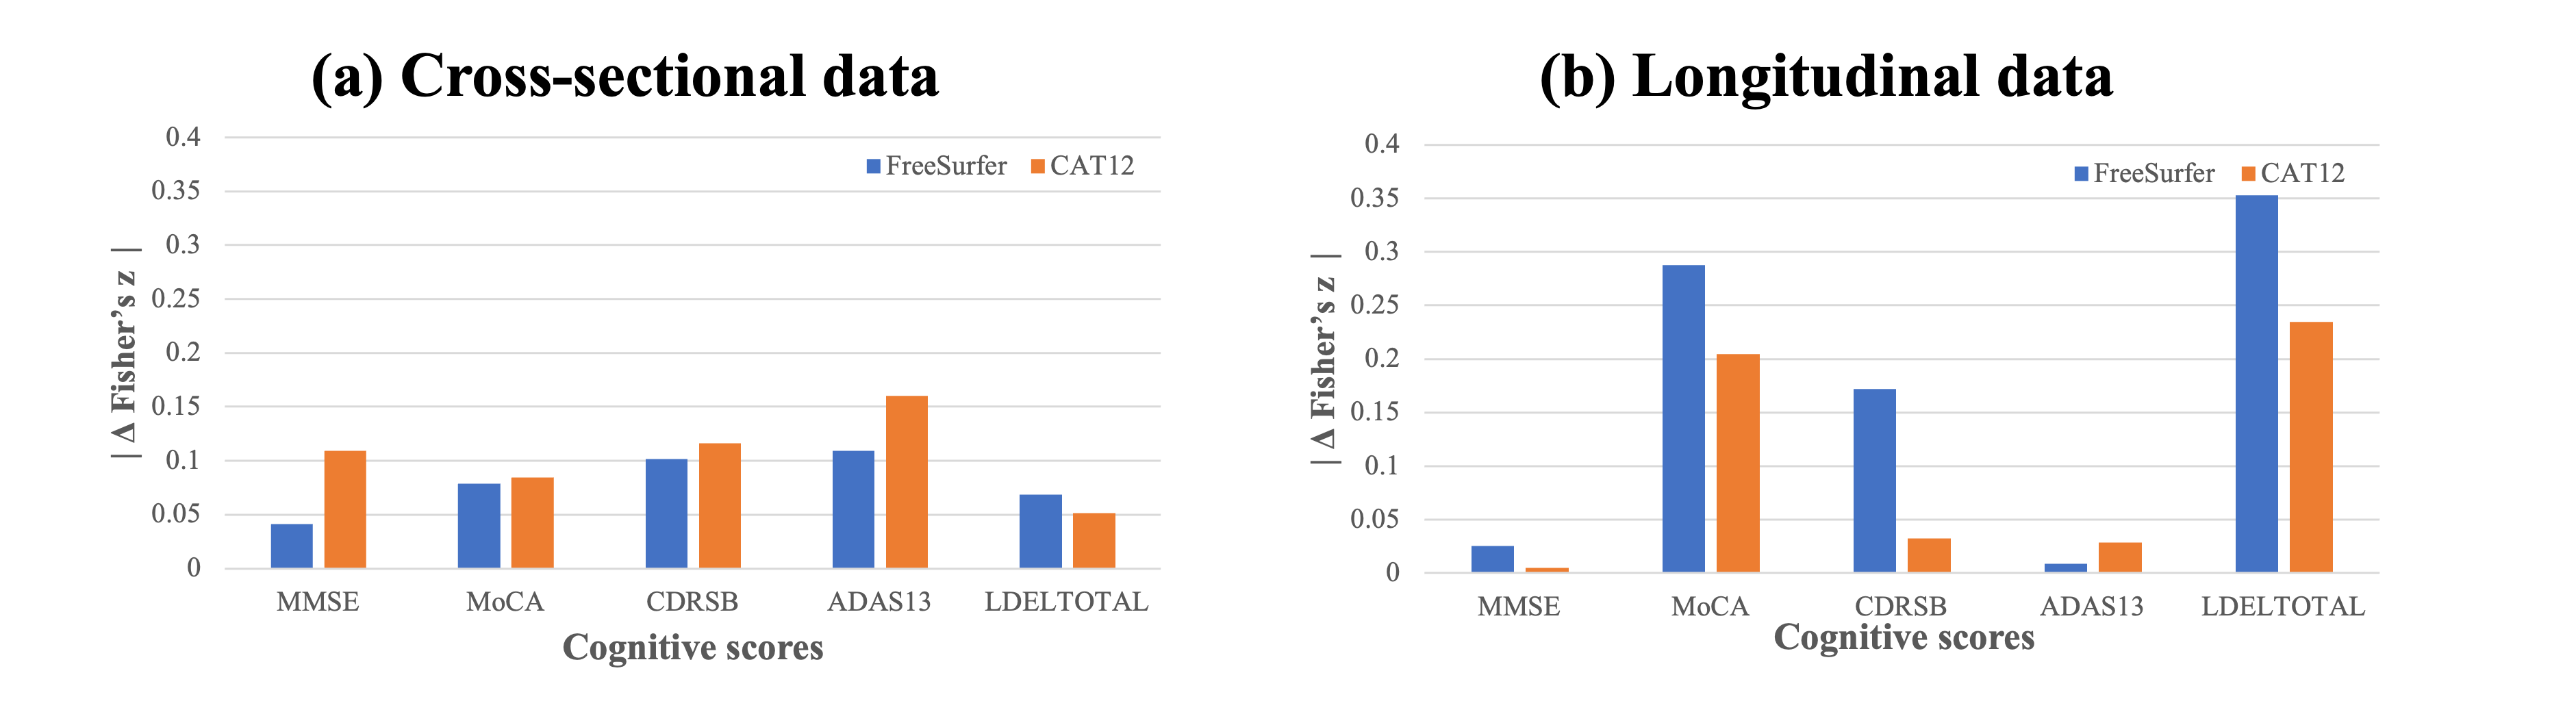
Figure 5. The difference of Fisher’s z of Spearman rank correlation coefficient between 3D-FLAIR and 3D-T1WI
The graphs show the difference namely |ΔFisher’s z |, of the Fisher z transformed Spearman’s partial correlation coefficient of cognitive scores and WML volume between 3D-FLAIR (i.e., LST) and 3D-T1WI (i.e., FreeSurfer and CAT12) for cross-sectional data (i.e, baseline) (a) and longitudinal data (i.e,. 1 years later - baseline) (b)