3112
Evaluation of liver function using Gd-EOB-DTPA-enhanced MRI by B1-corrected VFA T1 mapping method1The First Affiliated Hospital of Guangxi Medical University, Nanning, China, 2MR Research Collaboration, Siemens Healthineers Ltd., Wuhan, China
Synopsis
Keywords: Data Processing, Liver
Motivation: There is a lack of suitable tools for monitoring liver function to determine the optimal treatment strategy for patients.
Goal(s): To evaluate the value of B1-corrected VFA T1 mapping in predicting liver function.
Approach: T1 relaxation time at corresponding time-points in B1-corrected VFA T1 mapping were measured. We analyzed the correlation of T1 value with indocyanine green retention rate at 15min (ICG-R15) and conducted Receiver operating characteristic (ROC) to evaluate the albumin-bilirubin (ALBI) grade classification efficiency by T1 mapping parameters.
Results: T1-10min, T1-HBP and △T1% showed moderate correlation with ICG-R15. T1-5min had the best diagnostic efficacy in differentiating ALBI 1 and ALBI 2.
Impact: This study explored that T1 value of Gd-EOB-DTPA-enhanced MRI by B1-corrected VFA method can be used as noninvasive imaging indicators for estimation of liver function.
Introduction
Monitoring disease progression is particularly important for determining the optimal treatment strategy in patients with liver disease. T1 relaxation time obtained from B1-corrected variable flip angle (VFA) sequence has been suggested as a reliable method to assess liver function with the uptake characteristics of Gd-EOB-DTPA1,2. This study explored the value of Gd-EOB-DTPA-enhanced MRI using B1-corrected VFA method for evaluating liver function with indocyanine green retention rate at 15 min (ICG-R15) and the ALBI grade.Methods
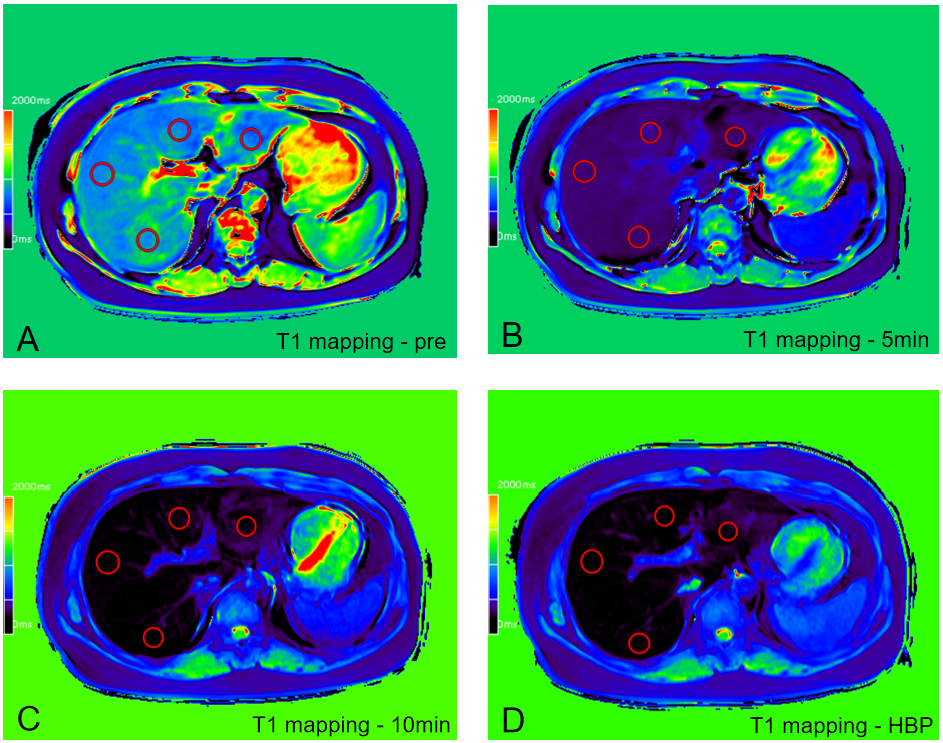
This prospective study included 78 patients who underwent Gd-EOB-DTPA enhanced MRI for focal liver lesions on a 3T MR scanner (MAGNETOM Prisma, Siemens Healthcare, Erlangen, Germany). T1 maps using B1-corrected VFA method were obtained four times at the pre-contrast phase, 5min, 10min and hepatobiliary phase (HBP) after the injection of Gd-EOB-DTPA. The B1-corrected VFA sequence was performed using the following parameters: TR = 5050ms, TE = 1.83 ms, Slice thickness=8mm, FOV =381×309mm2, and acquisition time = 10s. The parameters of T1 mapping were TR = 3.62ms, TE = 1.03ms, Flip Angle =2°/12°, Slice thickness=3mm, FOV = 380×295mm2, and acquisition time = 9.4s. Four similar-sized elliptical regions of interest (ROI, area range: 0.9-1.1cm2) were drawn in left medial lobe, left lateral lobe, right posterior lobe and right anterior lobe of each T1 map, carefully avoiding lesions, vasculature, bile ducts and artifacts (Figure 1). The mean values of the measured T1 value in each ROI at corresponding time-points (T1-pre, T1-5min, T1-10min and T1-HBP) were considered representative T1 relaxation time. The △T1 (T1-HBP-T1-pre) and △T1%[(T1-HBP-T1-pre)/T1-pre]were calculated.Clinical data included ICG-R15, albumin and total bilirubin. ALBI score was calculated as ALBI = -0.085×albumin (g/L) + 0.66×Log10 total bilirubin (μmol/L), and liver function grading was performed according to an established score. Patients were divided into group 1 [ALBI grade 1 (≤ −2.60), n = 48], and group 2 [ALBI grade 2 (>-2.60 to −1.39) , n = 30].
Spearman's correlation analysis was used to evaluate the correlation between T1 value and ICG-R15. Nonparametric test was used to compare T1 value between different groups. Receiver operating characteristic (ROC) curves were used to evaluate the liver function classification efficiency of each imaging index. P < 0.05 was considered statistically significant.
Results
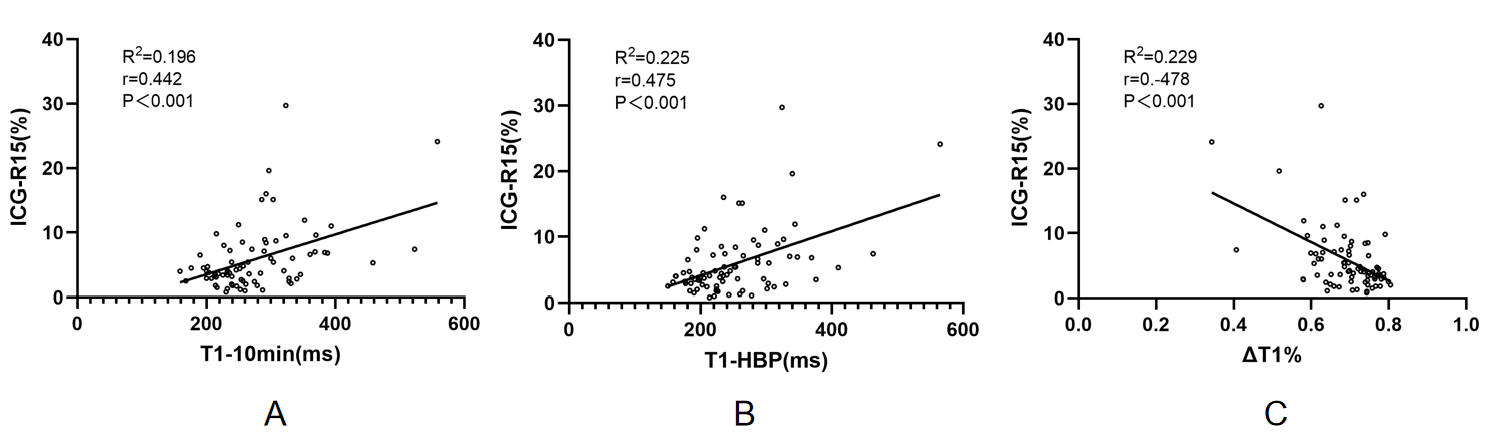
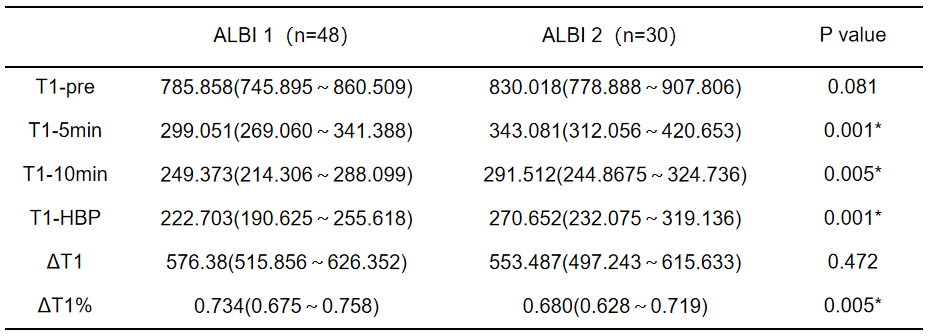
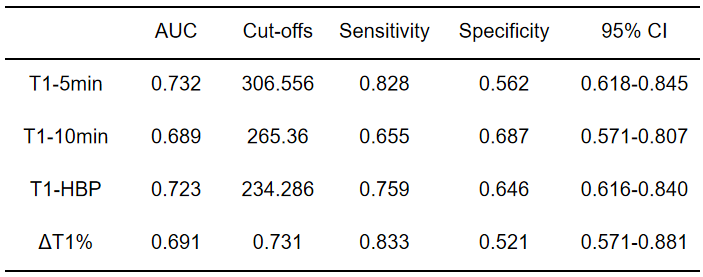
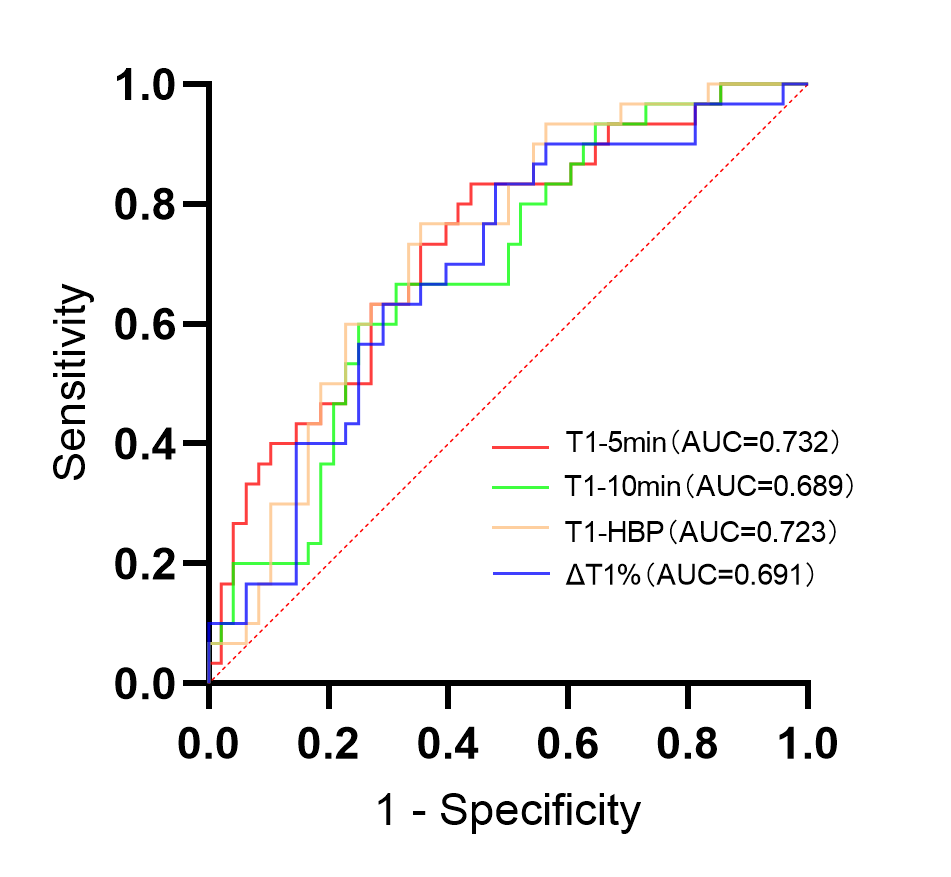
Spearman's correlation analysis showed that T1-10min, T1-HBP and △T1% had moderate correlation with ICG-R15 (Figure 2). △T1% had the highest correlation with ICG-R15 among these parameters (r = 0.-478, P < 0.001).For patients in group 1 and 2 (Table 1), T1 values gradually decrease over time in each group, and T1 value at different acquisition time points after the injection of Gd-EOB-DTPA were significantly larger and △T1% were significantly smaller in patients with ALBI 2 compared with patient with ALBI 1 (p<0.05). T1-pre and △T1 had no significant differences between the two groups. The ROC analysis showed high diagnostic performance (AUC from 0.689 to 0.732) among ALBI 1 and ALBI 2. T1-5min had the best diagnostic efficacy in differentiating ALBI 1 and ALBI 2 (AUC=0. 732) (Table 2 and Figure 3).
Discussion
ICG-R15 is considered one of the most valuable and reliable tests for assessing hepatic reserve function. Haimerl et al.1 and Kamimura et al.3 reported significant correlations between ICG-R15 and the T1 relaxation time index. Similarly, our study showed that ICG-R15 had correlations with T1-10min, T1-HBP and △T1%. In recent years, the ALBI grade has been proposed as a method to evaluate liver function, showing better capture of the progression of less severe liver disease than the Child-Pugh and MELD scores. In our study, T1 values gradually decrease over time in each group, and T1 values at different acquisition time points after the injection of Gd-EOB-DTPA were significantly prolonged in patients with ALBI 2 compared with ALBI 1. The △T1% in ALBI 1 were significantly higher than ALBI 2. These results support the study of Li et al.4. There were significant differences in T1-HBP and △T1% among ALBI 1 and ALBI 2, which is consistent with the findings of MA et al5. The results showed that T1 values using B1-corrected VFA method can be used as a feasible parameter to differentiate the grade of liver function with ALBI 1 and ALBI 2.Conclusion
T1 relaxation time of Gd-EOB-DTPA-enhanced MRI by B1-corrected VFA method can be used as noninvasive imaging indicators for estimation of liver function.Acknowledgements
This study was supported by the National Natural Science Foundation of China (No. 82060310).References
[1] Haimerl M, Schlabeck M, Verloh N et al (2016), Volume-assisted estimation of liver function based on Gd-EOB-DTPA-enhanced MR relaxometry. Eur Radiol 26:1125–1133.
[2] Yoon JH, Lee JM, Kim E, Okuaki T, Han JK (2017), Quantitative liver function analysis: volumetric T1 mapping with fast multisection B1 inhomogeneity correction in hepatocyte-specific contrast-enhanced liver MR imaging. Radiology 282:408–417.
[3] Kamimura K, Fukukura Y, Yoneyama T, et al. Quantitative evaluation of liver function with T1 relaxation time index on Gd-EOB-DTPA-enhanced MRI: comparison with signal intensity-based indices. J Magn Reson Imaging. 2014;40(4):884-889.
[4] Li J, Cao B, Bi X, et al. Evaluation of liver function in patients with chronic hepatitis B using Gd-EOB-DTPA-enhanced T1 mapping at different acquisition time points: a feasibility study. Radiol Med. 2021;126(9):1149-1158.
[5] Ma B, Xu H, Wu X, et al. Evaluation of liver function using Gd-EOB-DTPA-enhanced MRI with T1 mapping. BMC Med Imaging. 2023;23(1):73.
Figures