3111
Dynamic quantitative susceptibility mapping to measure cardiac pulsation and respiration induced endogenous brain signal changes1Biomedical Engineering, University of Arizona, Tucson, AZ, United States, 2Department of Radiology and Imaging Sciences, Indiana University School of Medicine, Indianapolis, IN, United States
Synopsis
Keywords: Data Processing, Quantitative Susceptibility mapping, Brain
Motivation: The contribution of physiologically induced dynamic magnetic susceptibility within the brain to the blood oxygen level dependent (BOLD) signal used for functional imaging has never been quantified.
Goal(s): Our goal was to measure the brain’s dynamic magnetic susceptibility signal as a function of the cardiac and respiratory cycles using quantitative susceptibility mapping (QSM).
Approach: We developed and evaluated an image processing framework to generate dynamic susceptibility maps over the course of cardiac pulsation and respiration.
Results: We demonstrated that QSM is sensitive to physiologically induced susceptibility changes and that our framework can be used to measure these dynamics.
Impact: The influence of physiologically induced dynamic magnetic susceptibility on BOLD signal could impact the derivation/interpretation of BOLD-based functional connectivity. Significant susceptibility changes could indicate a need to modify existing functional mapping approaches whereas the reverse would validate current techniques.
Introduction
Quantitative susceptibility mapping (QSM) is a magnetic resonance imaging (MRI) post-processing technique that uses the image phase to map the susceptibility distribution due to biological sources of various anatomic structures. QSM has extensively been used to image iron accumulation in the brain1,2 and has been applied to measure cerebral venous oxygen saturation3,4,5. QSM is largely used as a static measure of the brain since typical acquisition sequences, such as gradient echo (GRE), are slow and thus yield time-averaged signal. However, with the advent of rapid imaging sequences, such as echo planar imaging (EPI), QSM has been shown to be sensitive to blood hemodynamics via its application to functional imaging6,7,8. This suggests that QSM can be used to investigate dynamic signal sources within the brain, but existing dynamic QSM protocols are not designed to extract information that is specific to physiological waveforms, such as cardiac pulsation and breathing.To advance QSM from a static to a dynamic imaging technique and investigate the sensitivity of QSM to physiological processes in the brain, we developed a novel image processing framework to retrospectively align EPI phase to physiological waveforms, such as the cardiac and breathing cycles. We applied our pipeline to generate susceptibility maps at multiple stages of the cardiac cycle. Additionally, we investigated the susceptibility changes due to two breathing conditions (free breathing vs. breath holds). Our preliminary results show that both QSM applications are sensitive to physiological dynamics, making our developed physiological waveform aligned dynamic QSM a promising technique for interrogating brain dynamics.
Methods
We performed two separate experiments to investigate the dynamic susceptibility signal induced by the cardiac and respiratory cycles respectively.All data were acquired on a Siemens 3T scanner using a commercial 32 channel head array coil on a single healthy subject (N=1). Whole-brain T2*-weighted data were collected using a ME EPI fMRI sequence9 with the following parameters: resolution = 1.94 x 1.94 x 1.80 mm3, matrix size = 124 x 124, 84 axial slices, TR = 6810 ms, TEs = 12, 31.61, 51.22 ms, single band, partial Fourier encoding, parallel imaging factor = 2. Respectively, 40 volumes (5 min) and 30 volumes (4 min) were acquired for the cardiac and respiratory experiments. The cardiac cycle was recorded using an MR-compatible pulse oximeter. For the respiratory experiment, the subject was directed to free breathe for 1 min, hold breath for 1 min, and free breathe for 2 min.
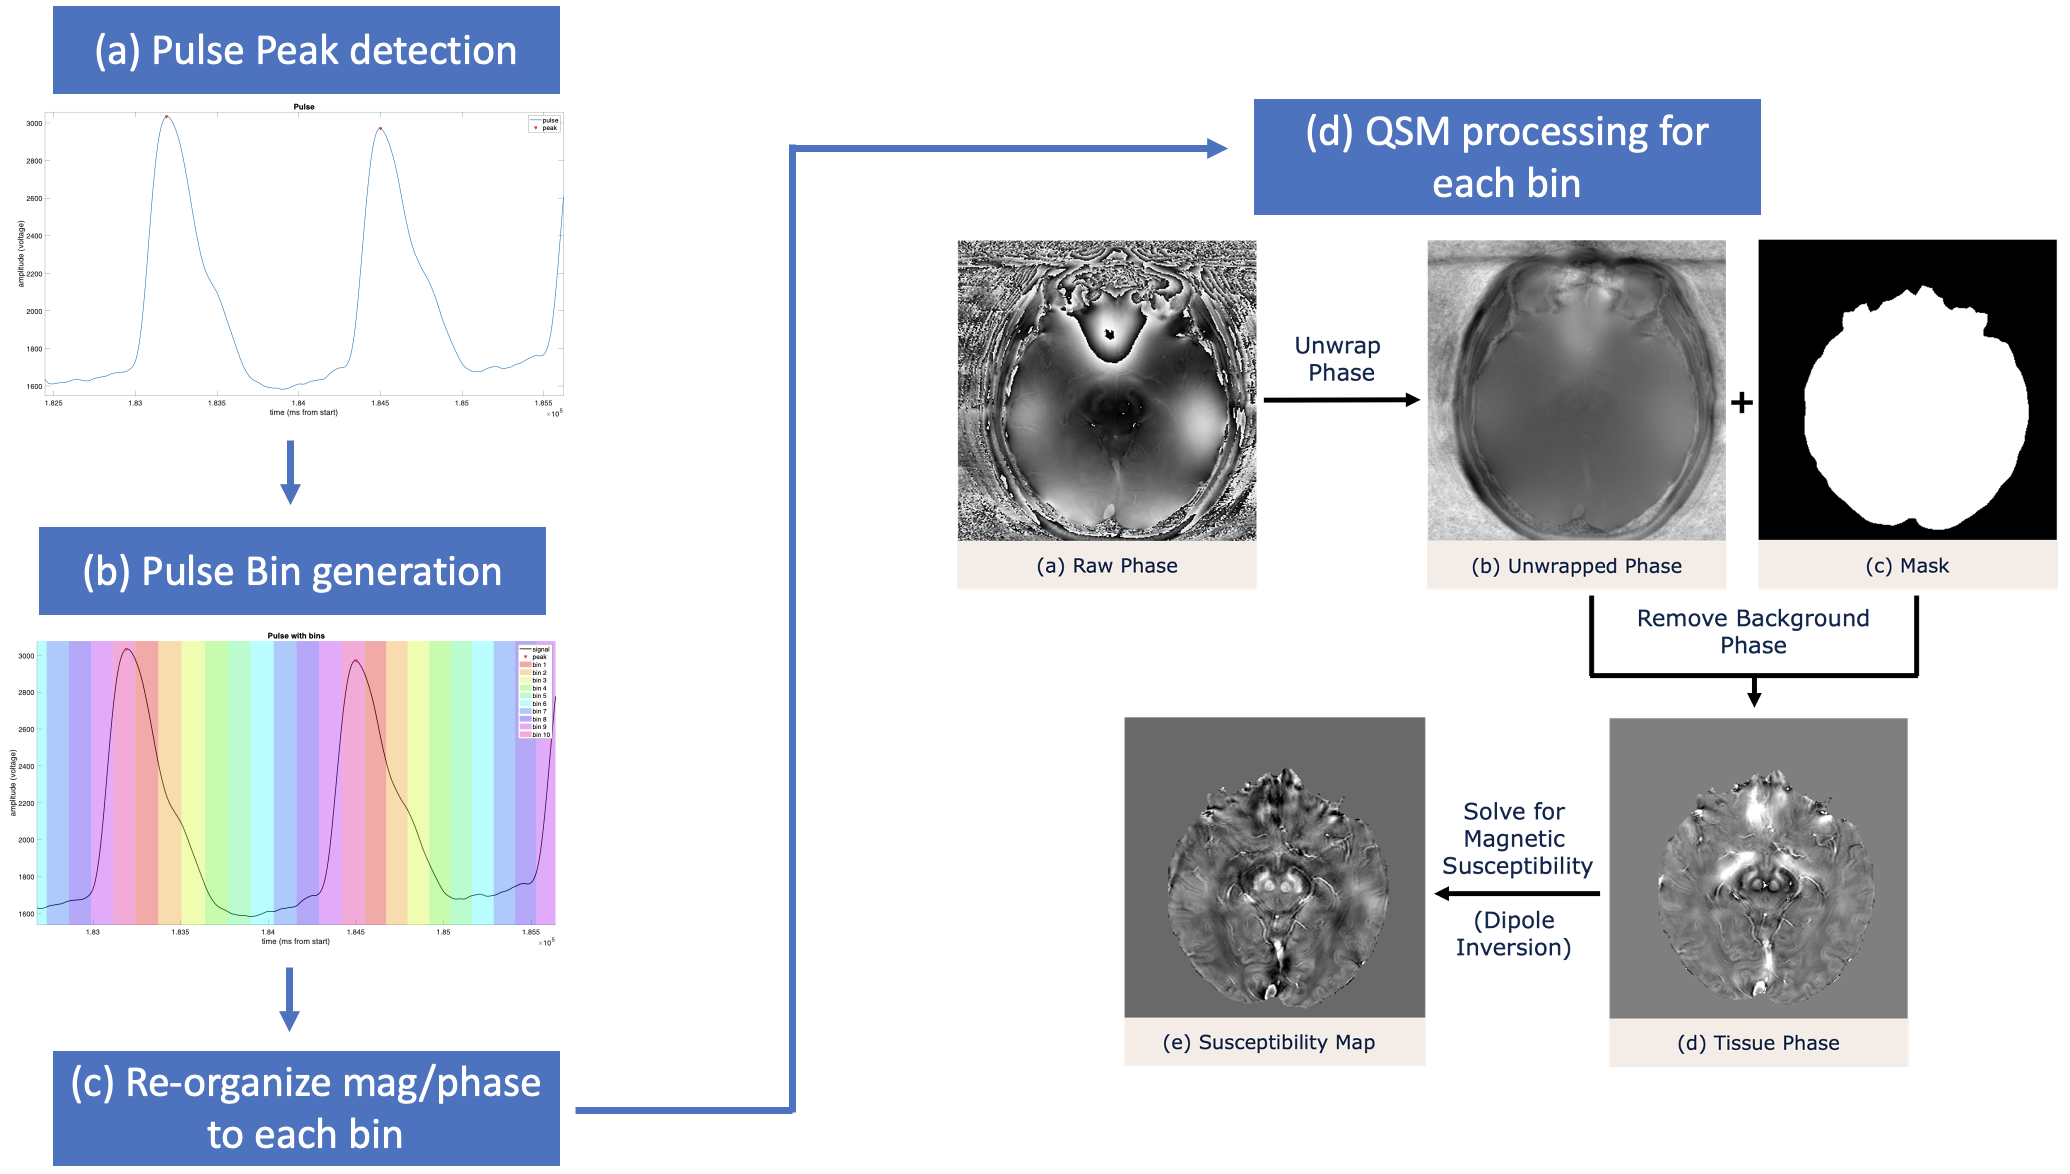
Susceptibility maps at 10 segments (bins) of the cardiac cycle were generated from our novel processing framework (Fig. 1). QSM was performed on each echo time (TE) for each volume separately by performing Laplacian phase unwrapping, V-SHARP background field removal and STAR QSM via STISuite10. Susceptibility maps for each breathing condition (free breathing segment 1, breath hold, and free breathing segment 2) were generated for each TE of each image volume individually using STISuite10.
Results & Discussion
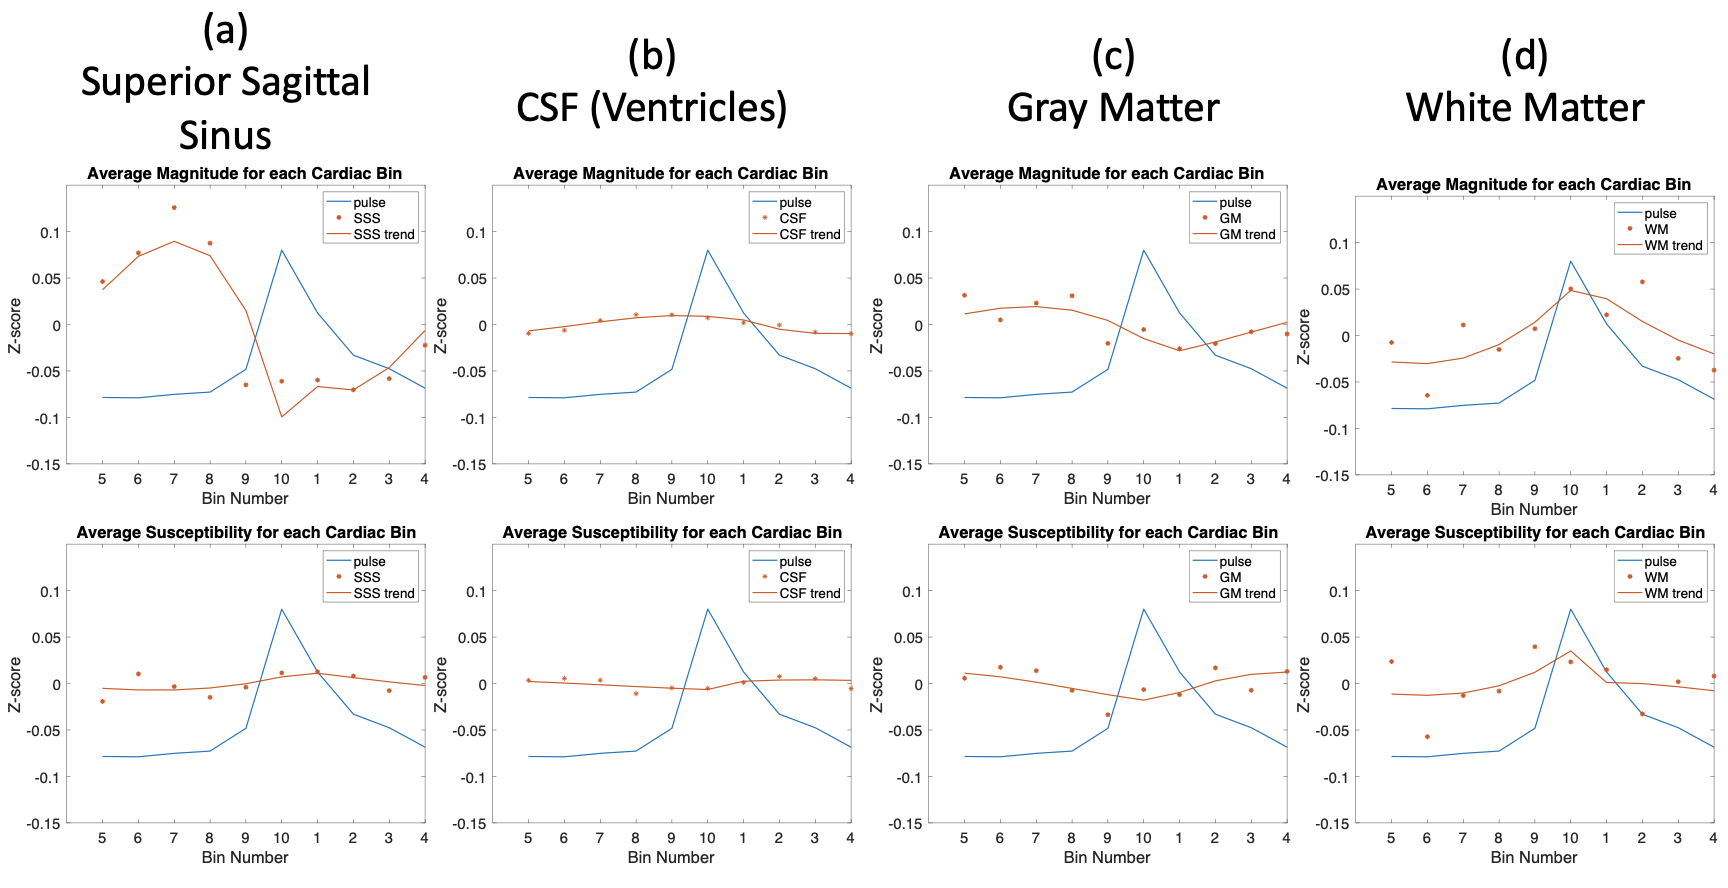
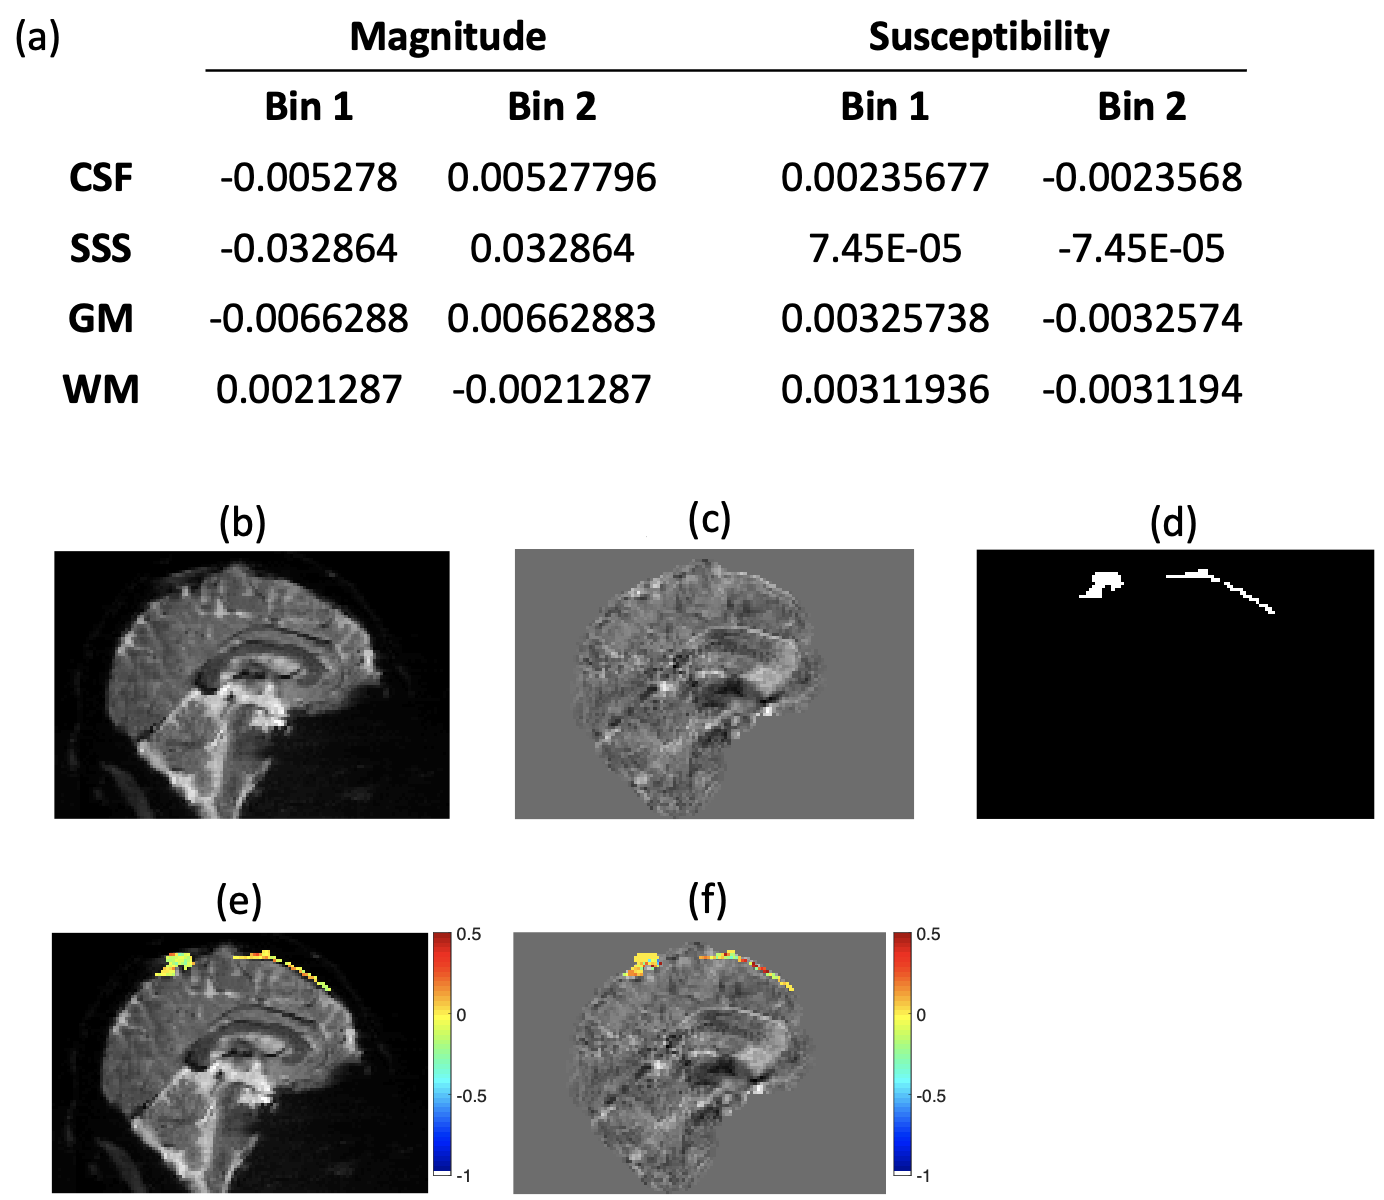
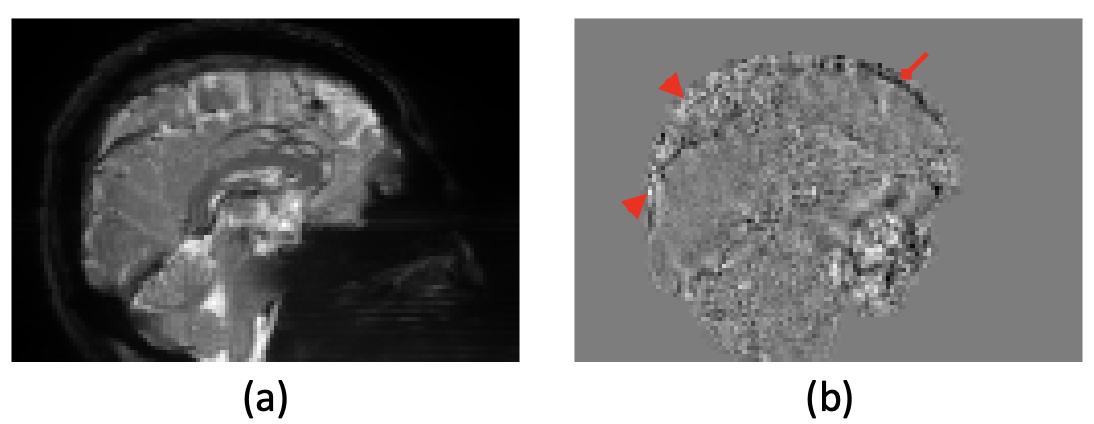
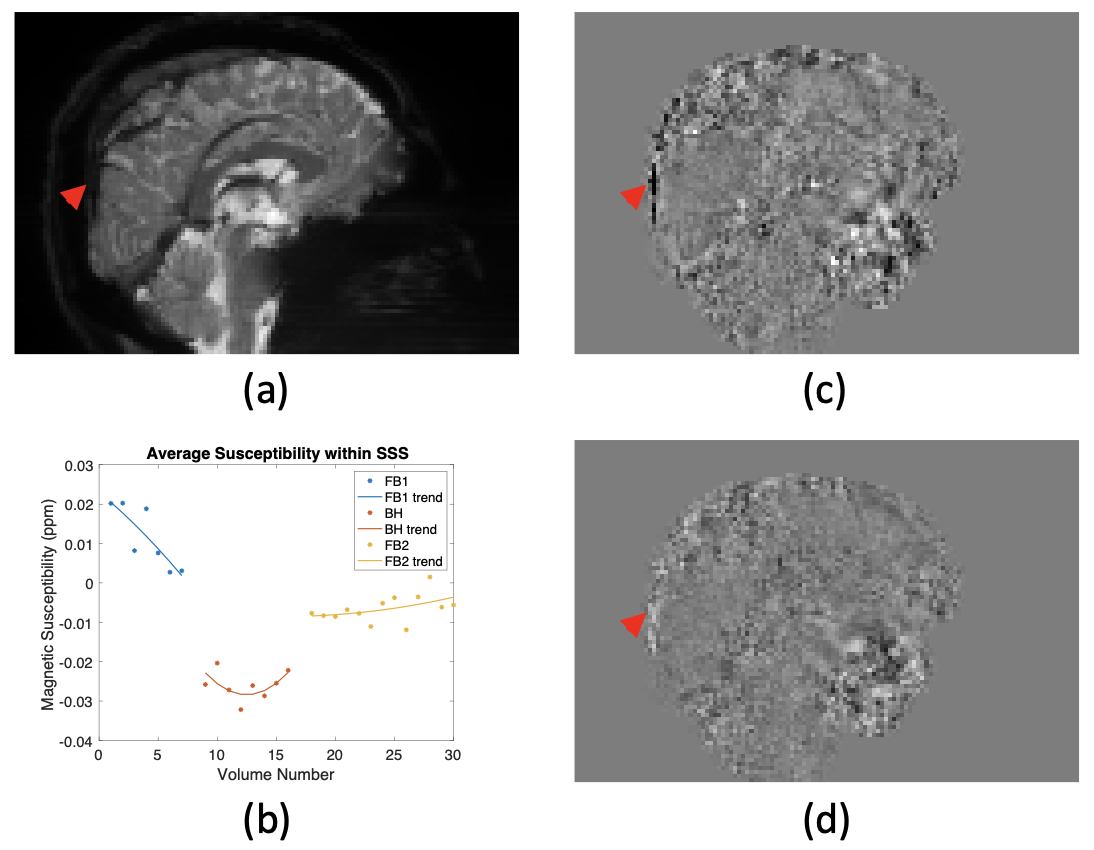
We observed susceptibility changes as a function of the cardiac cycle. While the susceptibility changes in the superior sagittal sinus (SSS) across 10 bins were smaller than expected when compared to the magnitude changes (Fig. 2), clear susceptibility changes are seen after the 10 bins are averaged down to 2 (Fig. 3). These susceptibility changes occur in the opposite direction of the magnitude changes, which is expected since a decrease in magnitude signal due to deoxyhemoglobin would result in an increase in susceptibility. These results suggest that fewer bins or more image volumes are required to improve this technique’s sensitivity to the veins.We additionally observed susceptibility changes within the SSS between free breathing and breath holding. Fig. 4 shows that the susceptibility both increased and decreased during breath holding in different regions of the SSS but also decreased in others. Fig. 5 demonstrates that there are distinct changes within the SSS across the three breathing segments – susceptibility decreased during breath hold and then increased once free breathing resumed. Our results demonstrate that respiratory-induced susceptibility changes are localized to the SSS, meaning that QSM is both sensitive to the changes in respiration and specific to the blood signal, which is directly impacted by different breathing conditions.
Conclusion
While further analysis is required to fully understand the observed susceptibility changes, we have preliminarily demonstrated that QSM is sensitive to cardiac and respiratory-related brain dynamics, and that our physiological waveform aligned dynamic QSM framework can measure these signals.Acknowledgements
This work was supported by the NIH (U19-AG065169 and R01 NS102220).References
1. Barbosa, J. H., Santos, A. C., Tumas, V., Liu, M., Zheng, W., Haacke, E. M., & Salmon, C. E. (2015). Quantifying brain iron deposition in patients with Parkinson's disease using quantitative susceptibility mapping, R2 and R2. Magn Reson Imaging, 33(5), 559-565. https://doi.org/10.1016/j.mri.2015.02.021
2. Ravanfar, P., Loi, S. M., Syeda, W. T., Van Rheenen, T. E., Bush, A. I., Desmond, P., Cropley, V. L., Lane, D. J. R., Opazo, C. M., Moffat, B. A., Velakoulis, D., & Pantelis, C. (2021). Systematic Review: Quantitative Susceptibility Mapping (QSM) of Brain Iron Profile in Neurodegenerative Diseases. Front Neurosci, 15, 618435. https:// doi.org/10.3389/fnins.2021.618435
3. Fan, A. P., Bilgic, B., Gagnon, L., Witzel, T., Bhat, H., Rosen, B. R., & Adalsteinsson, E. (2014). Quantitative oxygenation venography from MRI phase. Magn Reson Med, 72(1), 149-159. https://doi.org/10.1002/mrm.24918
4. Yadav, B. K., Buch, S., Krishnamurthy, U., Jella, P., Hernandez-Andrade, E., Trifan, A., Yeo, L., Hassan, S. S., Mark Haacke, E., Romero, R., & Neelavalli, J. (2019). Quantitative susceptibility mapping in the human fetus to measure blood oxygenation in the superior sagittal sinus. Eur Radiol, 29(4), 2017-2026. https://doi.org/10.1007/s00330-018-5735-1
5. Xu, B., Liu, T., Spincemaille, P., Prince, M., & Wang, Y. (2014). Flow compensated quantitative susceptibility mapping for venous oxygenation imaging. Magn Reson Med, 72(2), 438-445. https://doi.org/10.1002/mrm.24937
6. Balla, D. Z., Sanchez-Panchuelo, R. M., Wharton, S. J., Hagberg, G. E., Scheffler, K., Francis, S. T., & Bowtell, R. (2014). Functional quantitative susceptibility mapping (fQSM). Neuroimage, 100, 112-124. https://doi.org/10.1016/j.neuroimage.2014.06.011
7. Lancione, M., Costagli, M., Handjaras, G., Tosetti, M., Ricciardi, E., Pietrini, P., & Cecchetti, L. (2021). Complementing canonical fMRI with functional Quantitative Susceptibility Mapping (fQSM) in modern neuroimaging research. Neuroimage, 244, 118574. https://doi.org/10.1016/j.neuroimage.2021.118574
8. Sun, H., Seres, P., & Wilman, A. H. (2017). Structural and functional quantitative susceptibility mapping from standard fMRI studies. NMR Biomed, 30(4). https://doi.org/10.1002/nbm.3619
9. Xu J., Moeller S., Auerbach E.J., Strupp J., Smith S.M., Feinberg D.A., Yacoub E., Uğurbil K. Evaluation of slice accelerations using multiband echo planar imaging at 3 T. Neuroimage. 2013;83(0):991-1001.
10. Li, W., Wu, B., & Liu, C. (2013). STI Suite: a Software Package for Quantitative Susceptibility Imaging.
Figures