3110
Toward Optimal MRI Utilization: How Waste and Slack Turn Into Potential1Department of Medical Physics, University of Wisconsin-Madison, Madison, WI, United States, 2Department of Radiology, University of Wisconsin-Madison, Madison, WI, United States, 3Department of Emergency Medicine, University of Wisconsin-Madison, Madison, WI, United States, 4Department of Biomedical Engineering, University of Wisconsin-Madison, Madison, WI, United States, 5Department of Medicine, University of Wisconsin-Madison, Madison, WI, United States
Synopsis
Keywords: Data Processing, MR Value
Motivation: There are no standard metrics to measure clinical MRI utilization. This gap contributes to a lack of best practices for MRI utilization optimization.
Goal(s): (1)Identify and standardize metrics relevant to MRI workflow; (2)demonstrate the use of these metrics to quantify MRI utilization; (3)identify opportunities for improvement in efficiency in a clinical MRI practice.
Approach: Timepoint and summary metrics were defined to characterize MRI workflow. Data from two MRI facilities were analyzed using these metrics to characterize MRI utilization.
Results: The defined standard set of metrics quantified MRI utilization and identified workflow areas that could be further optimized to improve MRI utilization.
Impact: It is currently difficult to communicate key timepoint metrics that characterize the utilization of clinical MRI exams. The development of standardized language to characterize MR exam timepoint metrics can facilitate best practices for workflow improvement. Such tools are essential to improve the value of MR.
Introduction
Rapid growth of MRI volumes testifies to its increasing role in guiding patient care1 but has also generated a critical need for more efficient and effective utilization of MRI equipment2–4. Optimizing MRI operations requires identification and an accurate measure of current deficiencies and inefficiencies. Unfortunately, absence of universally accepted metrics that characterize exam utilization contributes to a lack of evidence on best practices for optimal MRI utilization. The purpose of this work is to identify and standardize relevant metrics that characterize MRI workflow, demonstrate the use of these metrics to quantify MRI utilization, and identify opportunities for efficiency improvement in clinical MRI practice.Methods
Figure 1 outlines a typical MRI scanner workflow. Per-exam timepoint metrics were defined, focused on scanner room utilization. Two broad timepoint metrics were exam time and cold table time. Exam time is the time between first and last image acquisitions in an MRI exam; it is further divided into acquisition time (total image acquisition time) and idle time (total time spent on non-image acquisition tasks). Cold table time (time outside of exam time) is the interval between last image acquisition for one patient and the first image acquisition for the subsequent patient. Cold table time is subdivided into:- Prep time: interval between patient entering the scanner room and first image acquisition.
- Recovery time: interval between last image acquisition and patient leaving the scanner room.
- Vacant time: interval between one patient leaving and the subsequent patient entering the scanner room. Vacant time consists of time needed for necessary tasks (reset time) and when the room is completely empty only awaiting the next patient (down time).
$$\text{efficiency}=\frac{\Sigma{\text{acquisition time}}}{\text{operation time}}(\%)$$
$$\text{slack}=\frac{\Sigma{\text{idle time}}}{\text{operation time}}(\%)$$
$$\text{usage}=\frac{\Sigma{\text{exam time}}}{\text{operation time}}(\%)=\text{efficiency+slack}$$
$$\text{waste}=\frac{\Sigma{\text{cold table time}}}{\text{operation time}}(\%)=100\%-\text{usage}$$
$$\text{vacancy}=\frac{\Sigma{\text{vacant time}}}{\text{operation time}}(\%)$$
$$\text{potential}=\text{slack+waste}(\%)$$
To assess metrics performance, data were collected on all MRI exams from October 2022–September 2023 from two facilities, identified through electronic health records using a data analysis module (Clarity, Epic). DICOM metadata were extracted from the Picture Archiving and Communication System using same-vendor DICOMweb (Change Healthcare). Secondary image captures, reformatted images, and cancelled exams without images were excluded. Start time and acquired pulse sequence duration were used to calculate exam-, acquisition-, and idle times. Cold table time was calculated through exam time minus operation time. Usage, efficiency, slack, and waste were calculated and averaged across the study period. Prep-, recovery-, and vacant times (and subsequently vacancy) could not be calculated due to lack of data on patient location outside exam time.
Results
13,337 exams from Facility 1 (outpatient only, four scanners) and 9,197 exams were from Facility 2 (hybrid inpatient and outpatient, two scanners) were included. Usage (efficiency) for Facility 1 and 2 were respectively 58%(39%) and 50%(31%). While some scanners demonstrated similar patterns of utilization (e.g., MR5,MR6), others demonstrated key differences; e.g., MR2 demonstrated the highest usage. However, this higher utilization did not entirely translate into higher efficiency, as slack was also highest for MR2 (Table 1). Figure 2 summarizes the contribution of slack and waste to the overall potential.Discussion and Conclusion
We conceptualized utilizing standardized metrics to identify areas of inefficiency in MRI workflow to guide improving utilization. We propose efficiency as the most accurate positive measure of MRI utilization, as it most closely measures active image acquisition. We also identified that the majority of operating time falls within the potential category. Knowledge of higher-than-anticipated slack can facilitate investment in initiatives that shorten idle time (e.g., technologist education). Conversely, a lack of knowledge on subcomponents of cold table time prohibits targeted solutions to address waste. For example, if down time was the major contributor to cold table time, then additional personnel and/or changes in scheduling may be effective. However, if prep- and recovery times are not the main contributors to cold table time, hiring additional personnel would (1) not address the issue and (2) add additional cost. Hence, knowledge of patient location within the MRI center at any given timepoint is an indispensable piece of data to better understand and minimize waste.This work has several limitations, including its preliminary nature, retrospective design, and lack of data to demonstrate impact on efficiency. However, it achieved its objective of demonstrating how standardized metrics can identify areas of inefficiency within an MRI practice, which is ultimately aimed to optimize MRI utilization. Future work on further validation and demonstration of meaningful impact is needed.
Acknowledgements
We wish to acknowledge support from GE Healthcare who provides research support to the University of Wisconsin. Dr. Reeder is the John. H Juhl Endowed Chair of Radiology.References
- Kordbacheh H, Baliyan V, Serrao J, et al. Imaging in Patients with Crohn’s Disease: Trends in Abdominal CT/MRI Utilization and Radiation Exposure Considerations over a 10-Year Period. Inflamm Bowel Dis. 2017;23(6):1025-1033. doi:10.1097/MIB.0000000000001088
- Improving MRI Access: A framework for optimizing MRI scheduling templates - ClinicalKey. Accessed February 24, 2023. https://www.clinicalkey.com/#!/content/playContent/1-s2.0-S193986542200368X?returnurl=https:%2F%2Flinkinghub.elsevier.com%2Fretrieve%2Fpii%2FS193986542200368X%3Fshowall%3Dtrue&referrer=https:%2F%2Fpubmed.ncbi.nlm.nih.gov%2F
- Nguyen XV, Ouhammou L, Khan N, Ajam Z, Ajam AA. Chapter 3 - Cost economy of motion. In: van der Kouwe AJW, Andre JB, eds. Advances in Magnetic Resonance Technology and Applications. Vol 6. Motion Correction in MR. Academic Press; 2022:25-34. doi:10.1016/B978-0-12-824460-9.00011-X
- Canellas R, Rosenkrantz AB, Taouli B, et al. Abbreviated MRI Protocols for the Abdomen. RadioGraphics. 2019;39(3):744-758. doi:10.1148/rg.2019180123
Figures
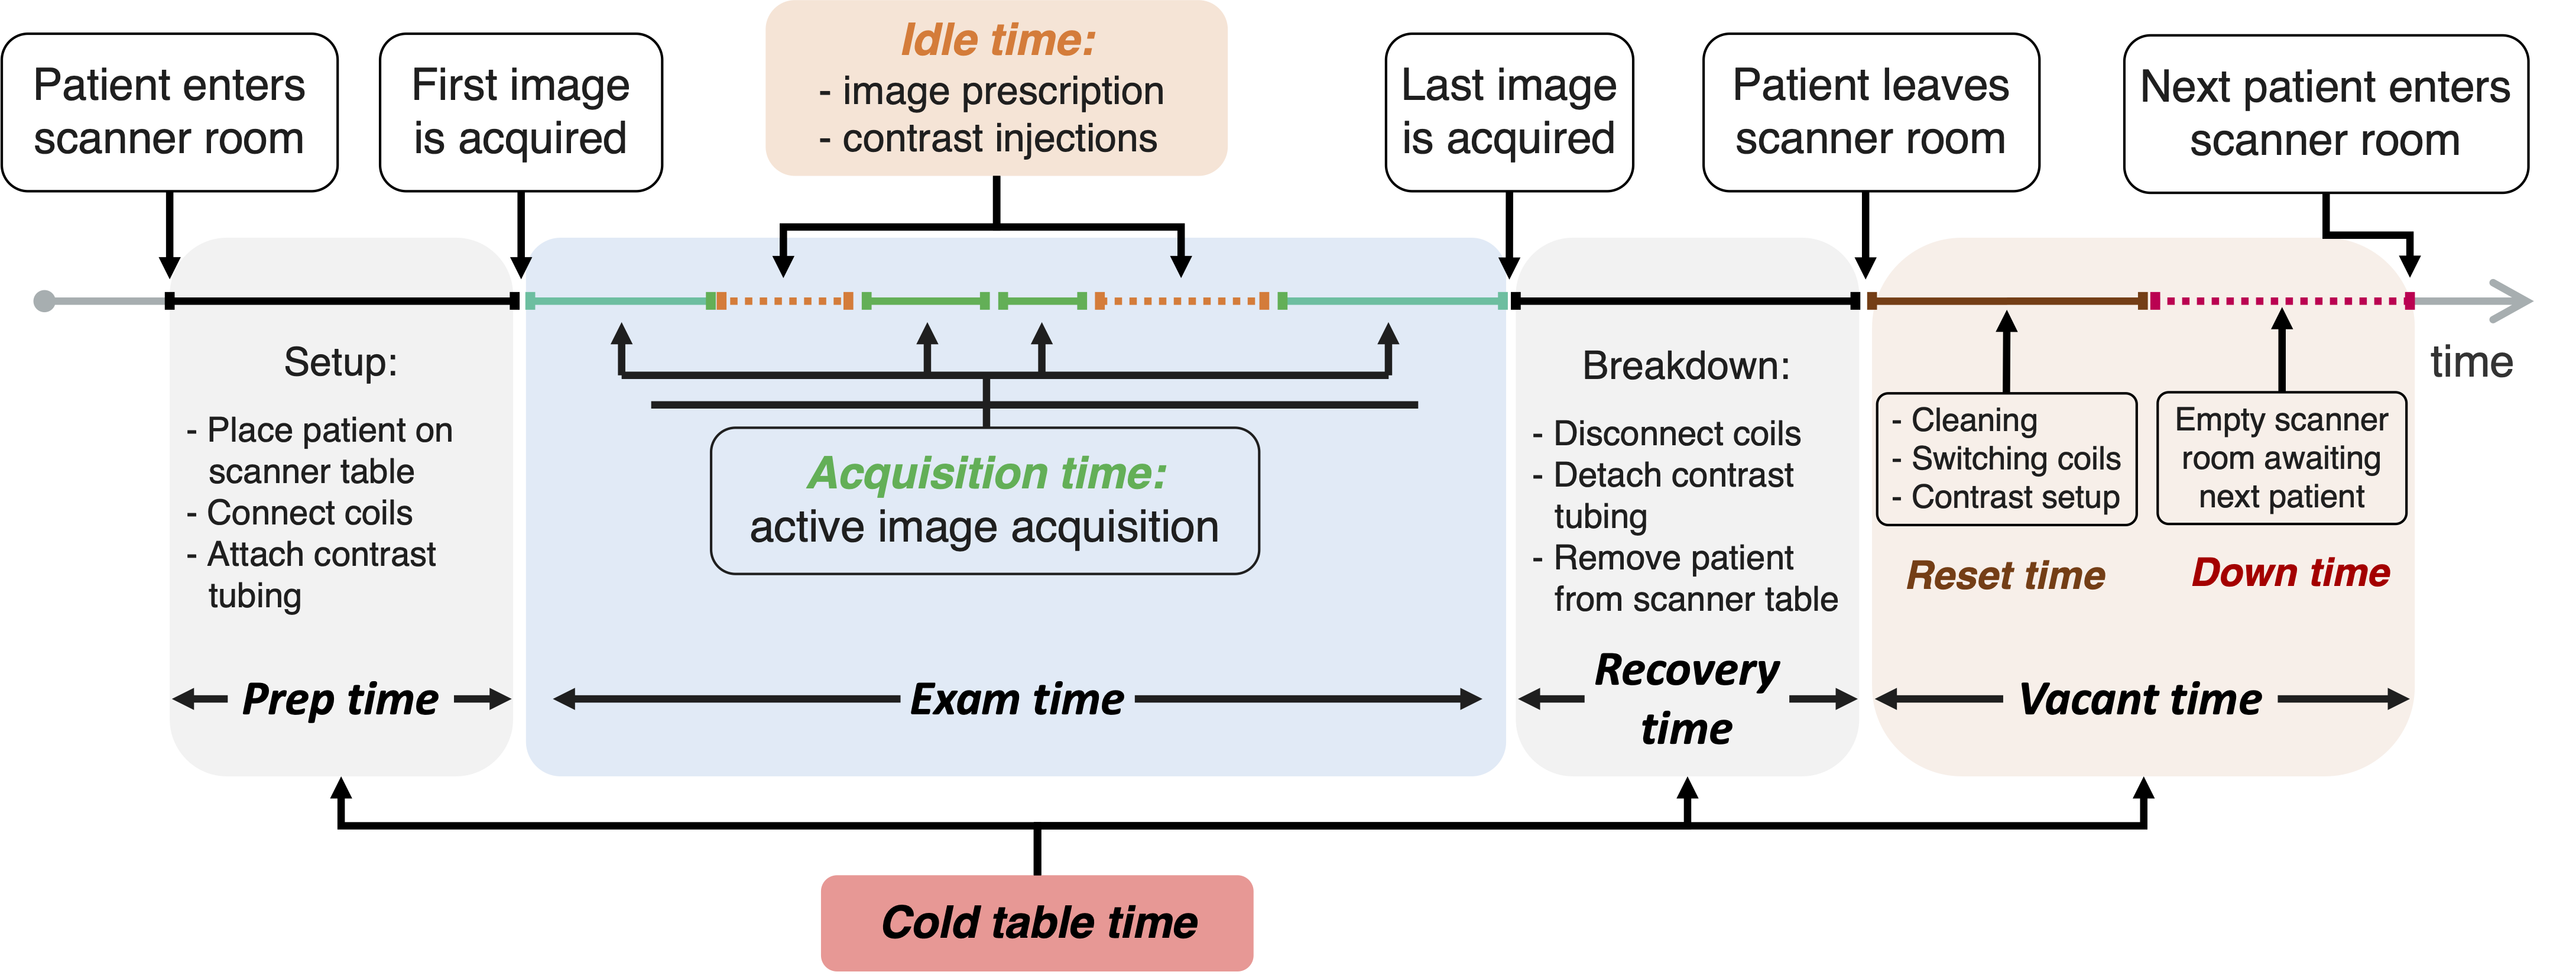
Figure 1: Representative timeline of typical MRI workflow with key timepoint metric definitions including: exam time = acquisition time + idle time, and cold table time = prep time + recovery time + vacant time.
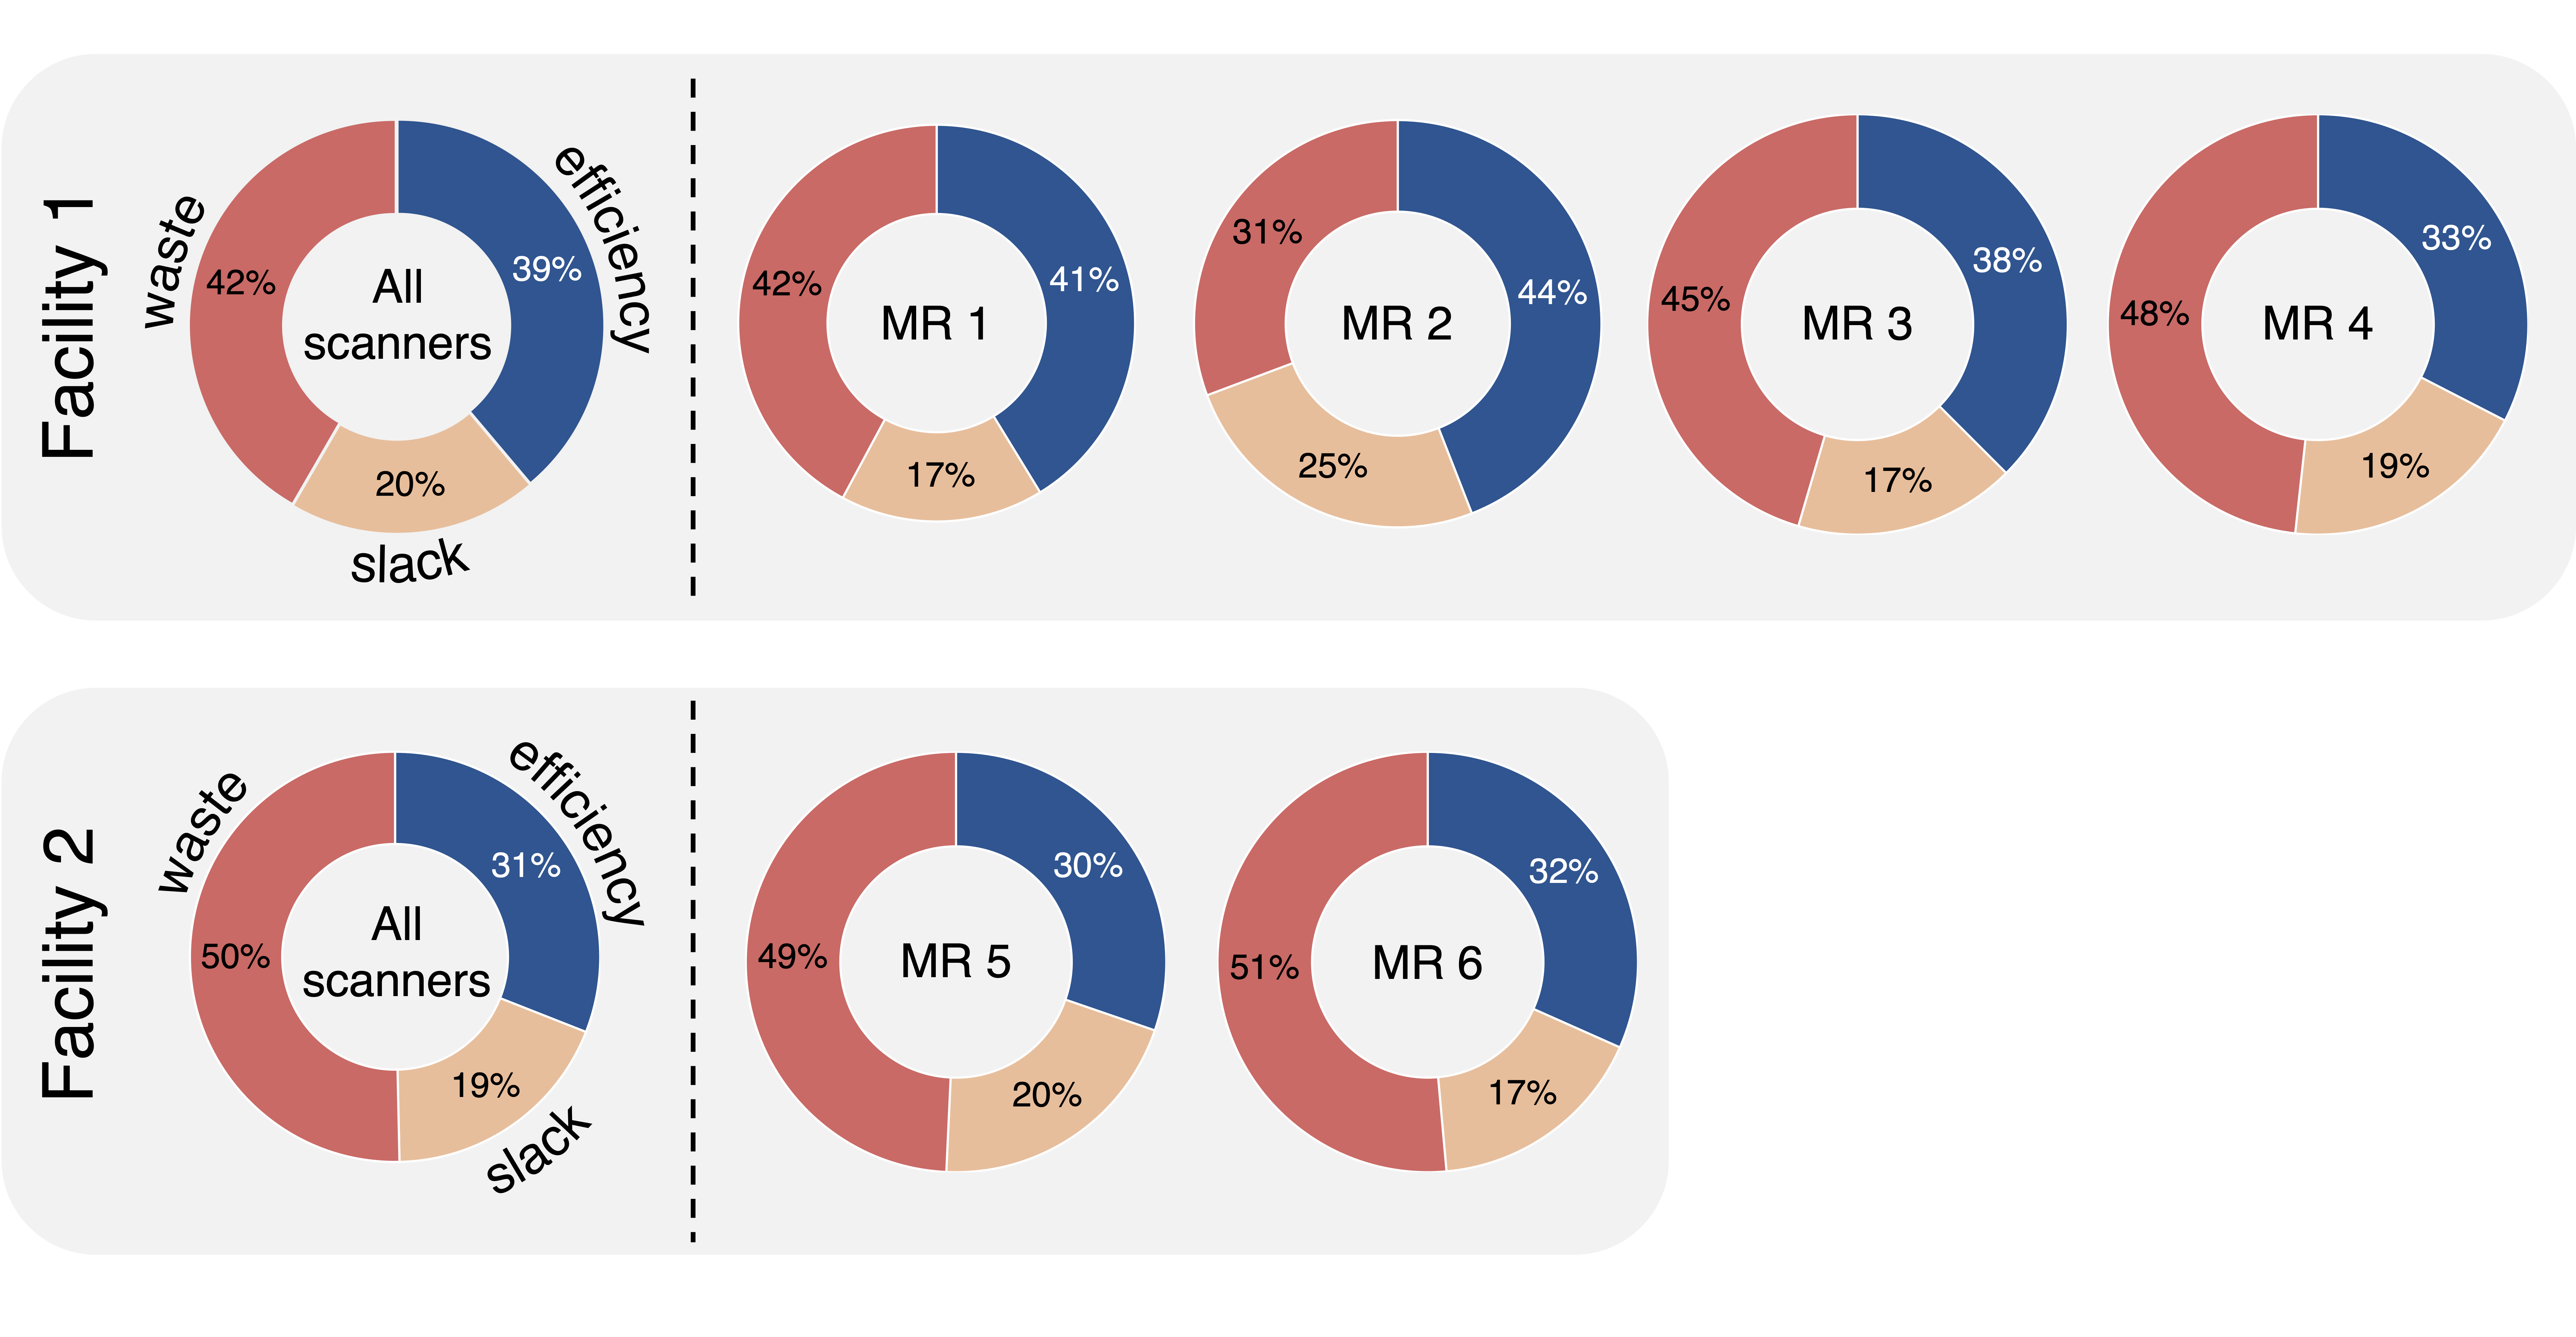
Figure 2: Visual representation of the proposed summary metrics including the contribution of slack and waste to the overall potential for facilities and individual scanners. However, the contribution of individual timepoint metrics that increase waste remain unknown (i.e., prep-, recovery-, and vacant time).
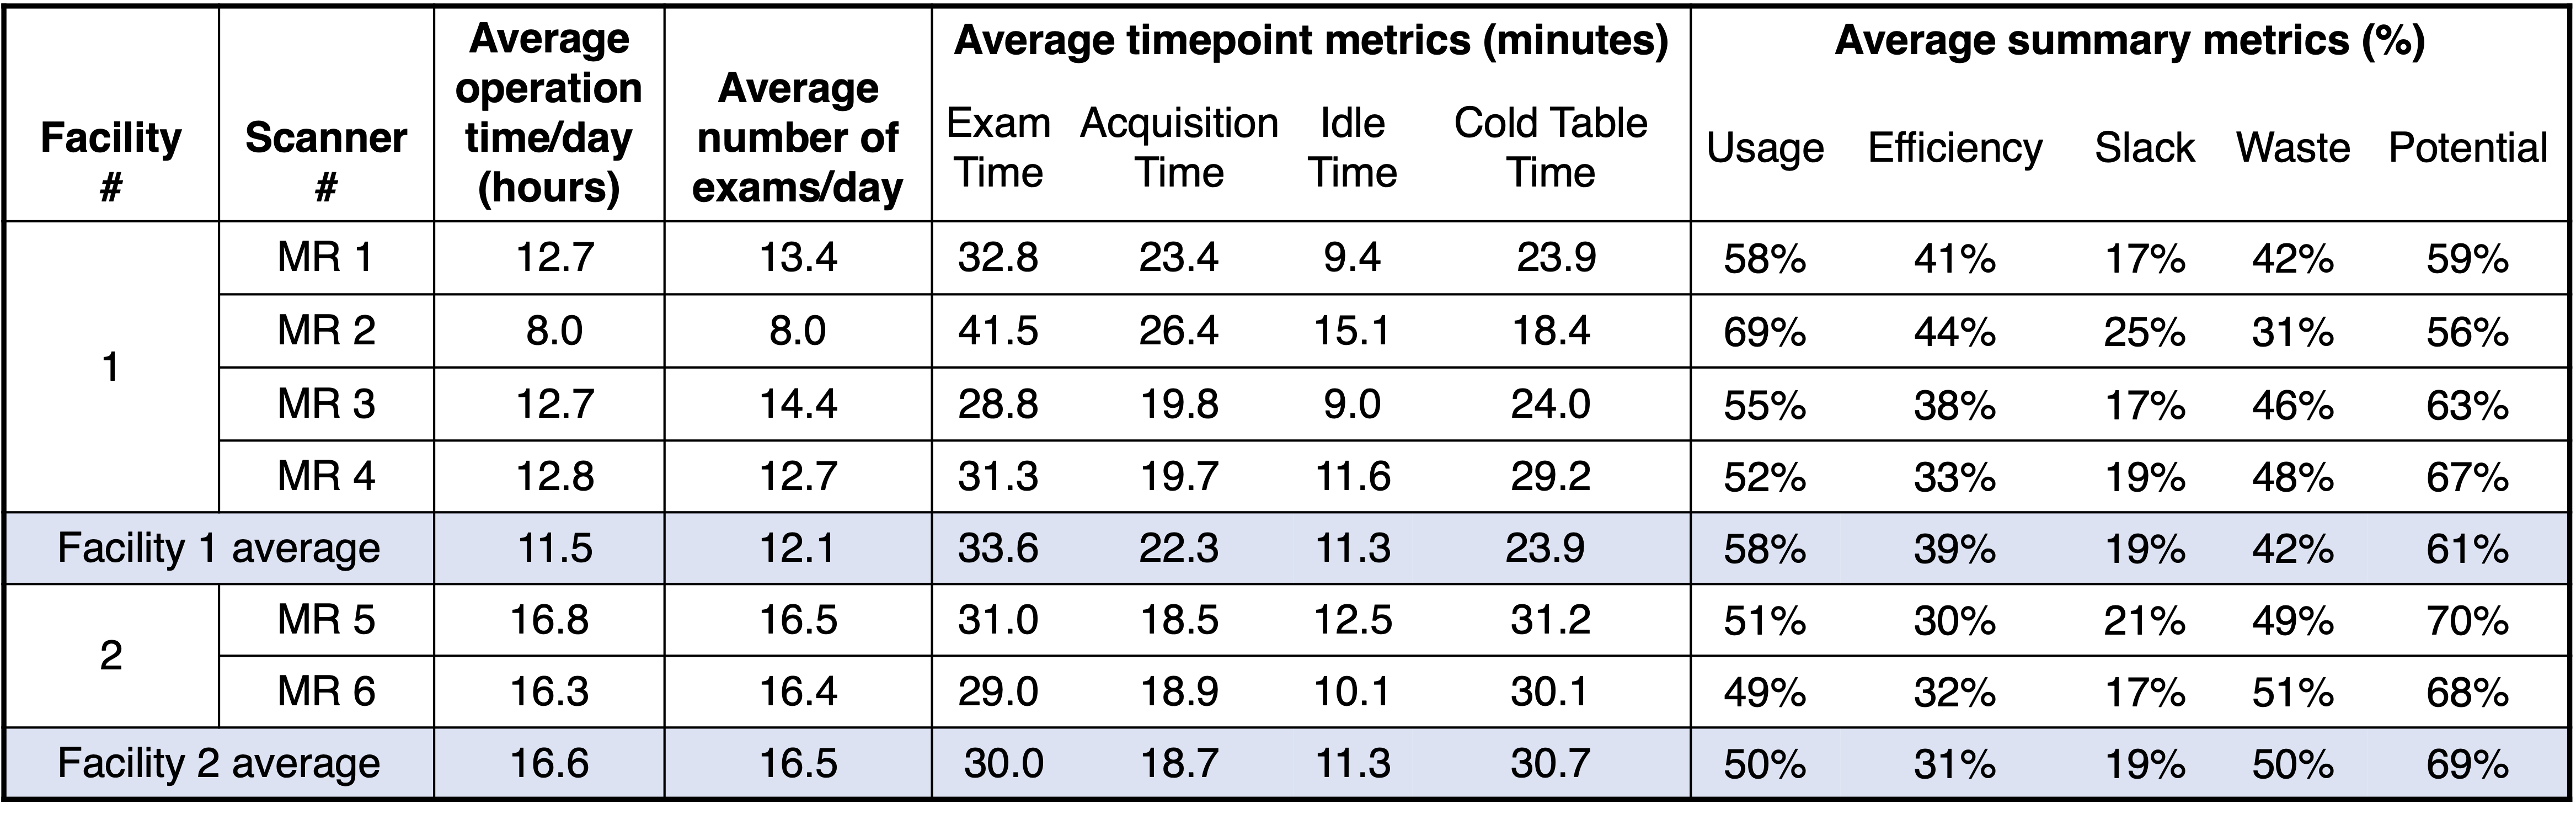
Table 1: Summary of study findings, demonstrating differences and similarities between per-scanner and per-facility timepoint and summary metrics across 6 MRI scanners at two MRI facilities, informing on different opportunities to improve efficiency.