3108
Dual-level image and feature augmentation approach for improving radiomics performance in multisequence MRI meningioma grading1The Chinese University of Hong Kong, Hong Kong, Hong Kong
Synopsis
Keywords: Radiomics, Cancer
Motivation: Prediction of high-grade meningioma on preoperative MRI is essential in therapeutic planning and evaluation of prognosis.
Goal(s): We seek to propose a data augmentation strategy to reduce class imbalance for model improvement.
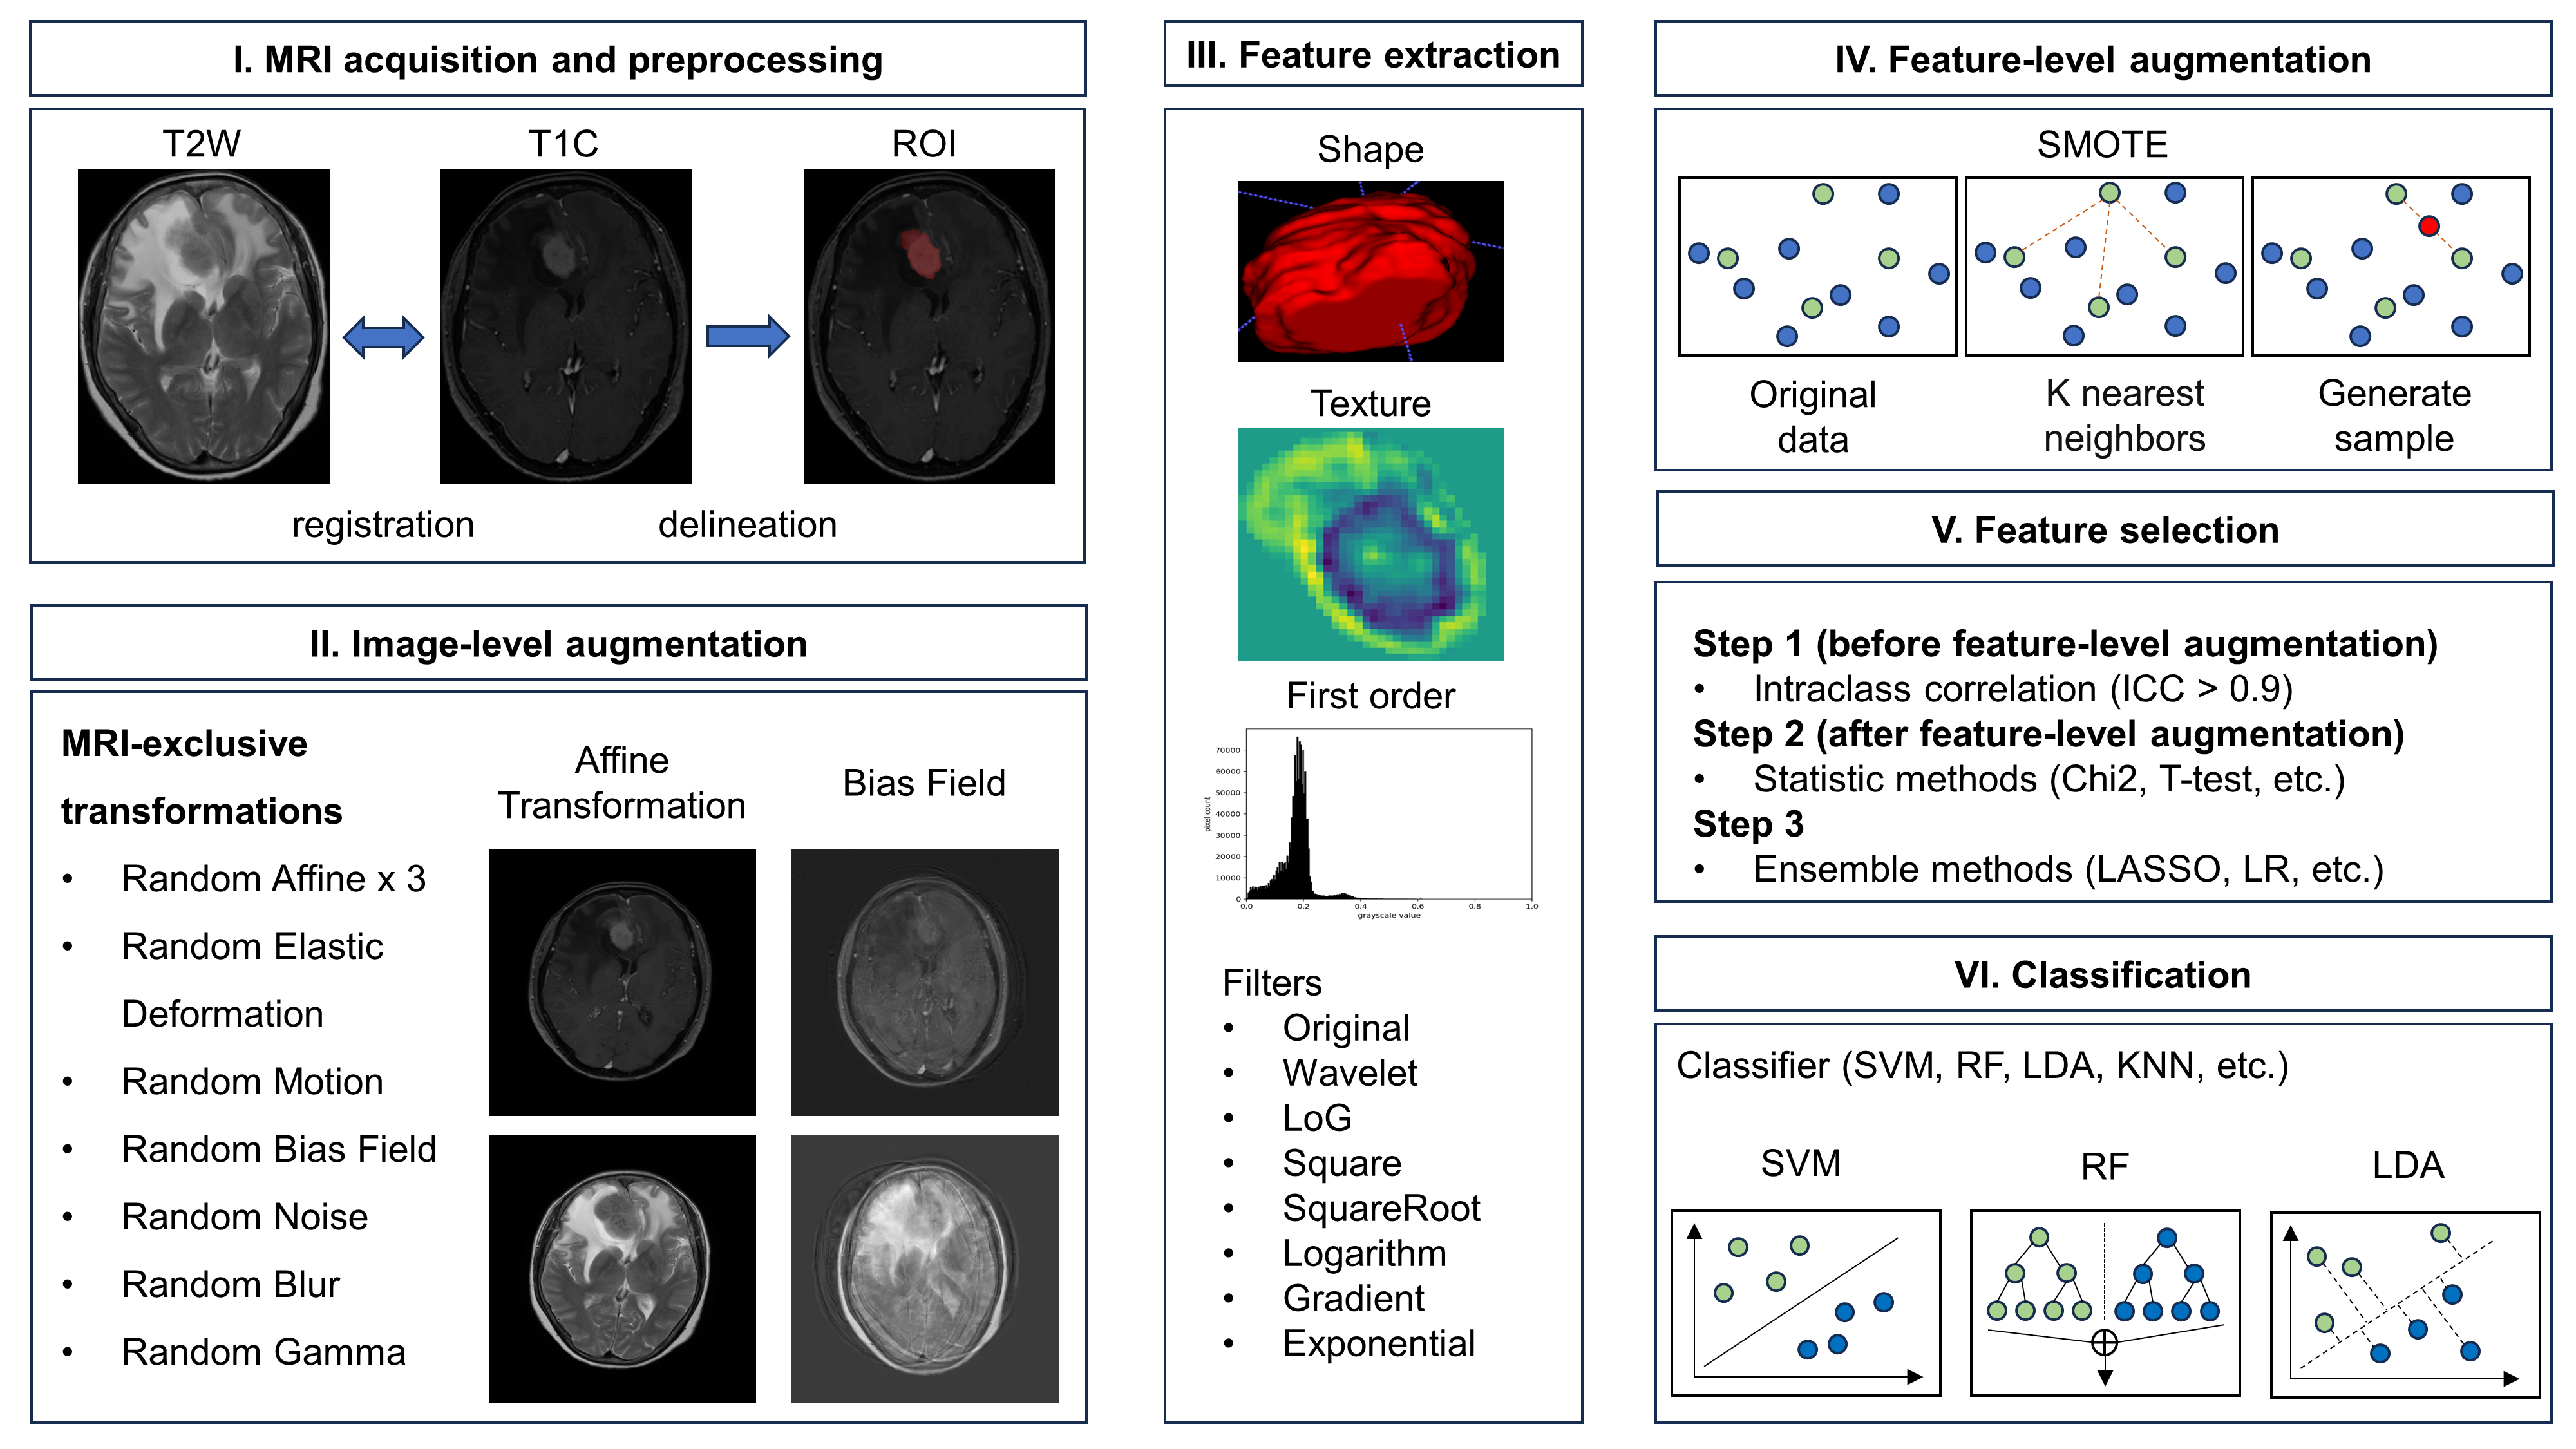
Approach: In this study, we propose a dual-level augmentation strategy incorporating image-level augmentation and feature-level augmentation to tackle class-imbalance and improve the predictive performance of radiomics for meningioma grading on multisequence MRI.
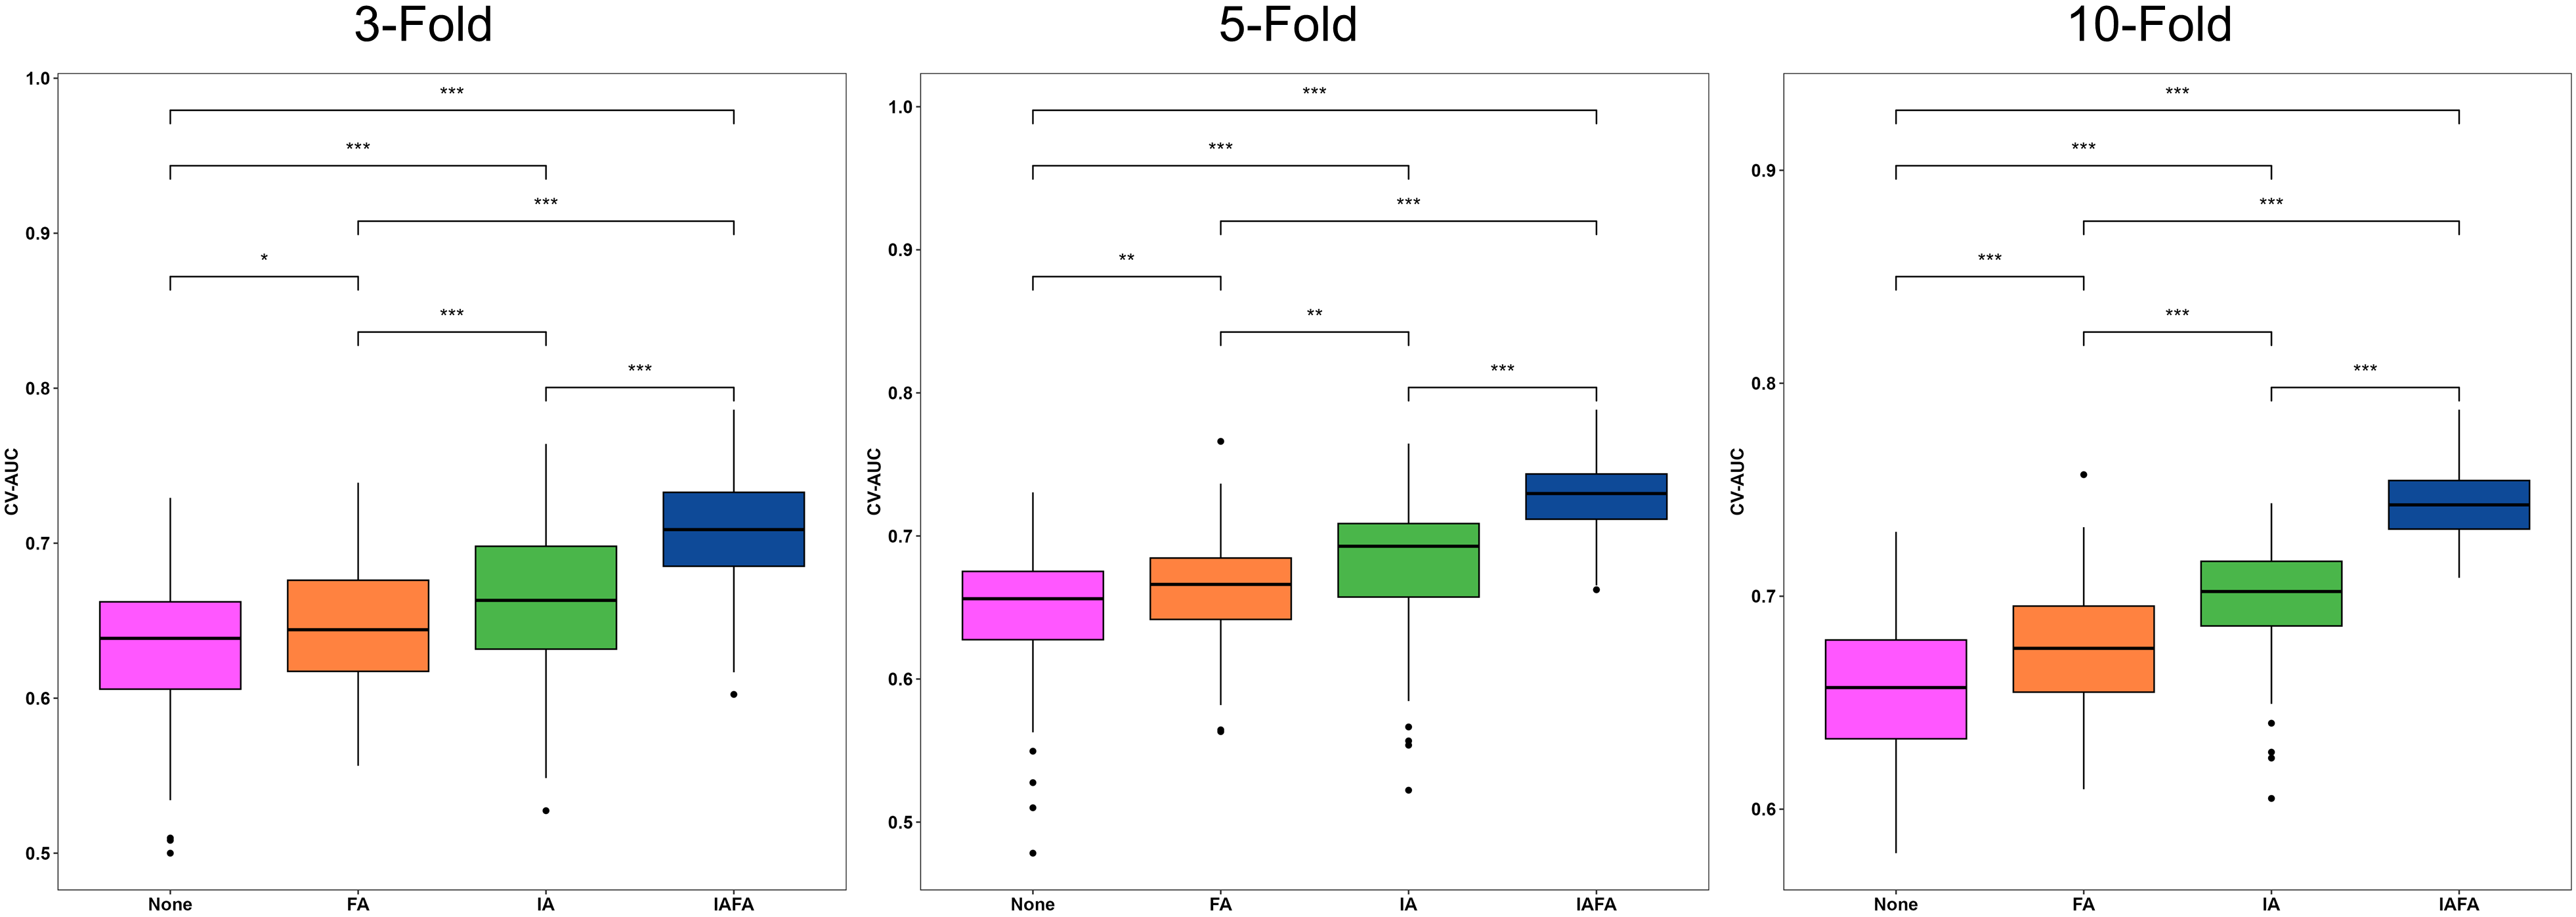
Results: The radiomics models yields robust performance in 100 repetitions in 3-, 5-, and 10-fold cross-validation. In addition, our method significantly outperformed single-level augmentation (image or feature) or no augmentation in each cross-validation.
Impact: As an effective and robust meningioma grading tool, our radiomics model has the potential to aid clinical decision making for a broader range of meningioma grades seen in practice, allowing for better radiomics-based pre-operative stratification and individualized patient management.
INTRODUCTION
Meningiomas are the most common primary brain tumors, accounting for approximately one third of all primary central nervous system tumors 1. While most meningiomas are WHO grade I tumors that can often be treated effectively with surgery alone, higher grade (WHO grade II and III) meningiomas tend to be more aggressive and have a poorer prognosis 2,3. Accurately differentiating between low and high grade meningiomas is important for determining the appropriate treatment approach and prognosis 4,5. However, current grading methods relying on histopathological examination of surgically resected tumors have limitations and radiological features on MRI are not always reliable indicators of tumor grade 6. Radiomics, which involves extracting large amounts of quantitative imaging features from medical images, has emerged as a promising non-invasive technique for tumor characterization and grading 7-9. However, radiomics models can be impacted by issues like class imbalance in training datasets, with most clinical datasets having a predominance of low-grade cases compared to rarer high-grade tumors 10-14. This imbalance can bias model performance, particularly for the minority class. The aim of this study was to develop and validate an effective radiomics model for meningioma grading using data augmentation techniques to address class imbalance issues.METHODS
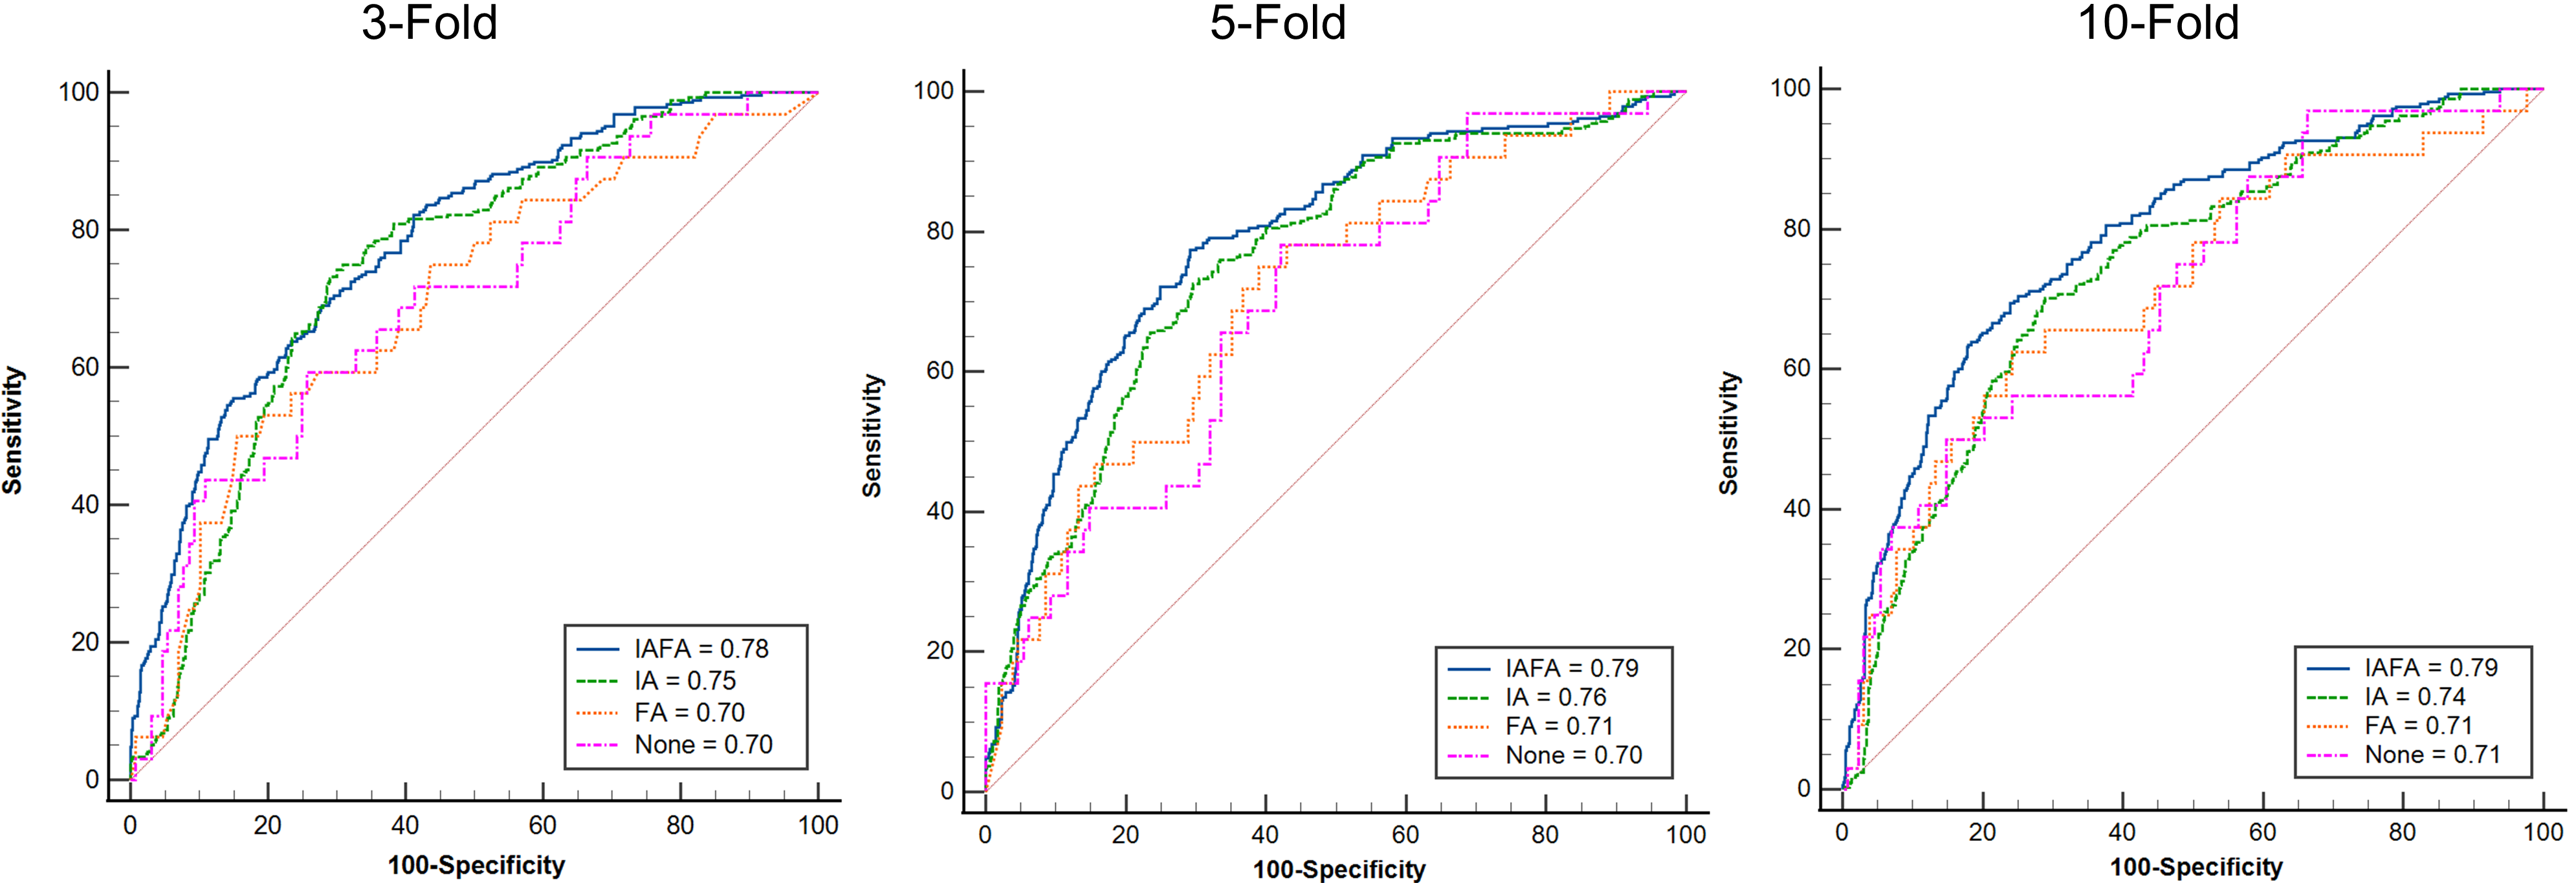
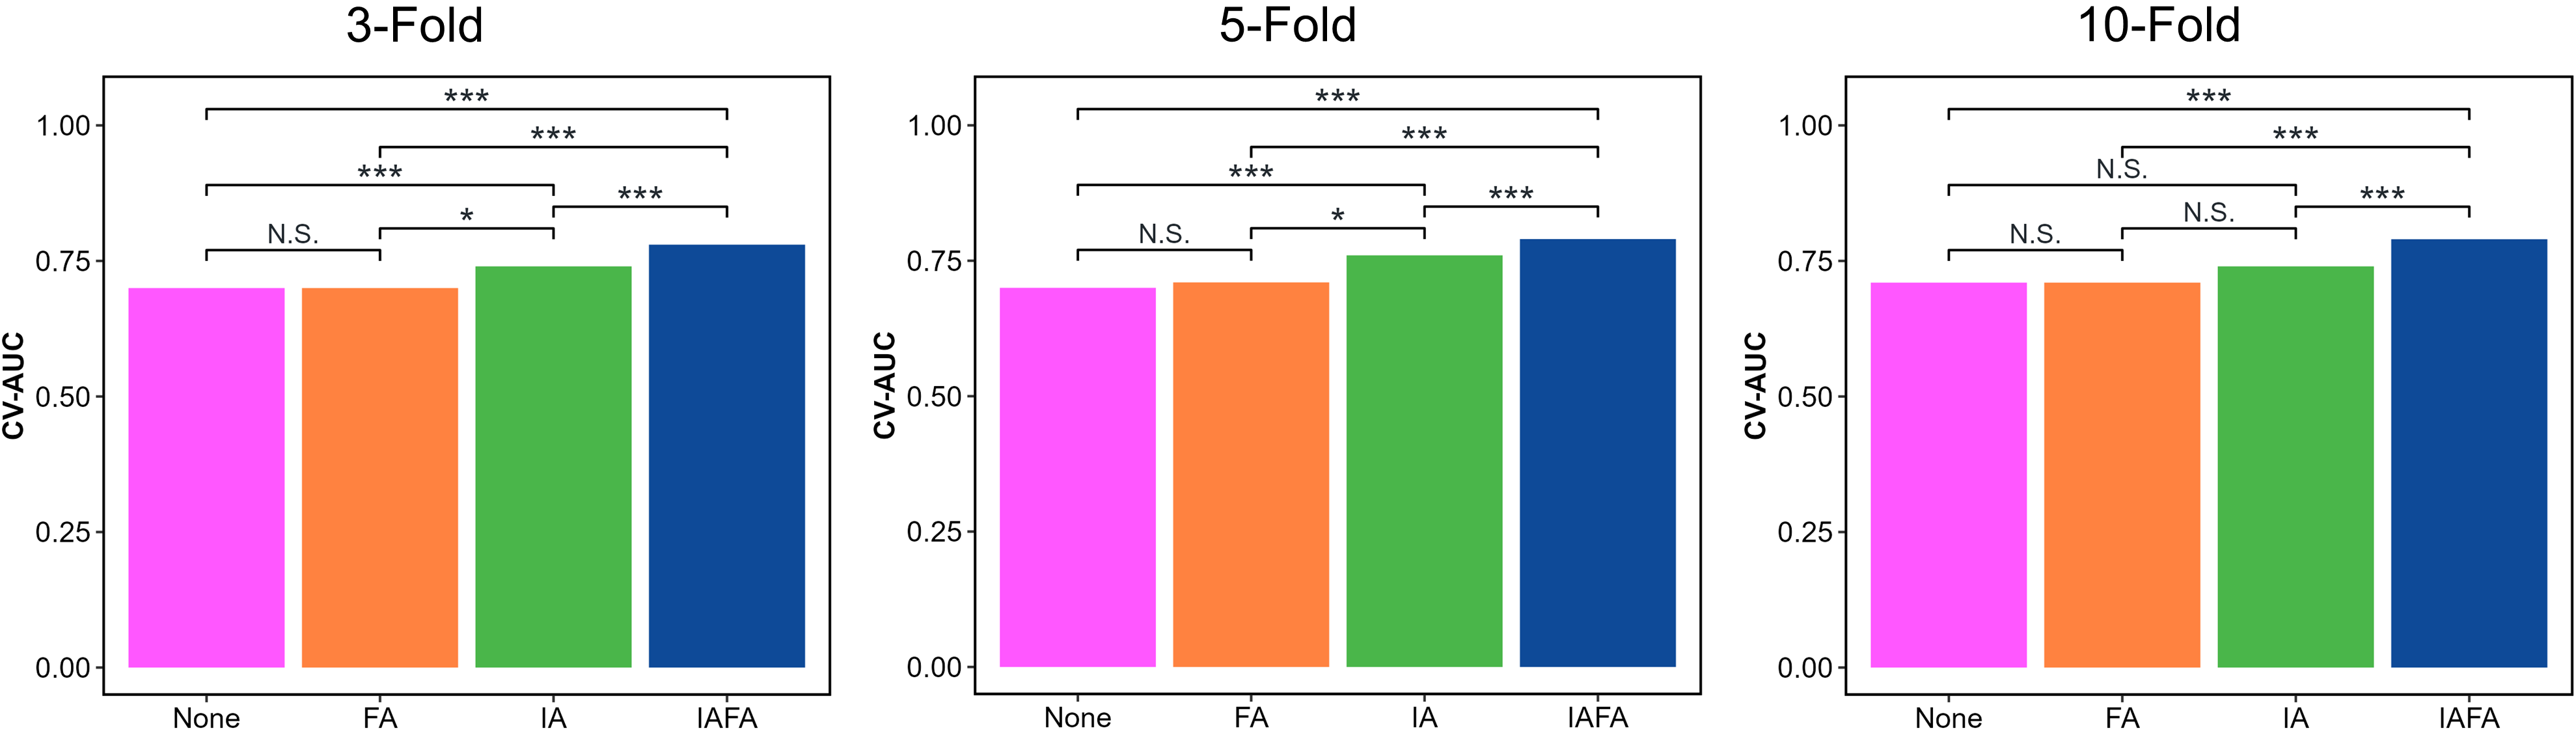
A total of 160 pathologically proven meningioma cases (129 low-grade, 31 high-grade) with pre-operative multi-sequence MRI were included in this retrospective study. Radiomics features were extracted from manually delineated tumor regions of interest on MRI images. A dual-level strategy (IAFA) incorporating both image-level (IA) and feature-level (FA) augmentation was proposed to balance the dataset. IA involved MRI-specific transformations like flipping, scaling and noise injection applied to the original images, to simulate MRI scenario in practice. FA used the Synthetic Minority Oversampling Technique (SMOTE) 12 to generate new synthetic features for the minority class based on similarities between existing features. Three levels feature selection (Intraclass coefficient between base and interobserver mask, statistic methods, and embedded methods) and one classifier were then combined to develop a radiomics-based grading model, which was validated using 3-, 5- and 10-fold cross-validation (CV) repeated over 100 trials. Model performance was evaluated based on following CV-metrics. The overall area under the receiver operating characteristic curve (AUC), namely the CV-AUC, evaluated by combining the model performance on all K testing folds in the same trial. The CV-Sensitivity and CV-Specificity were calculated based on the optimal point of the receiver operating characteristic curve (ROC) curve. Differences in patient characteristics were compared using Mann-Whitney U test and Fisher’s exact test. The best trial paired CV-AUC were compared between settings (IAFA, IA, FA, no augmentation) using the two-sided DeLong’s test 15. The distribution of paired CV-AUC was compared between settings using the two-sided paired t-test.RESULTS
The cohort consisted of 129 low-grade and 31 high-grade meningioma patients with no significant differences in age or gender. Using the proposed IAFA, the radiomics model achieved CV-AUC of ≥0.78 across all CVs in the best trial of 100 trials. Additionally, the results of IAFA were consistently statistically outperformed other settings in each CV in the best trial (p<0.01). The CV-Sensitivity and CV-Specificity were 0.72/0.69, 0.76/0.71 and 0.63/0.82 for 3-, 5- and 10-fold CV, respectively, in the top performing trial. Distribution of CV-AUC over all trials revealed significantly better calibration and discrimination ability when training with the dual IAFA method compared to single augmentation levels or no augmentation (p<0.01)DISCUSSION
The IAFA helped address both data insufficiency and class imbalance issues affecting radiomics modeling of meningioma grades. By combining MRI-specific image transformations with synthetic oversampling of features, the minority high-grade class could be better represented without compromising data integrity. This led to a more robust and generalized model compared to single-level strategies as evidenced by the superior and consistent performance across different validation methods. The proposed method thus shows potential for developing an effective clinical decision support tool, though further prospective validation is still needed. Some limitations include the retrospective design and moderate sample sizes. Future work will aim to validate this approach on larger independent datasets.CONCLUSION
In summary, we have demonstrated that a dual-level data augmentation strategy can help mitigate class imbalance when developing radiomics models using routinely acquired MR images. The improved performance and stability of our meningioma grading model indicates its potential to aid clinical decision making and allow for better pre-operative risk stratification of patients. With further validation, radiomics incorporating such data-driven techniques may provide a non-invasive alternative or complement to histopathology for tumor characterization.Acknowledgements
N/AReferences
1. Ostrom QT, Cioffi G, Gittleman H, et al. CBTRUS statistical report: primary brain and other central nervous system tumors diagnosed in the United States in 2012–2016. Neuro-oncology. 2019;21(Supplement_5):v1-v100.
2. Goldbrunner R, Stavrinou P, Jenkinson MD, et al. EANO guideline on the diagnosis and management of meningiomas. Neuro-oncology. 2021;23(11):1821-1834.
3. Kshettry VR, Ostrom QT, Kruchko C, et al. Descriptive epidemiology of World Health Organization grades II and III intracranial meningiomas in the United States. Neuro-oncology. 2015;17(8):1166-1173.
4. Louis DN, Perry A, Reifenberger G, et al. The 2016 World Health Organization classification of tumors of the central nervous system: a summary. Acta neuropathologica. 2016;131:803-820.
5. Ugga L, Spadarella G, Pinto L, et al. Meningioma radiomics: at the nexus of imaging, pathology and biomolecular characterization. Cancers. 2022;14(11):2605.
6. Moliterno J, Cope WP, Vartanian ED, et al. Survival in patients treated for anaplastic meningioma. Journal of neurosurgery. 2015;123(1):23-30.
7. Aerts HJ, Velazquez ER, Leijenaar RT, et al. Decoding tumour phenotype by noninvasive imaging using a quantitative radiomics approach. Nature communications. 2014;5(1):4006.
8. Koçak B, Durmaz EŞ, Ateş E, et al. Radiomics with artificial intelligence: a practical guide for beginners. Diagnostic and interventional radiology. 2019;25(6):485.
9. Le VH, Kha QH, Minh TNT, et al. Development and validation of ct-based radiomics signature for overall survival prediction in multi-organ cancer. Journal of Digital Imaging. 2023:1-12.
10. Arafat MY, Hoque S, Farid DM. Cluster-based under-sampling with random forest for multi-class imbalanced classification. IEEE; 2017:1-6.
11. Arafat MY, Hoque S, Xu S, et al. An under-sampling method with support vectors in multi-class imbalanced data classification. IEEE; 2019:1-6.
12. Chawla NV, Bowyer KW, Hall LO, et al. SMOTE: synthetic minority over-sampling technique. Journal of artificial intelligence research. 2002;16:321-357.
13. Mishra AK, Roy P, Bandyopadhyay S, et al. Breast ultrasound tumour classification: A Machine Learning—Radiomics based approach. Expert Systems. 2021;38(7):e12713.
14. Wang G, Wong KW, Lu J. AUC-based extreme learning machines for supervised and semi-supervised imbalanced classification. IEEE Transactions on Systems, Man, and Cybernetics: Systems. 2020;51(12):7919-7930.
15. DeLong ER, DeLong DM, Clarke-Pearson DL. Comparing the areas under two or more correlated receiver operating characteristic curves: a nonparametric approach. Biometrics. 1988:837-845.
Figures