3107
Investigation of ComBat Harmonization on Radiomic and Deep Features from Multi-Center Clinical Abdominal MRI Data1Department of Radiology, Cincinnati children's hospital medical center, Cincinnati, OH, United States, 2Cincinnati Children's Hospital Medical Center, Cincinnati, OH, United States, 3Department of Radiology, New York University Langone Health, New York, NY, United States, 4University of Michigan, Ann Arbor, MI, United States, 5University of Wisconsin-Madison, Madison, WI, United States, 6Department of Radiology, University of Wisconsin-Madison, Madison, WI, United States
Synopsis
Keywords: Analysis/Processing, Data Processing, Harmonization
Motivation: Multi-center studies often suffer from non-biological variations due to different MRI scanners. This can adversely affect the comparability of MRI radiomic features and deep features.
Goal(s): This multi-center study aims to investigate the effectiveness of ComBat harmonization on radiomic and deep features from abdominal MRI data.
Approach: We retrieved 3,857 clinical T2-weighted MRI examinations of adult patients from three institutions. The ANOVA test and Cohen’s F score were applied as evaluation metrics.
Results: An average of 78.7% of radiomic features, and 74.9% of deep features had significant distribution differences. After ComBat harmonization, none of radiomic and deep features had significant difference.
Impact: This multi-center study showed that ComBat can effectively remove non-biological variations of radiomic and deep features from abdominal MRI studies acquired from different MRI scanners and institutions. Future multi-center studies should consider ComBat harmonization to improve data comparability.
Introduction
There is increasing interest in multi-center research applying artificial intelligence techniques to abdominal MRI data1,2. However, multi-center studies often suffer from non-biological variations due to different acquisition protocols or manufacturers referred to as scanner effects3,4. Scanner effects systematically affect radiomic and deep features extracted from MRI, reducing data comparability among multiple study centers. Recently, ComBat harmonization5, has been rapidly adapted to medical image domain6. This study aims to investigate the effectiveness of ComBat harmonization on T2-weighted (T2W) abdominal MRI features.Methods
We identified patients who underwent abdominal MRI examinations between 2011-2022 and retrieved axial T2W fast spin-echo fat-saturated MR images from total 3857 examinations/subjects, in which 2,304 subjects are from New York University Langone Health (NYU) with Siemens (Siemens Healthineers) scanners, 1,226 subjects from University of Wisconsin (UW) with GE (GE HealthCare) scanners, and 327 subjects from University of Michigan (UM) with Philips (Philips Healthcare) scanners. Examinations were performed on 1.5-Tesla (T) and 3-Tesla (T) MRI scanners for all three centers.To extract radiomic features, we first segmented liver and spleen from T2W MRI data with a Swin U-net Transformer model7. PyRadiomics was then used to extract 86 radiomic features from liver and spleen segmentation8. We had a total of 172 features for each examination/subject.
To extract deep features, we adopted the Swin Transformer9 as the deep feature extractor. Eleven T2W images through the medial liver and spleen were selected from each examination. Individual 2D axial MRI images were input to the Swin transformer, generating 1,024 deep features for each of the eleven MRI images. We combined deep features from all eleven slices by averaging deep features from the same dimension, resulted in 1,024 deep features for each examination/subject.
In this work, we assumed normal distribution of scanner effects and applied ComBat5 to fit a model to estimate scanner effects from MRI scanners using either radiomic or deep features by adjusting sex and age. Harmonized features were obtained by subtracting those scanner effects from unharmonized features.
We designed five experiments for both radiomic and deep features. Three experiments were designed to test whether ComBat can effectively harmonize features from the same manufacturer but different field strengths (i.e., NYU [Siemens] 1.5T vs 3T; UW [GE]1.5T vs 3T; UM [Philips] 1.5T vs 3T); two experiments were designed to test whether ComBat can harmonize features from the same field strength but different manufacturers (i.e., 1.5T MRI scanner-NYU [Siemens] vs UW [GE] vs UM [Philips], and 3T MRI scanner NYU [Siemens] vs UW [GE] vs UM [Philips]).
We applied the ANOVA test for each individual radiomic or deep feature with the null hypothesis that there is no difference among feature distributions based on field strength or manufacturer. We also calculated Cohen’s F score to measure the size of difference.
Results
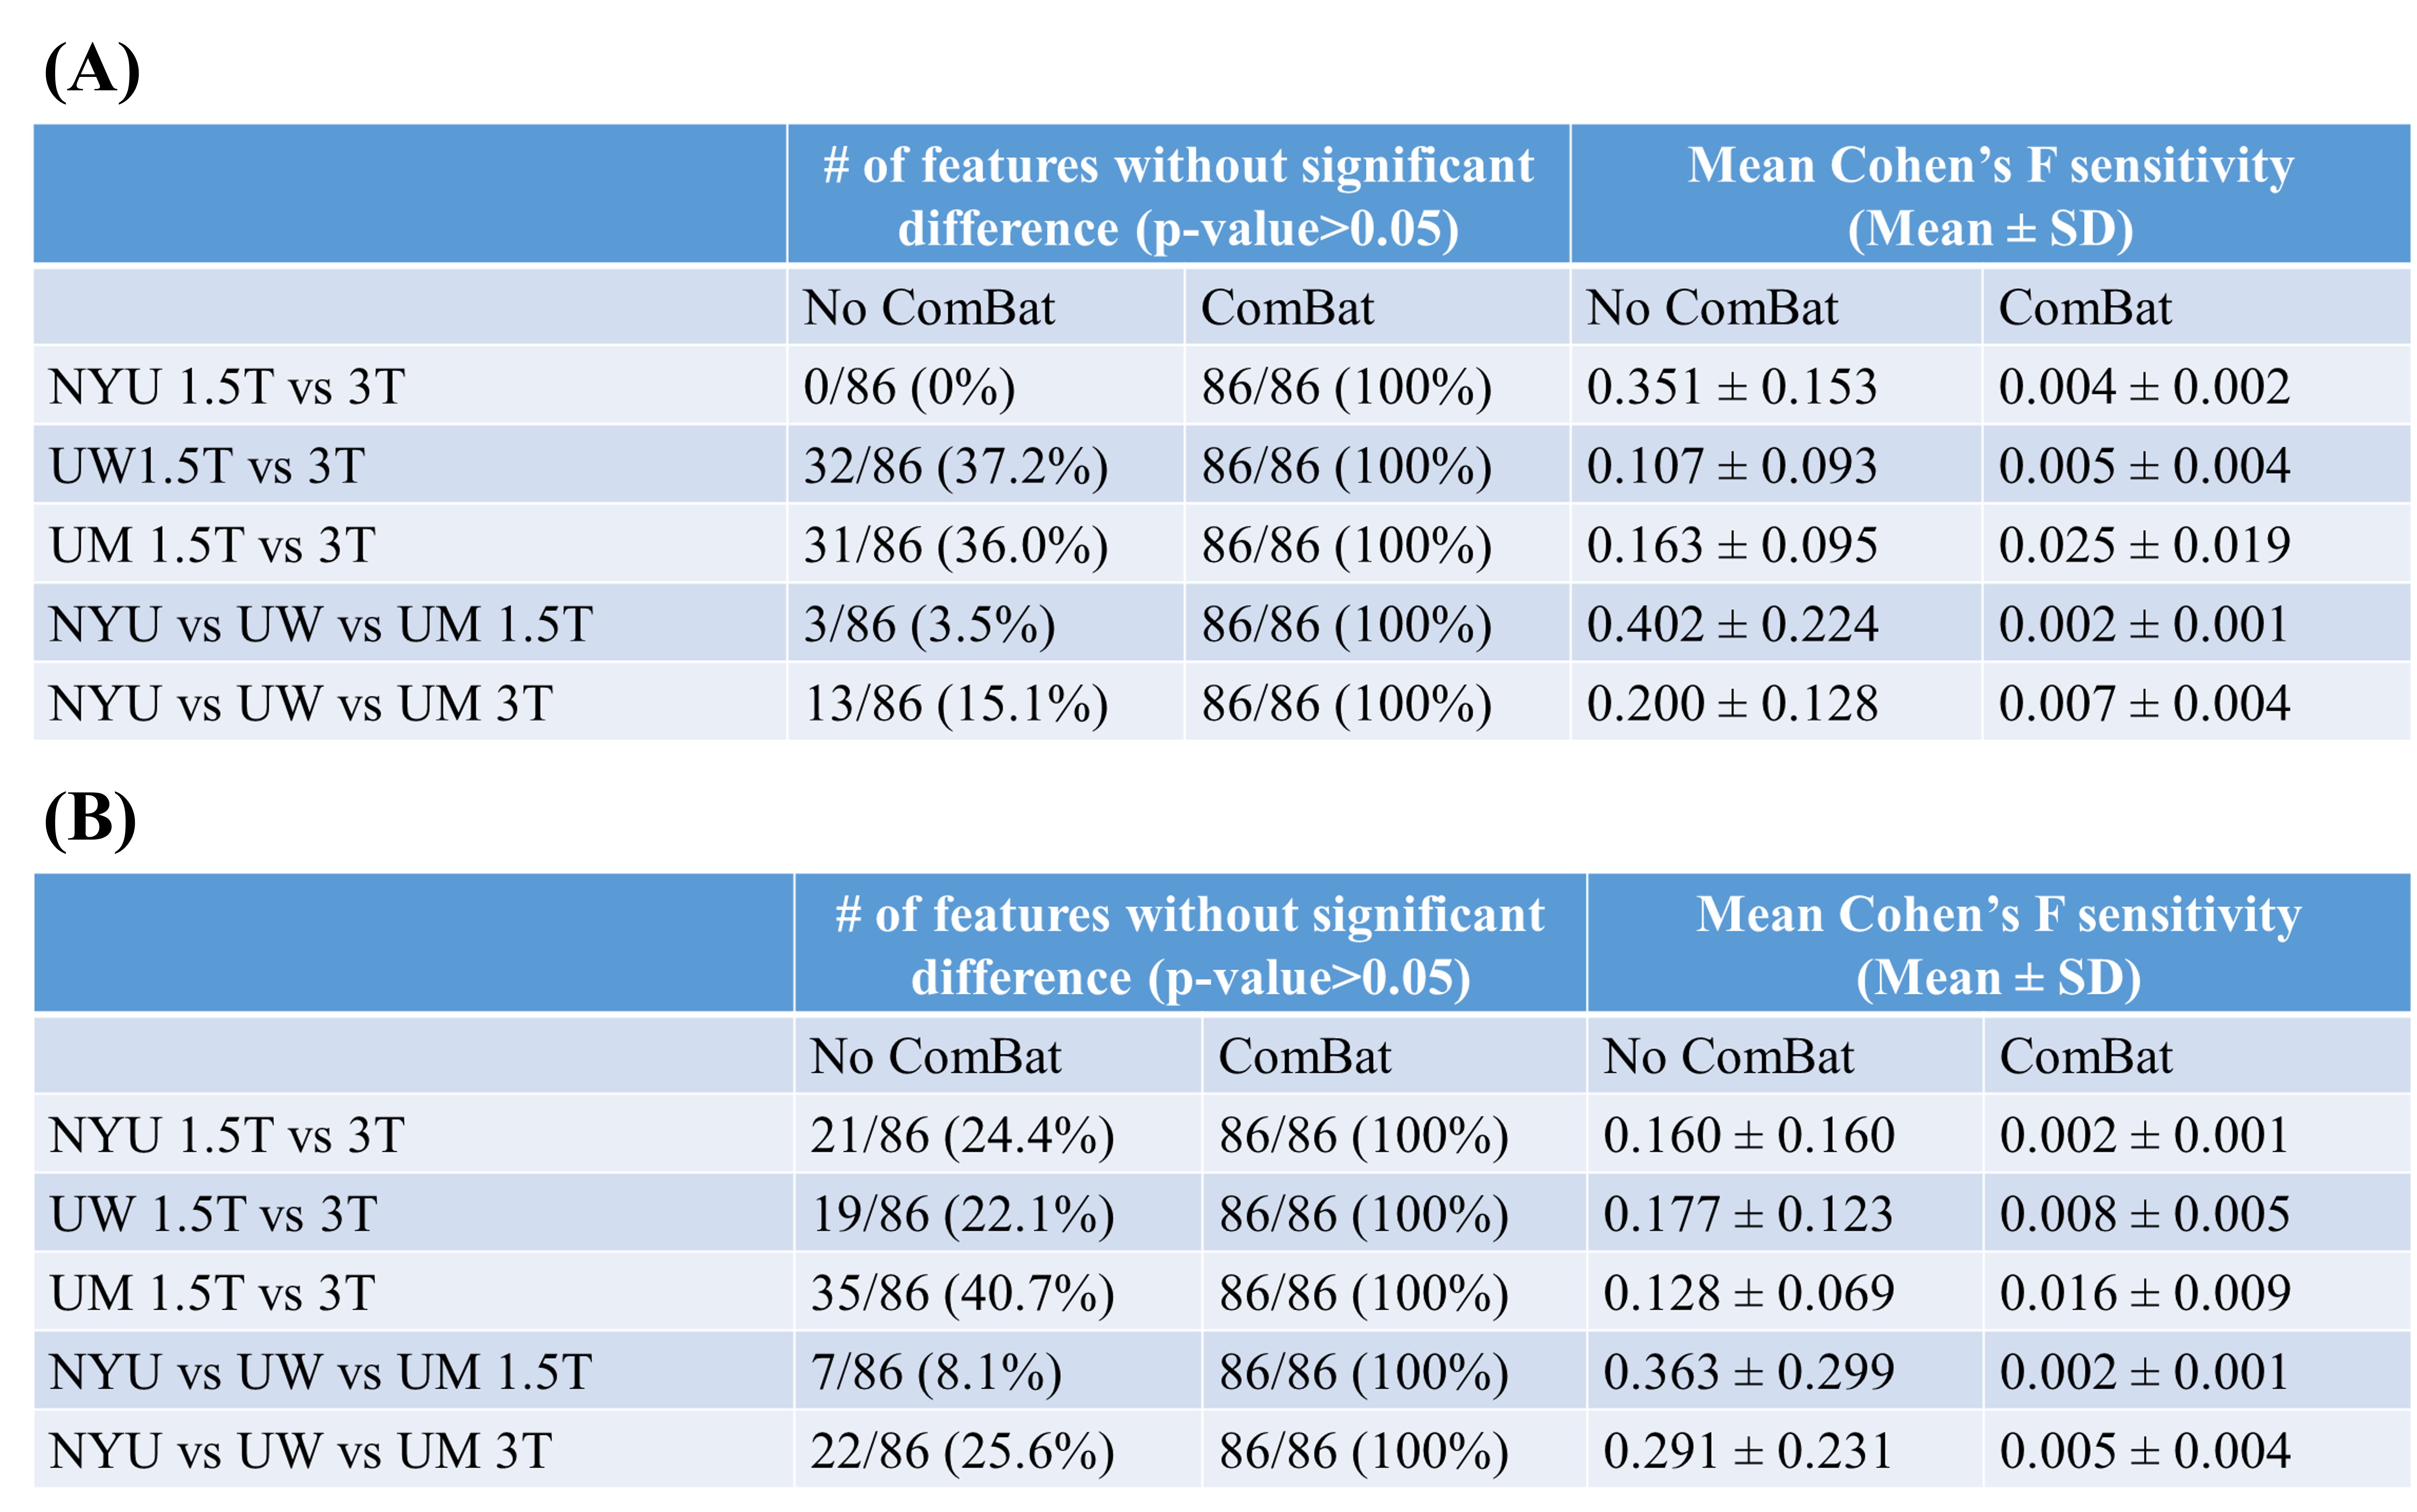
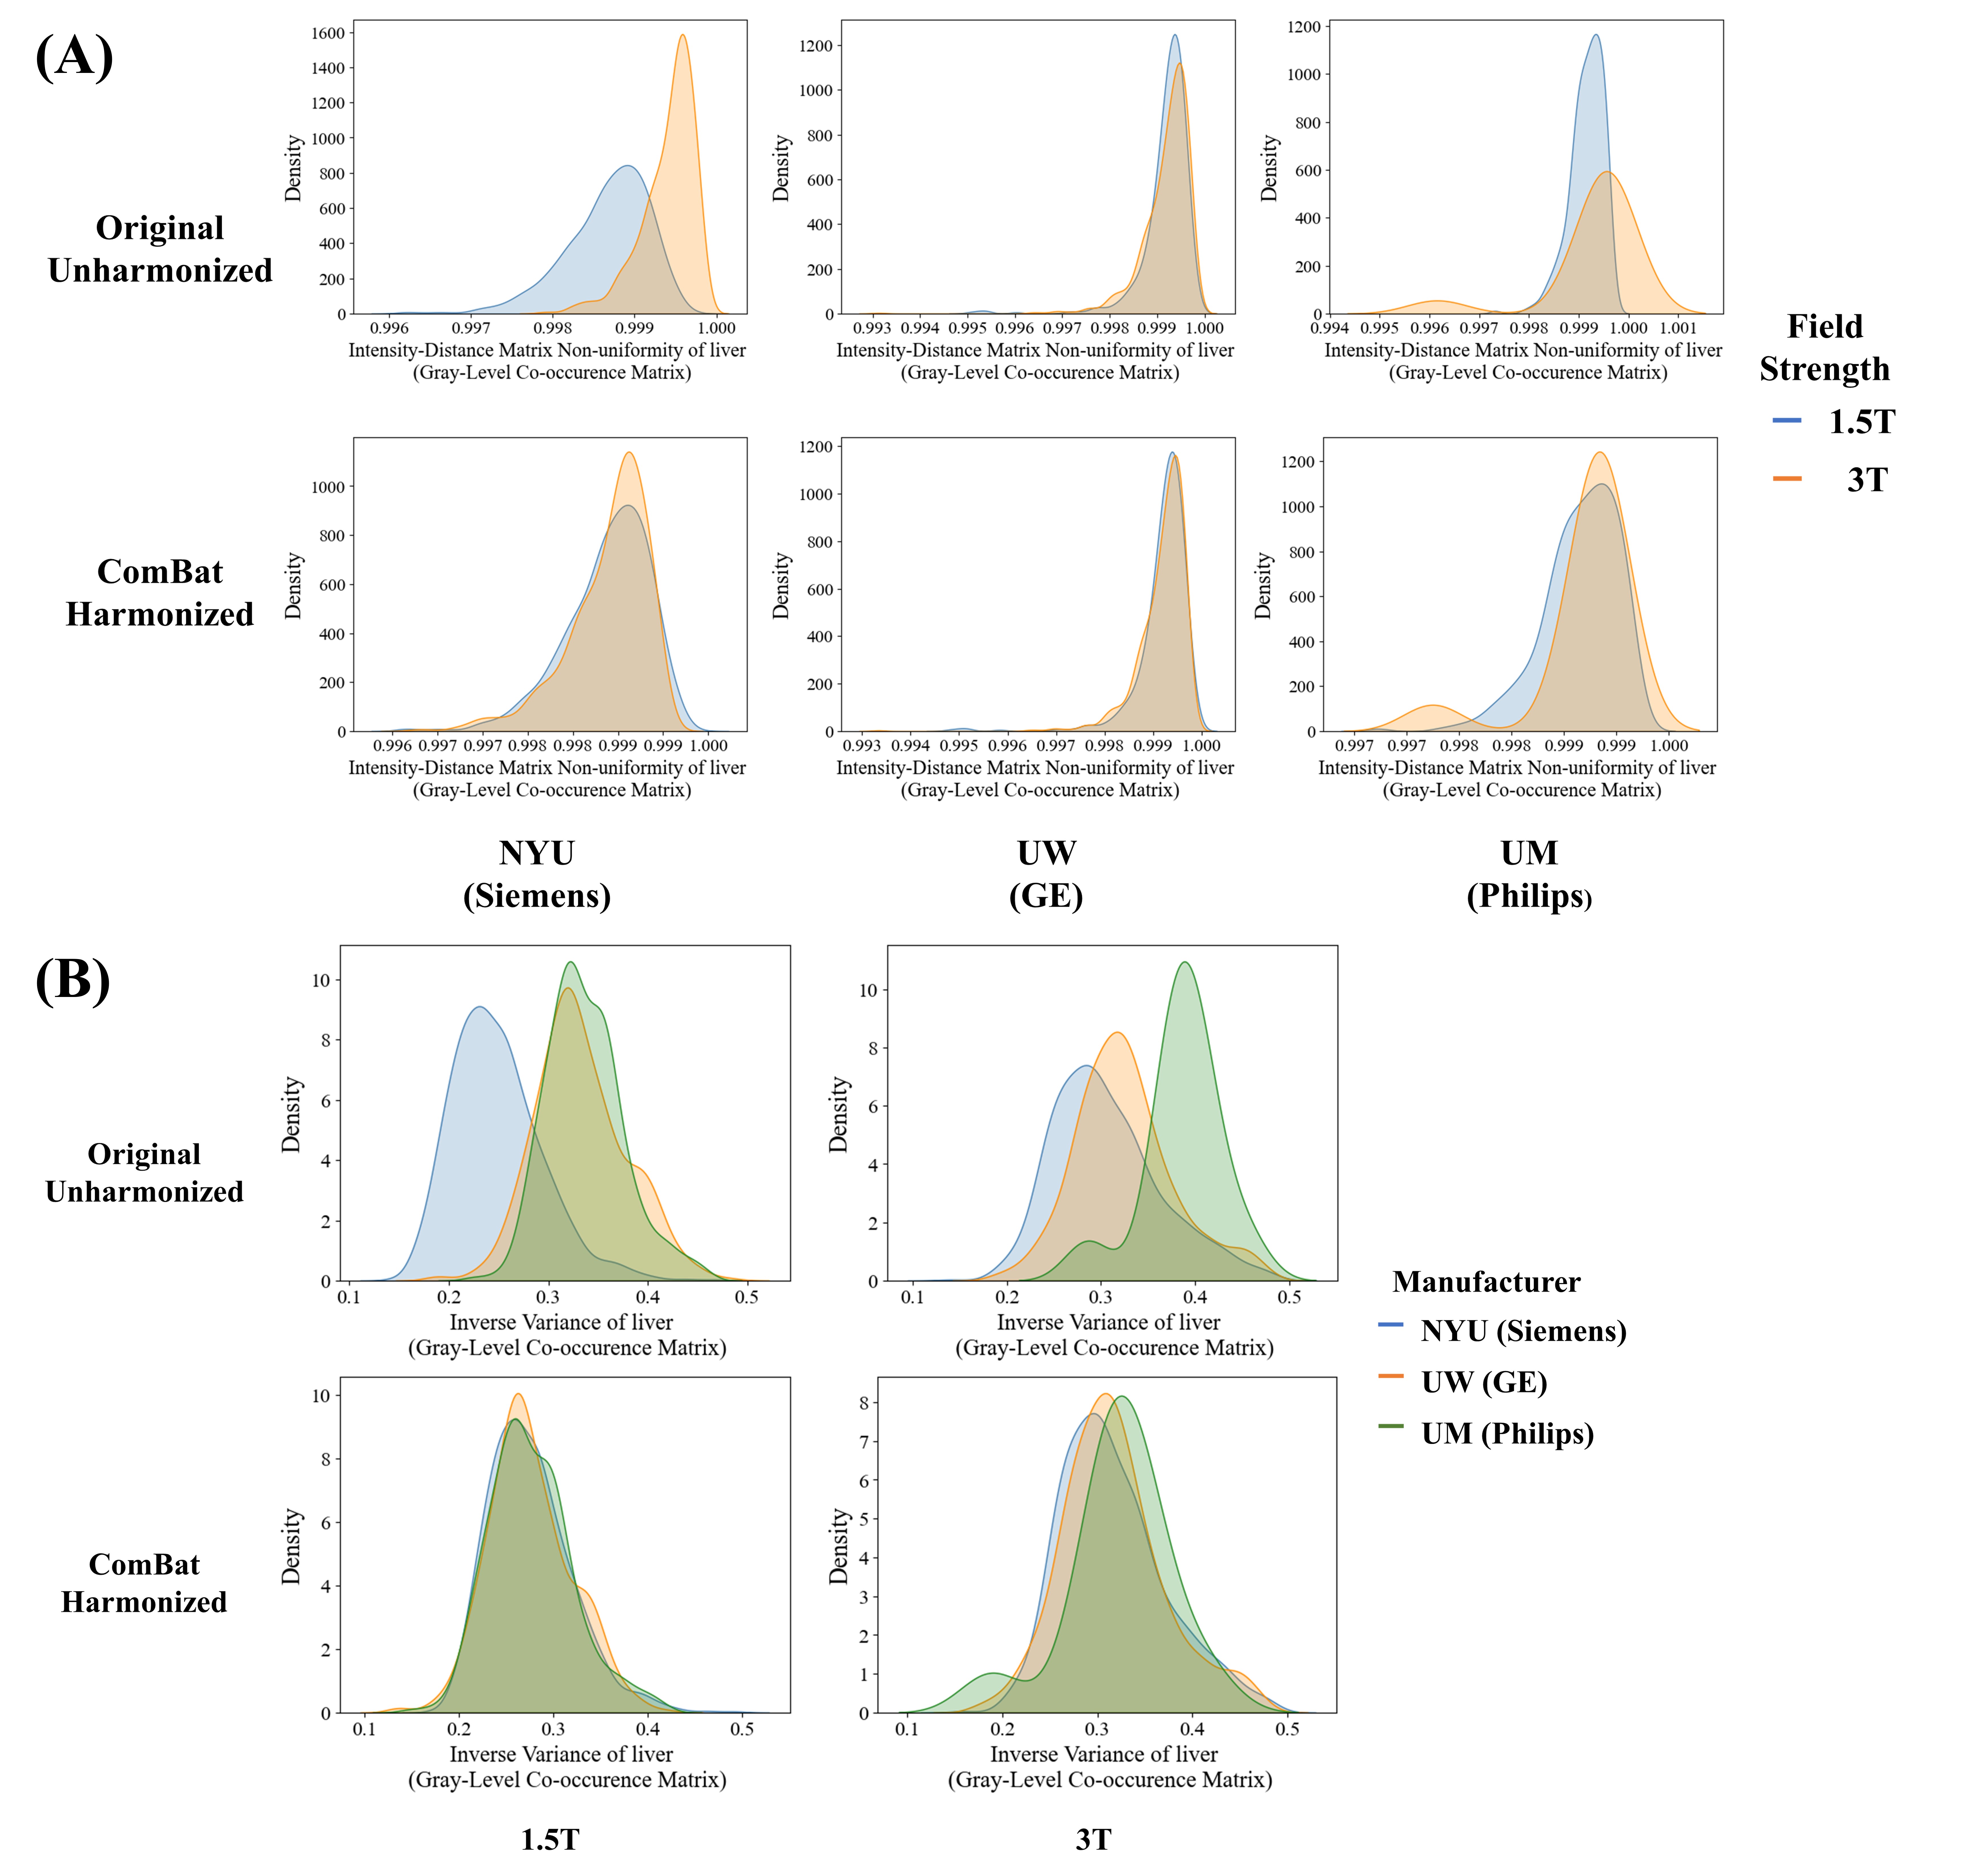
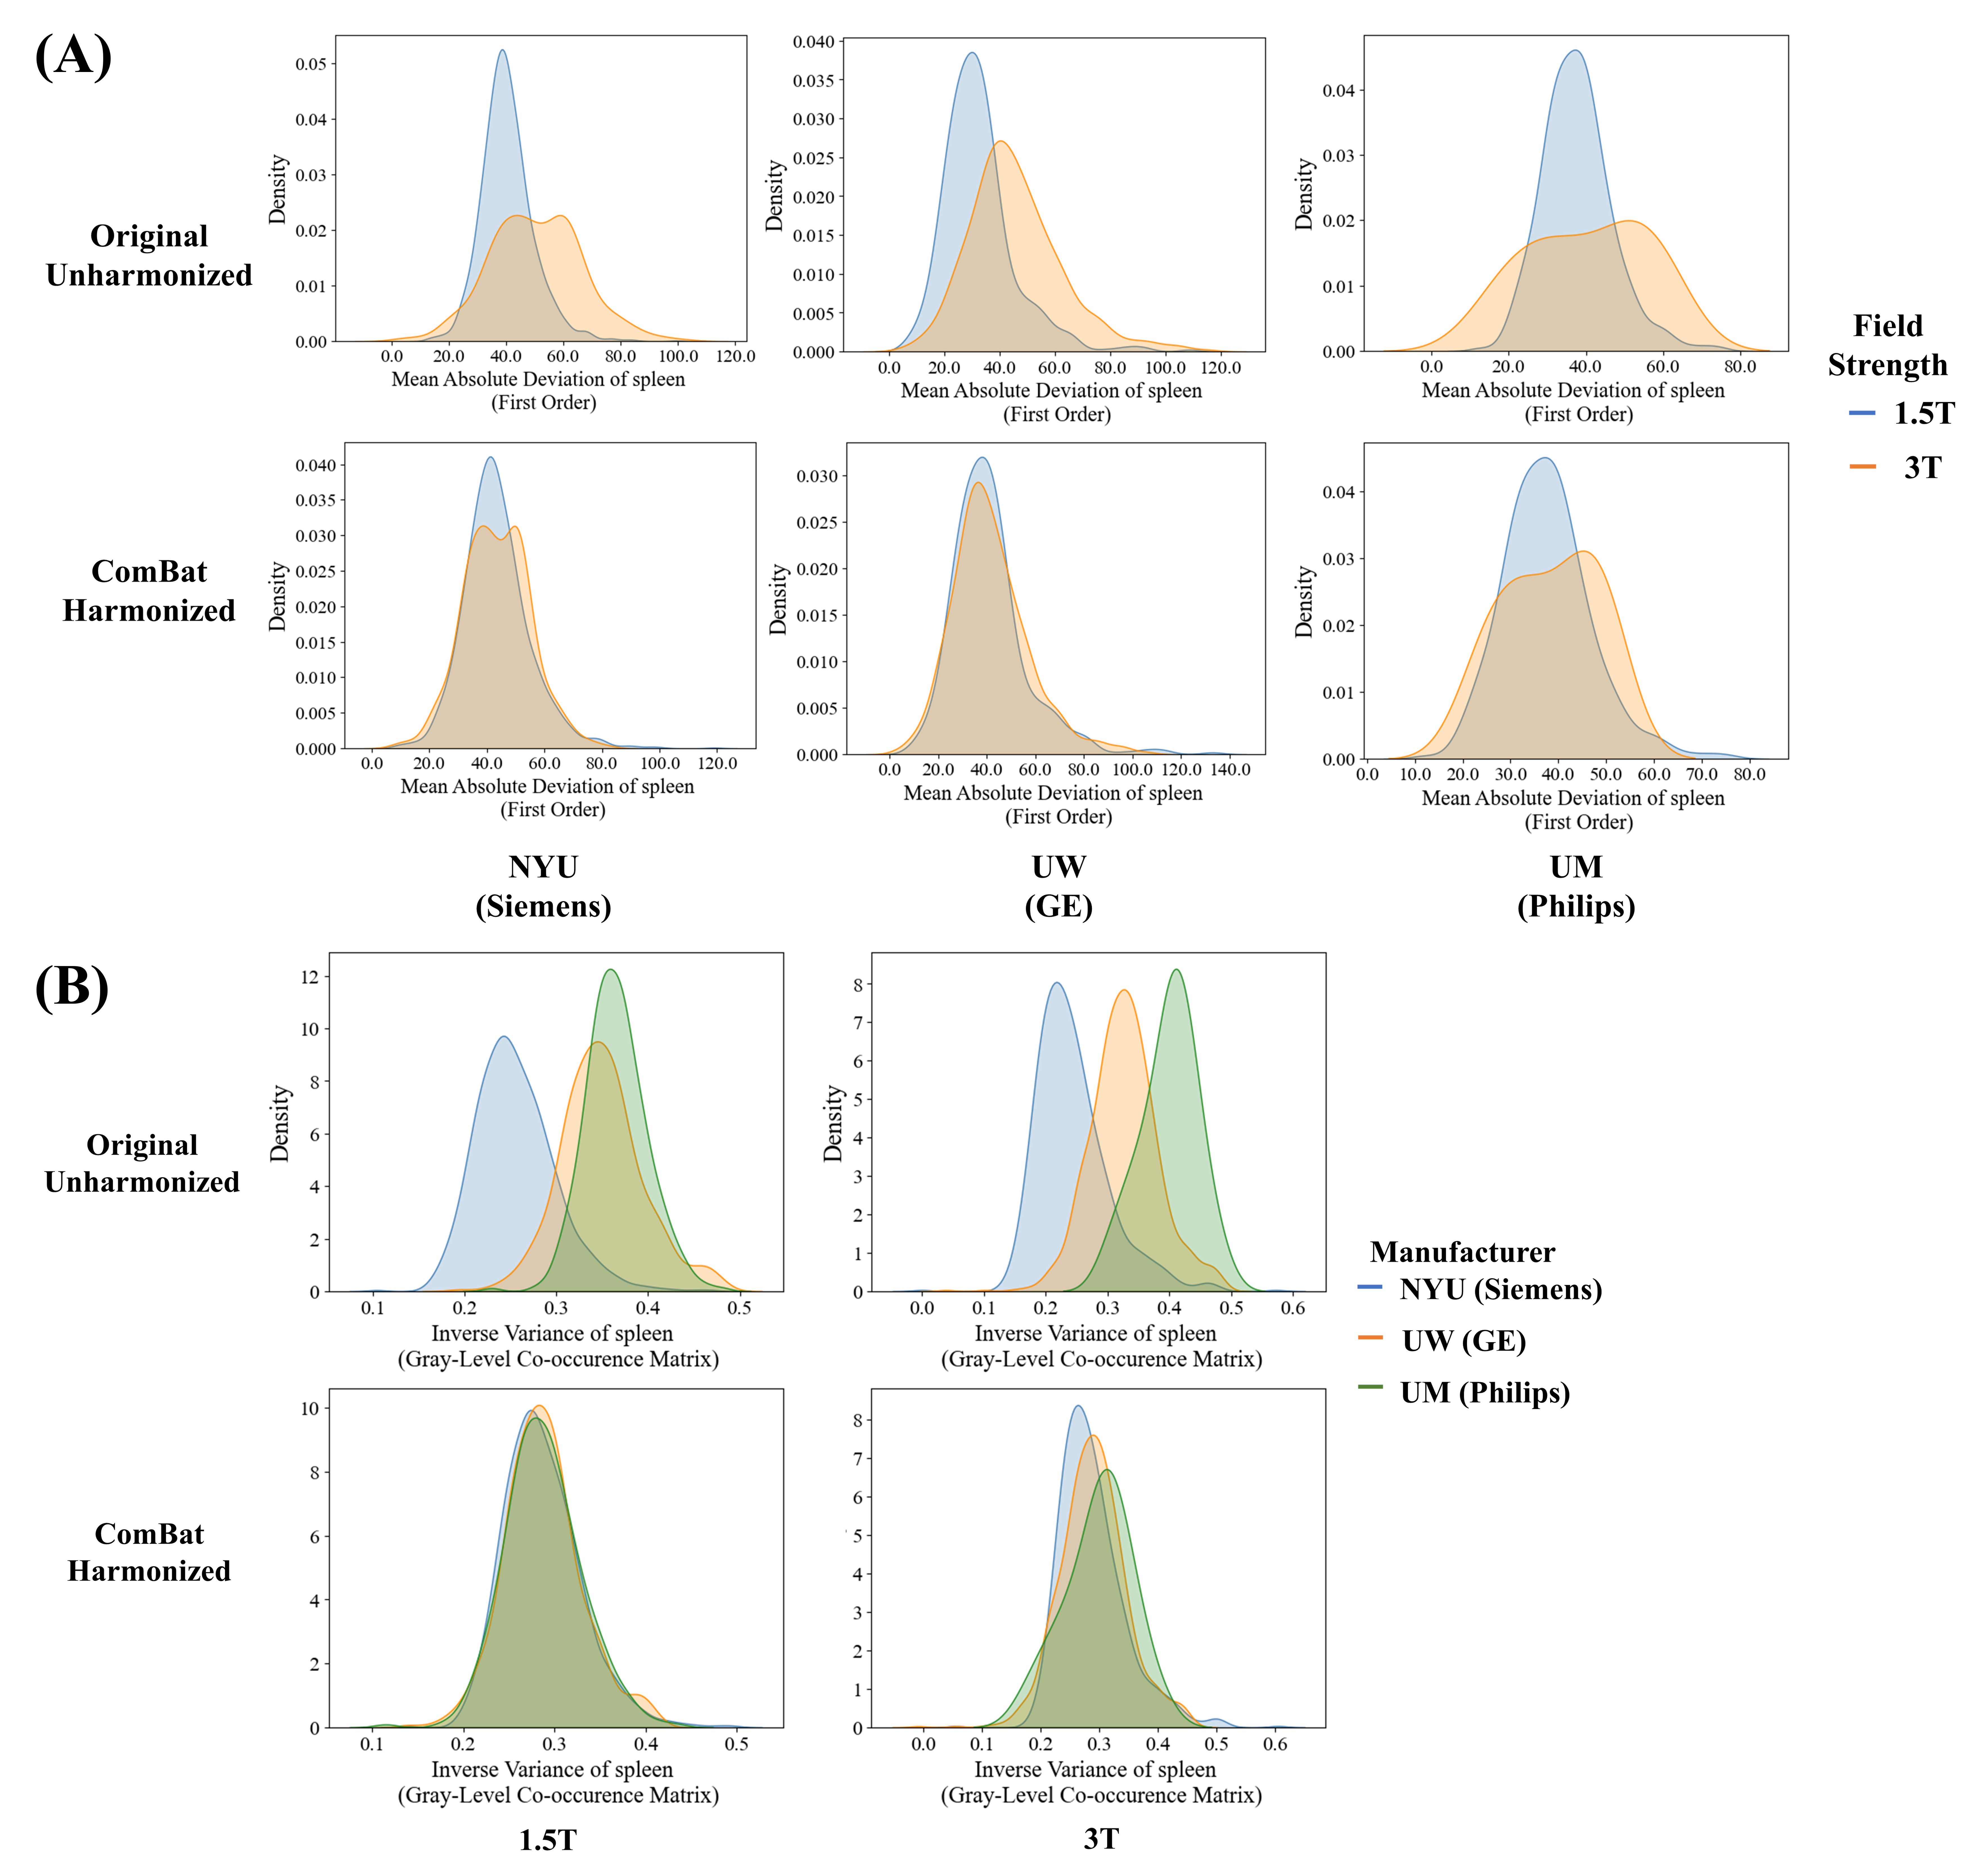
No significant differences were observed on age and sex among adult patients from three study centers. Between 1.5T and 3T field strengths, the numbers of liver radiomic features without significant difference were 0/86 (0%) for Siemens, 32/86 (37.2%) for GE, and 31/86 (36.0%) for Philips, respectively. Among scanners with the same magnetic field strength, the numbers of liver features without significant difference were 3/86 (3.5%) and 13/86 (15.1%) for 1.5T and 3T MRI scanners, respectively. These numbers improved to 86/86 (100%) after ComBat harmonization (Figure 1a).Between 1.5T and 3T field strengths, the numbers of spleen radiomic features without significant difference were 21/86 (24.4%) for Siemens, 19/86 (22.1%) for GE, and 35/86 (40.7%) for Philips, respectively. Among scanners with the same magnetic field strength, the numbers of spleen features without significant difference were 7/86 (8.1%) and 22/86 (25.6%) for 1.5T and 3T MRI, respectively. These numbers improved to 86/86 (100%) after ComBat harmonization (Figure 1b). Distributions of representative radiomic features before and after ComBat harmonization were illustrated in Figure 3 for liver and Figure 4 for spleen, respectively.
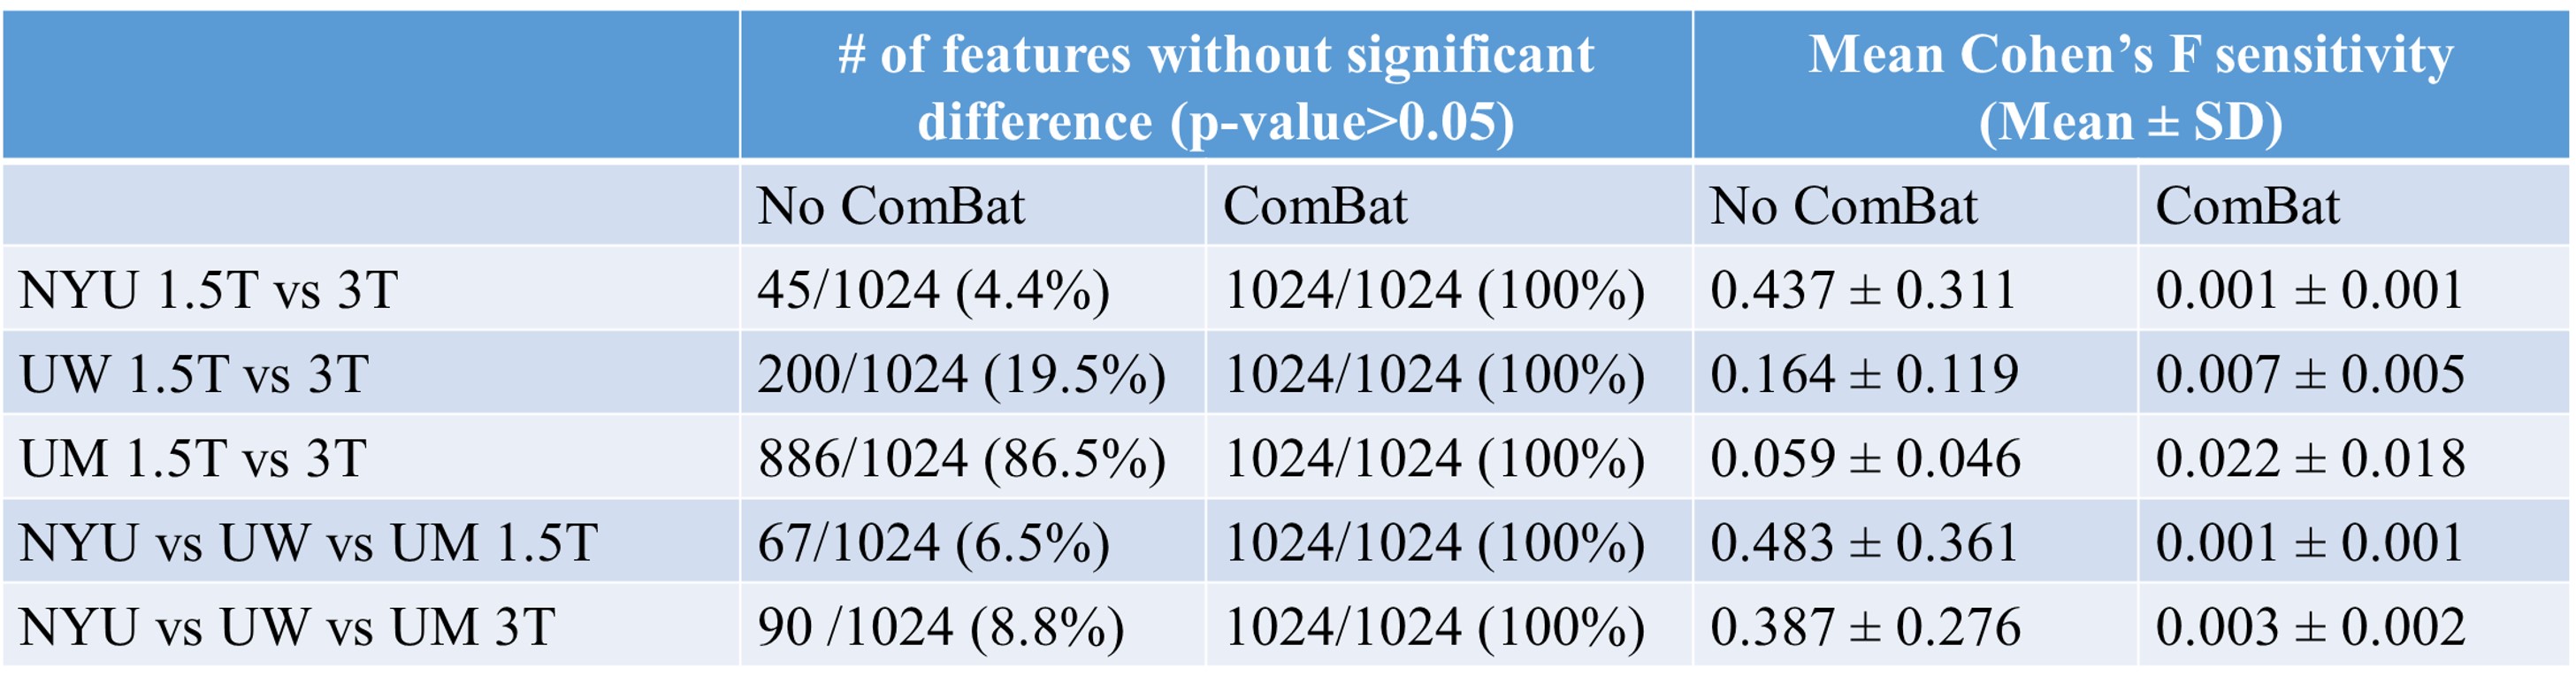
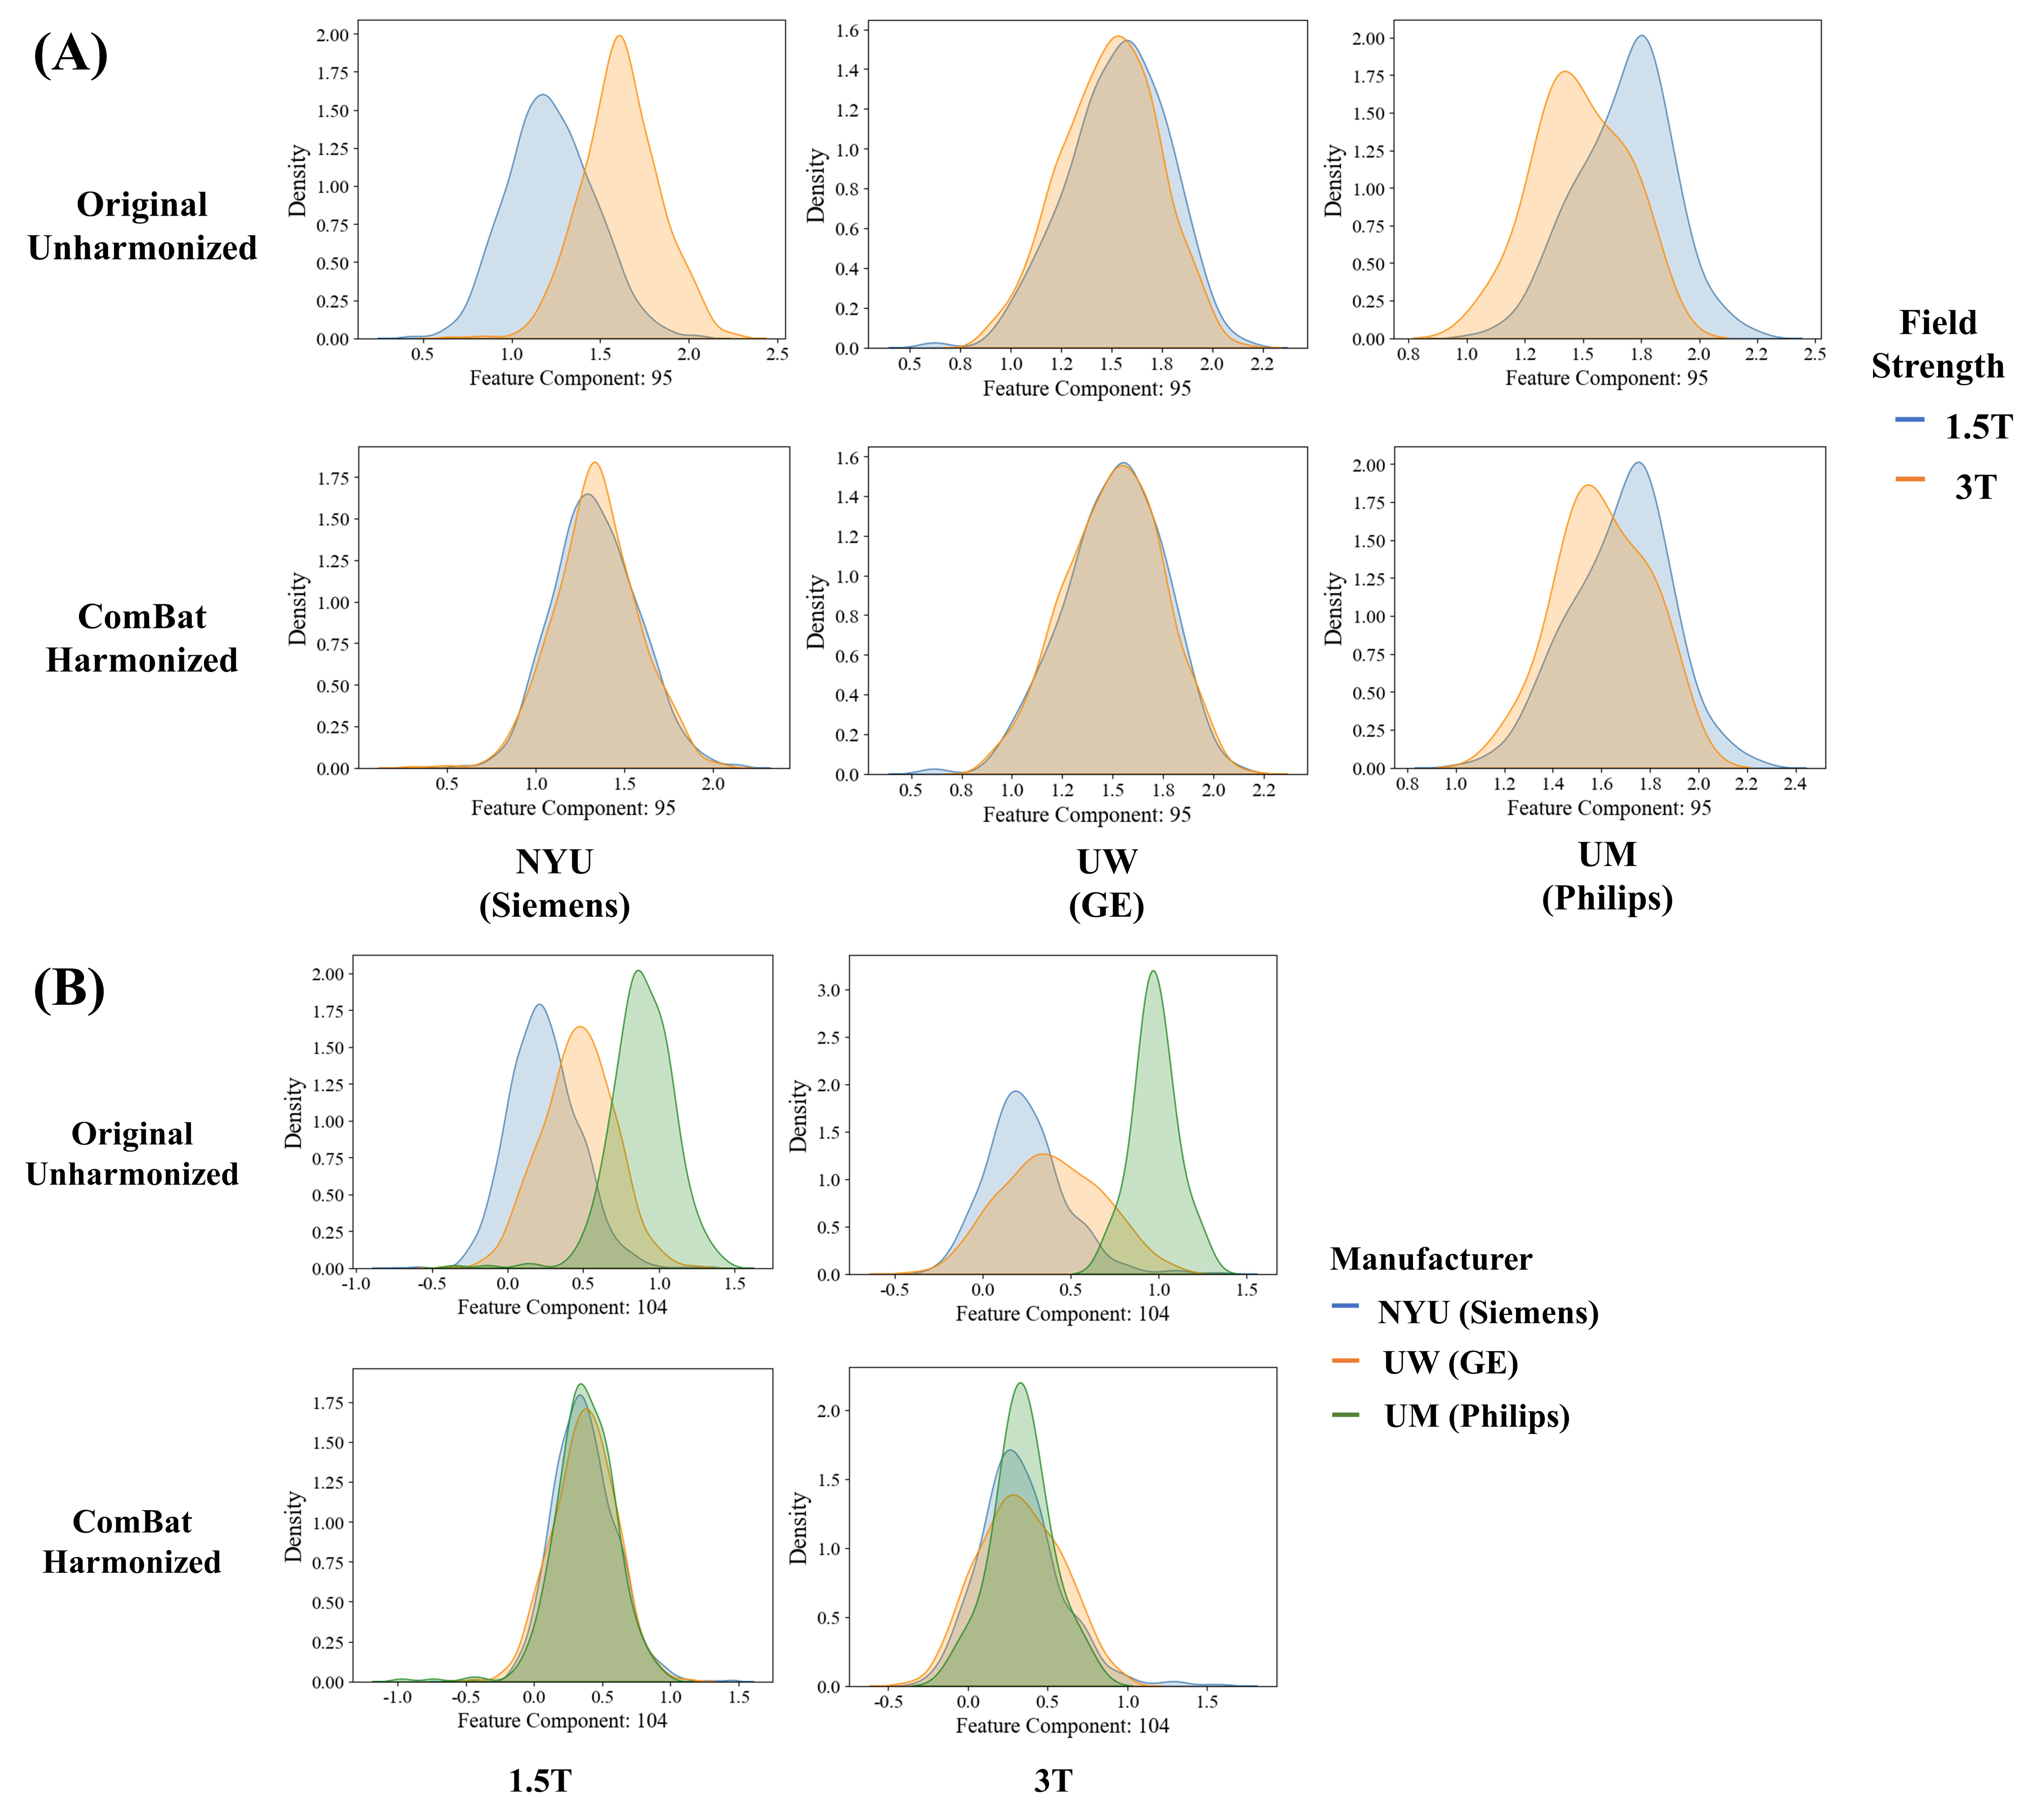
Between 1.5T and 3T field strengths, the numbers of deep features without significant difference were 45/1024 (4.4%) for Siemens, 67/1024 (6.6%) for GE, and 90/1024 (8.8%) for Philips, respectively. Among scanners with the same magnetic field strength, the numbers of deep features without significant difference were 67/1024 (6.5%) and 90/1024 (8.8%) for 1.5T and 3T MRI, respectively. These numbers improved to 1024/1024 (100%) after ComBat harmonization (Figure 2). We show the distributions of representative deep features before and after ComBat harmonization in Figure 5.
Conclusions
ComBat data harmonization algorithm can successfully remove scanner effects due to both field strength and scanner manufacturer for multi-center clinical abdominal MRI data. Future multi-center studies should consider ComBat harmonization to improve data comparability.Acknowledgements
This work was funded by the National Institutes of Health (R01-EB030582, R01-EB029944) and Academic and Research Committee (ARC) Awards of Cincinnati Children’s Hospital Medical Center. The funders played no role in the design, analysis, or presentation of the findings.References
1. Bento, M., et al., Deep learning in large and multi-site structural brain MR imaging datasets. Frontiers in Neuroinformatics, 2022. 15: p. 805669.
2. Schilling, K.G., et al., Aging and white matter microstructure and macrostructure: a longitudinal multi-site diffusion MRI study of 1218 participants. Brain Structure and Function, 2022. 227(6): p. 2111-2125.
3. Wrobel, J., et al., Intensity warping for multisite MRI harmonization. NeuroImage, 2020. 223: p. 117242.
4. Chen, J., et al., Exploration of scanning effects in multi-site structural MRI studies. Journal of neuroscience methods, 2014. 230: p. 37-50.
5. Johnson, W.E., C. Li, and A. Rabinovic, Adjusting batch effects in microarray expression data using empirical Bayes methods. Biostatistics, 2007. 8(1): p. 118-127.
6. Fortin, J.-P., et al., Harmonization of cortical thickness measurements across scanners and sites. Neuroimage, 2018. 167: p. 104-120.
7. Hatamizadeh, A., et al. Swin unetr: Swin transformers for semantic segmentation of brain tumors in mri images. in International MICCAI Brainlesion Workshop. 2021. Springer.
8. Van Griethuysen, J.J., et al., Computational radiomics system to decode the radiographic phenotype. Cancer research, 2017. 77(21): p. e104-e107.
9. Liu, Z., et al. Swin transformer: Hierarchical vision transformer using shifted windows. in Proceedings of the IEEE/CVF international conference on computer vision. 2021.
Figures