3096
Textural changes in the amygdala are more sensitive than volumetric changes in cocaine use disorder patients undergoing therapy1Accessible MR Lab, Biomedical Engineeing and Imaging Institute, Department of Diagnostic, Molecular and Interventional Radiology, Icahn School of Medicine at Mount Sinai, New York City, NY, United States, 2Munich Institute of Biomedical Engineering, Technical University of Munich, Munich, Germany, 3Department of Psychiatry, Icahn School of Medicine at Mount Sinai, New York City, NY, United States
Synopsis
Keywords: Data Processing, Data Processing, Texture analysis, Cocaine use disorder
Motivation: Neuroimaging improves treatment response classification in cocaine use disorder (CUD), often relying on brain morphometry to track changes. Multiple studies report that MRI textural changes predict earlier changes than volumetric changes in Alzheimer’s disease. We aim to apply textural analysis to multi-timepoint CUD MRI data.
Goal(s): Our work investigates changes in the amygdala volume and texture in CUD patients undergoing repetitive transcranial magnetic stimulation (rTMS).
Approach: We computed the volumetric and textural changes over time and compared the relative temporal sensitivities.
Results: The relative temporal sensitivity of textural changes in the amygdala is higher than volumetric changes in CUD patients undergoing rTMS.
Impact: Textural changes in MRI become noticeable before volumetric changes, offering additional insights into ongoing therapy complementary to clinical measures. This allows for personalized treatment, utilizing each individual's baseline data as their internal reference.
Introduction
Neuroimaging improves accuracy in classifying treatment responses for psychiatric conditions such as MDD, PTSD and substance use disorders, surpassing clinical measures alone1,2. Yip and Konova3 emphasized the value of dense temporal sampling in understanding the transition phase during addiction therapy. Several studies4,5 have explored volumetric changes in the amygdala and hippocampus in substance use disorders. In our work, we examined and compared the sensitivity of volumetric and textural changes over time in the amygdala of patients with cocaine use disorder (CUD) undergoing repetitive transcranial magnetic stimulation (rTMS). Our motivation stems from recent studies on early Alzheimer's detection using textural analysis6,7.Methods
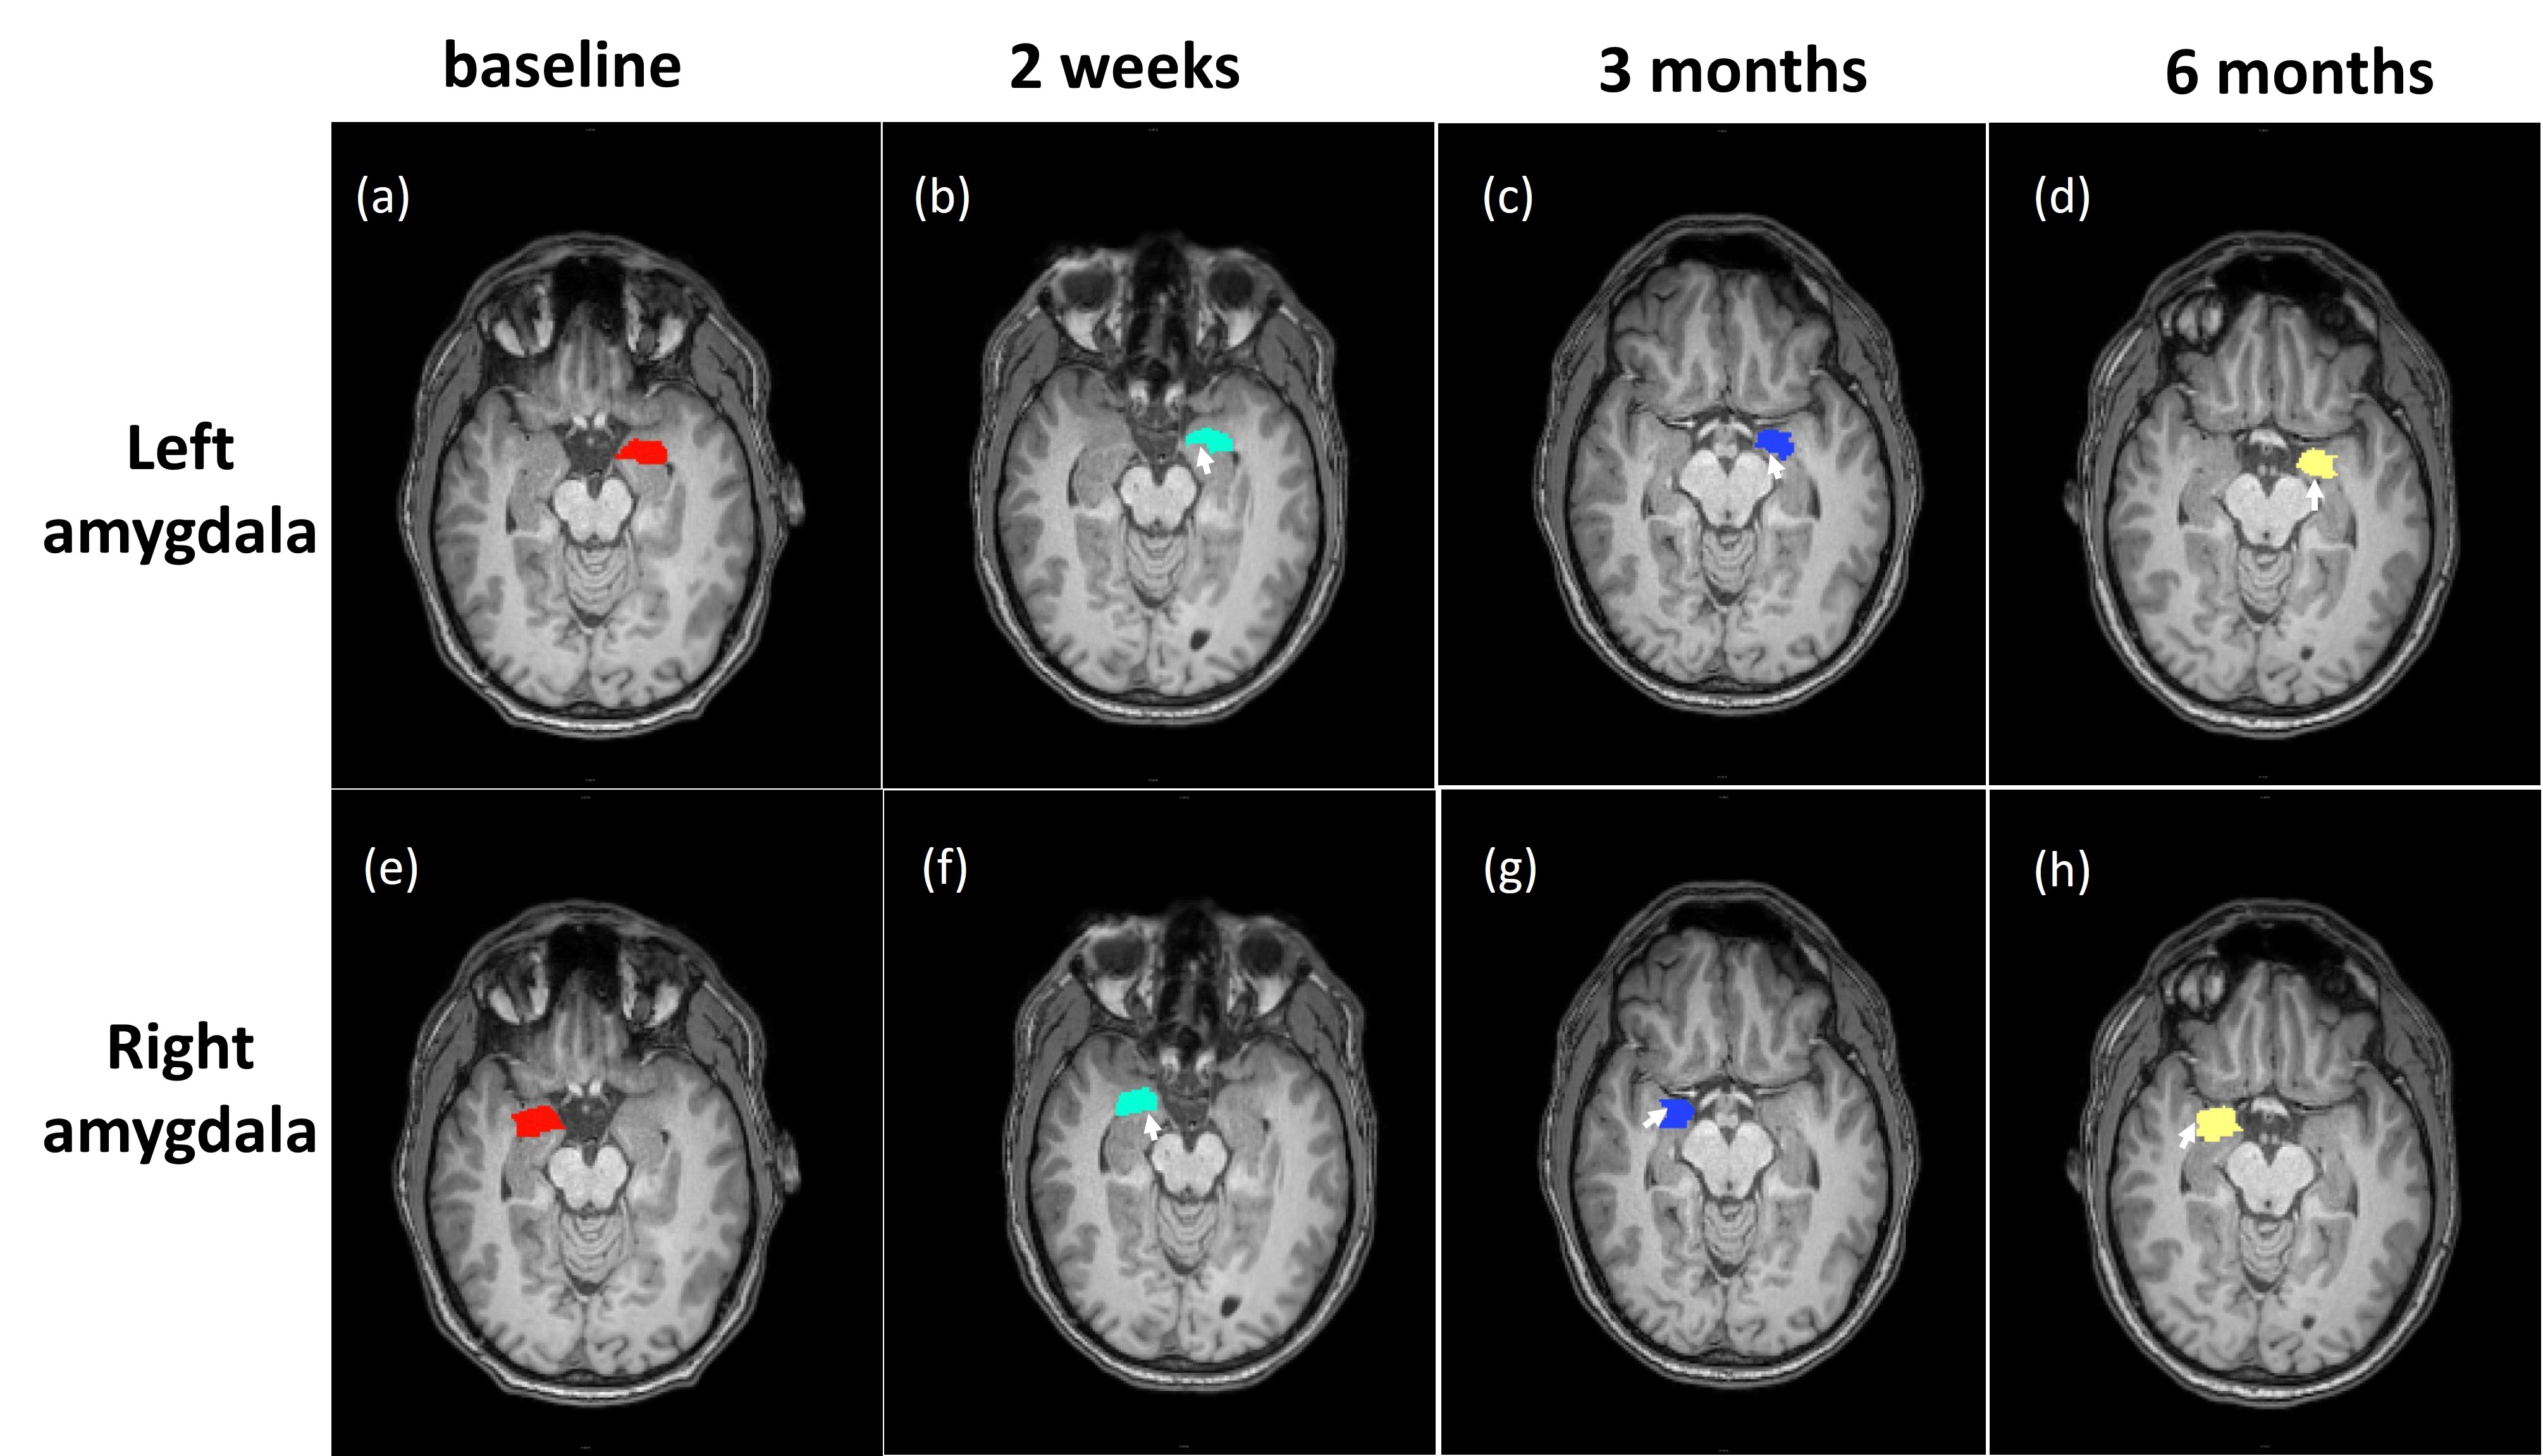
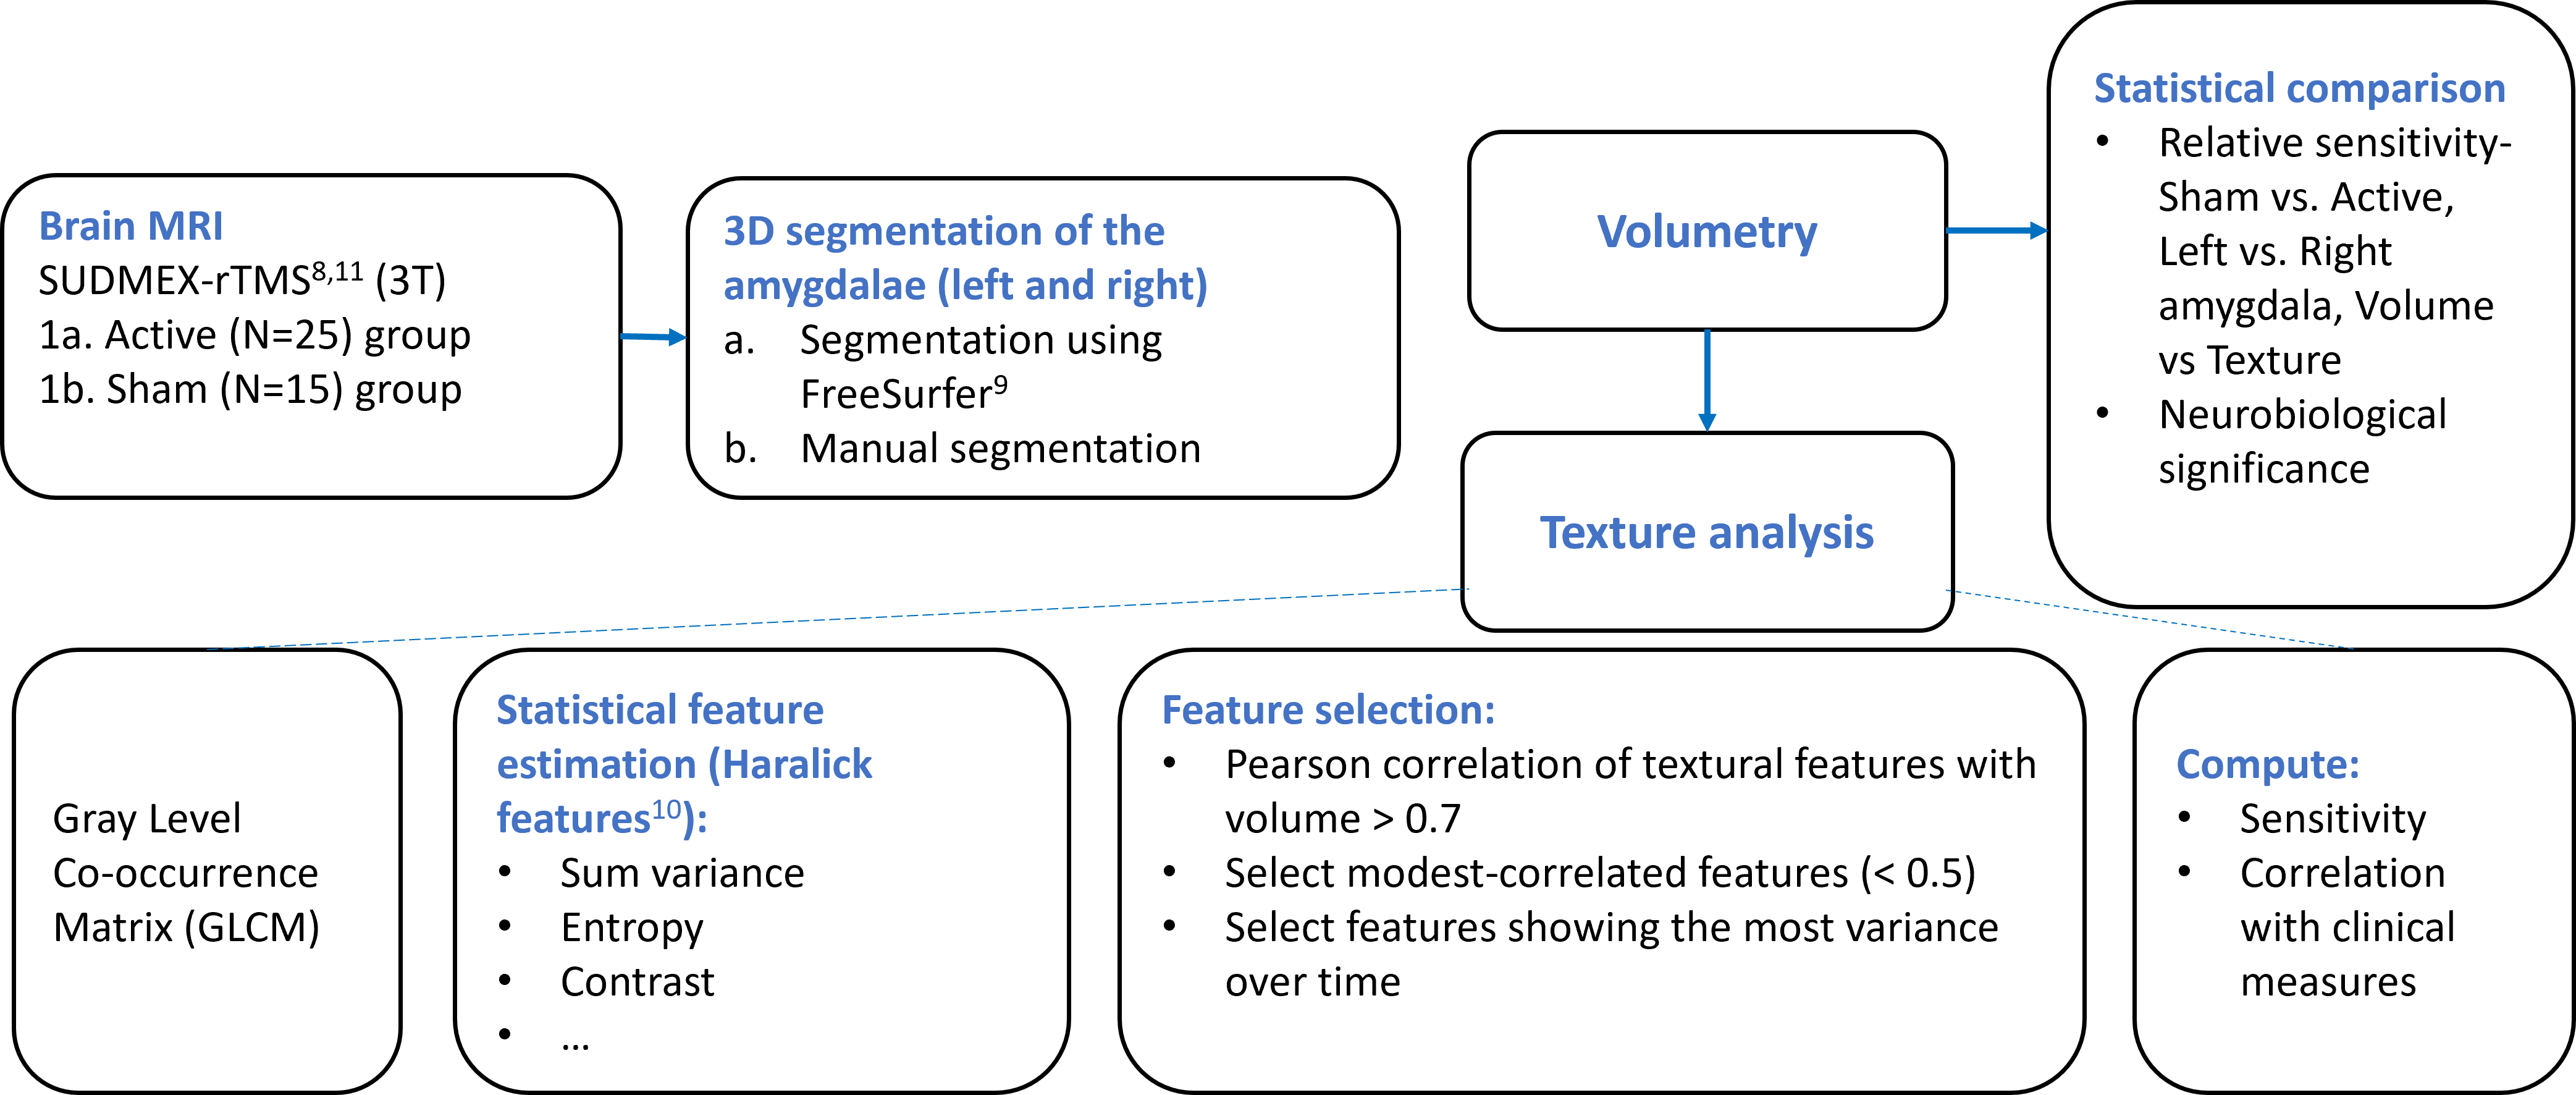
We analyzed 3D T1w FFE-SENSE MR images from the SUDMEX-rTMS dataset8,11 that comprised 53 participants, with 25 patients undergoing active TMS therapy at the left dorsal-prefrontal cortex and 15 patients receiving sham treatment at the left temporalis muscle over the course of one year. Imaging was performed at four time- points: baseline, three months, six months, and one year. To ensure data consistency, we excluded participants with incomplete MR data (i.e., no data beyond baseline) and those who reported receiving active treatment after the sham, to avoid confounding variables. We performed amygdala segmentation and volumetry using FreeSurfer's recon_all command. We verified the accuracy of amygdala segmentation and labels and calculated 14 Haralick textural features within this region of interest (ROI). To interpret volumetric and textural changes over time, we conducted a pilot study using the pipeline shown in Figure 1 with five subjects from a mixed cohort (comprising two receiving active treatment, two sham+active, and one sham). Our selection criteria included:1. Choosing features with a correlation with volumetric changes exceeding 0.7; 2. Selecting features with modest correlation (<0.5) from the first set; 3. Identifying features that exhibited greater sensitivity than volume.Temporal sensitivity was computed by the ratio of the difference in volumes between the baseline and another time point to the difference in time point (in months), followed by the average sensitivity of all the time points. The mean sensitivity for a cohort, active or sham, was the mean of all the average sensitivities. We processed the whole subset post-pilot study and compared the statistical features with corresponding volumetric measurements, left and right amygdalae, in both acute and maintenance phases in the active group.
Results
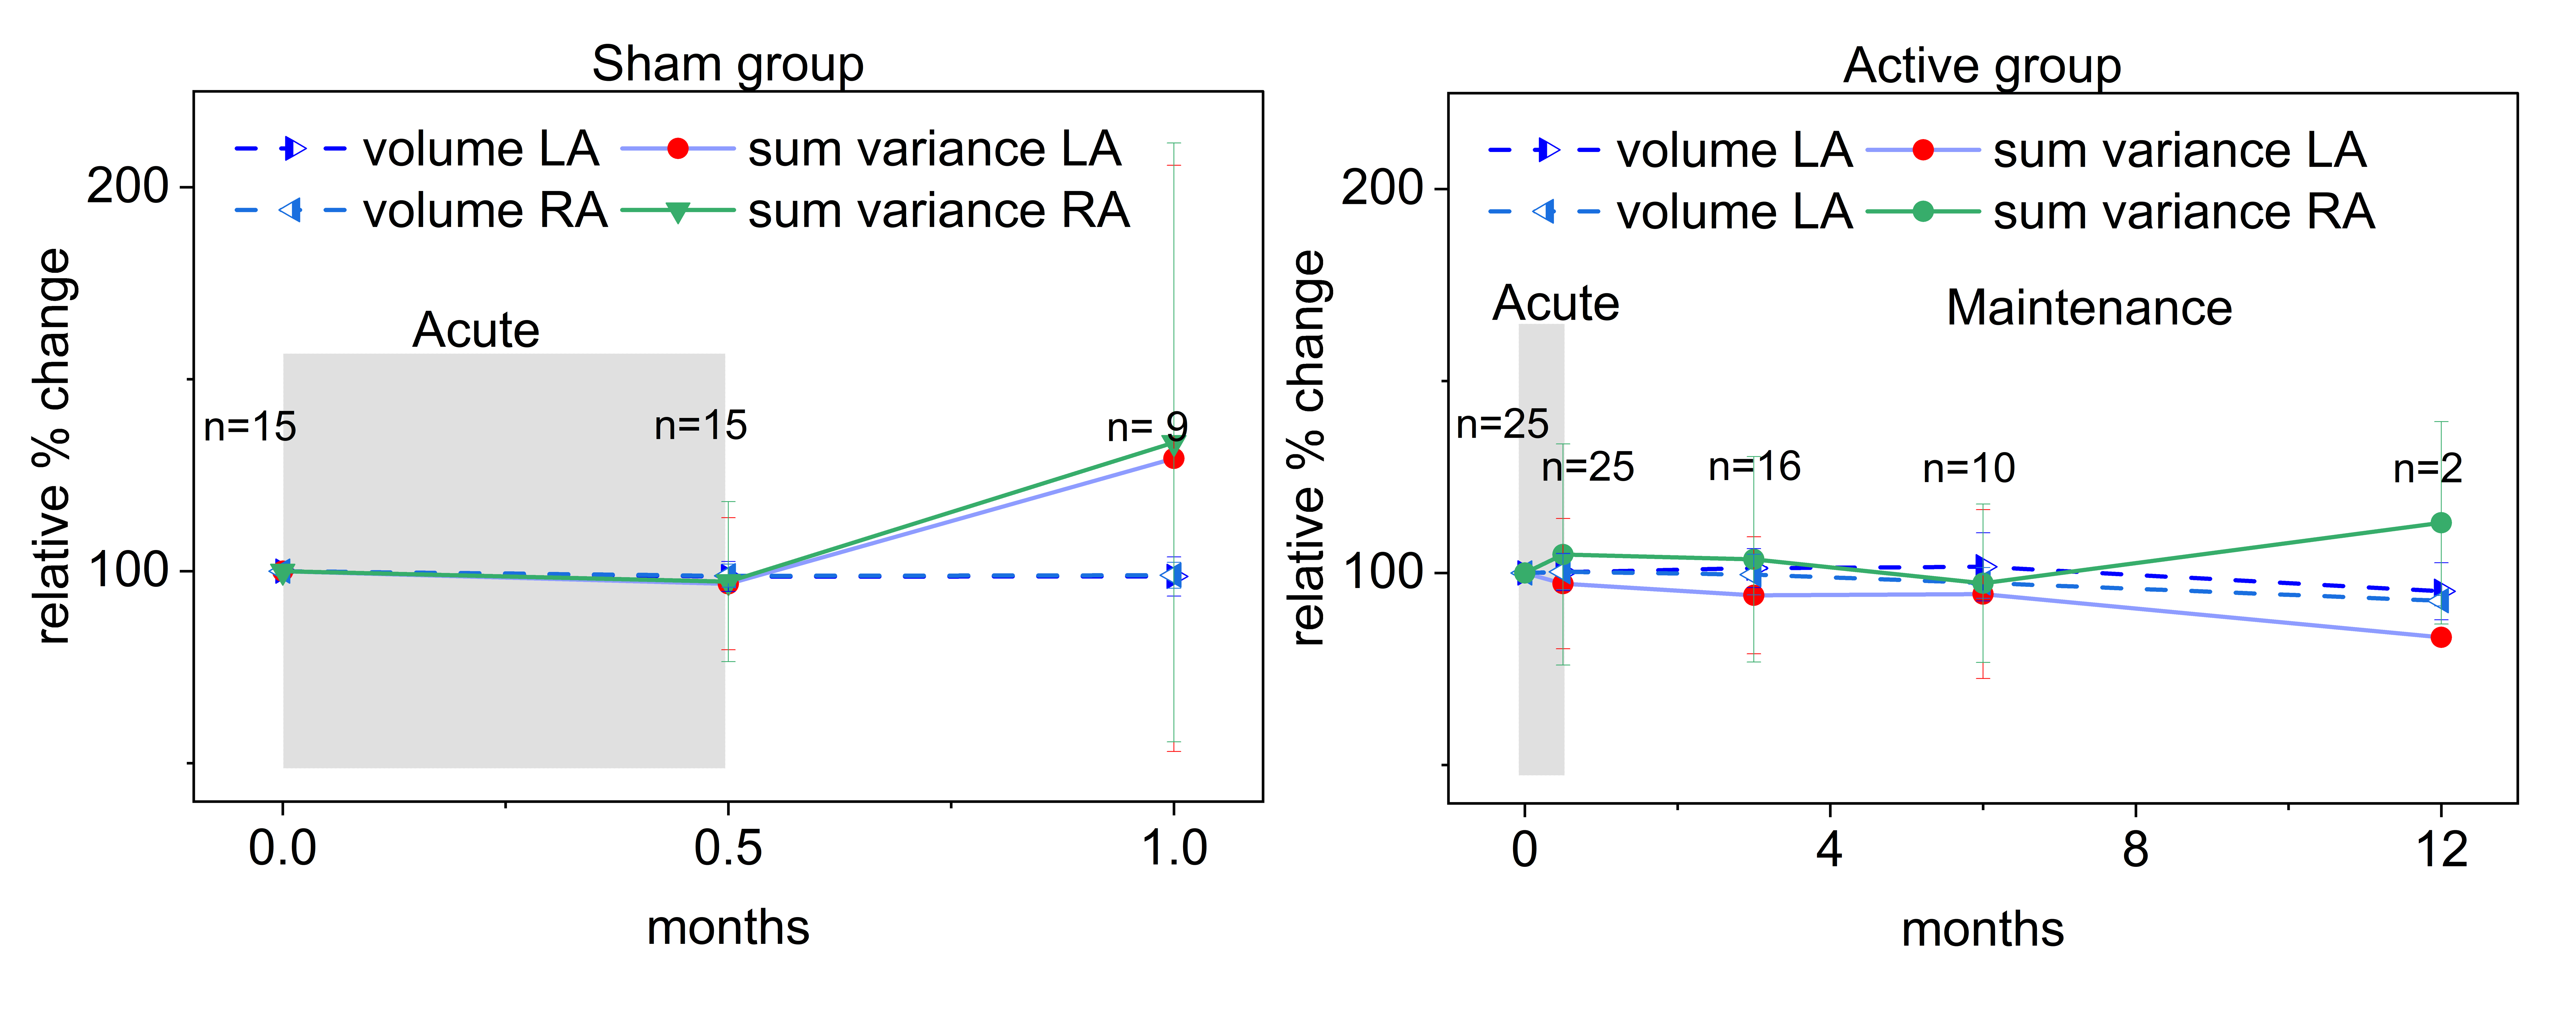
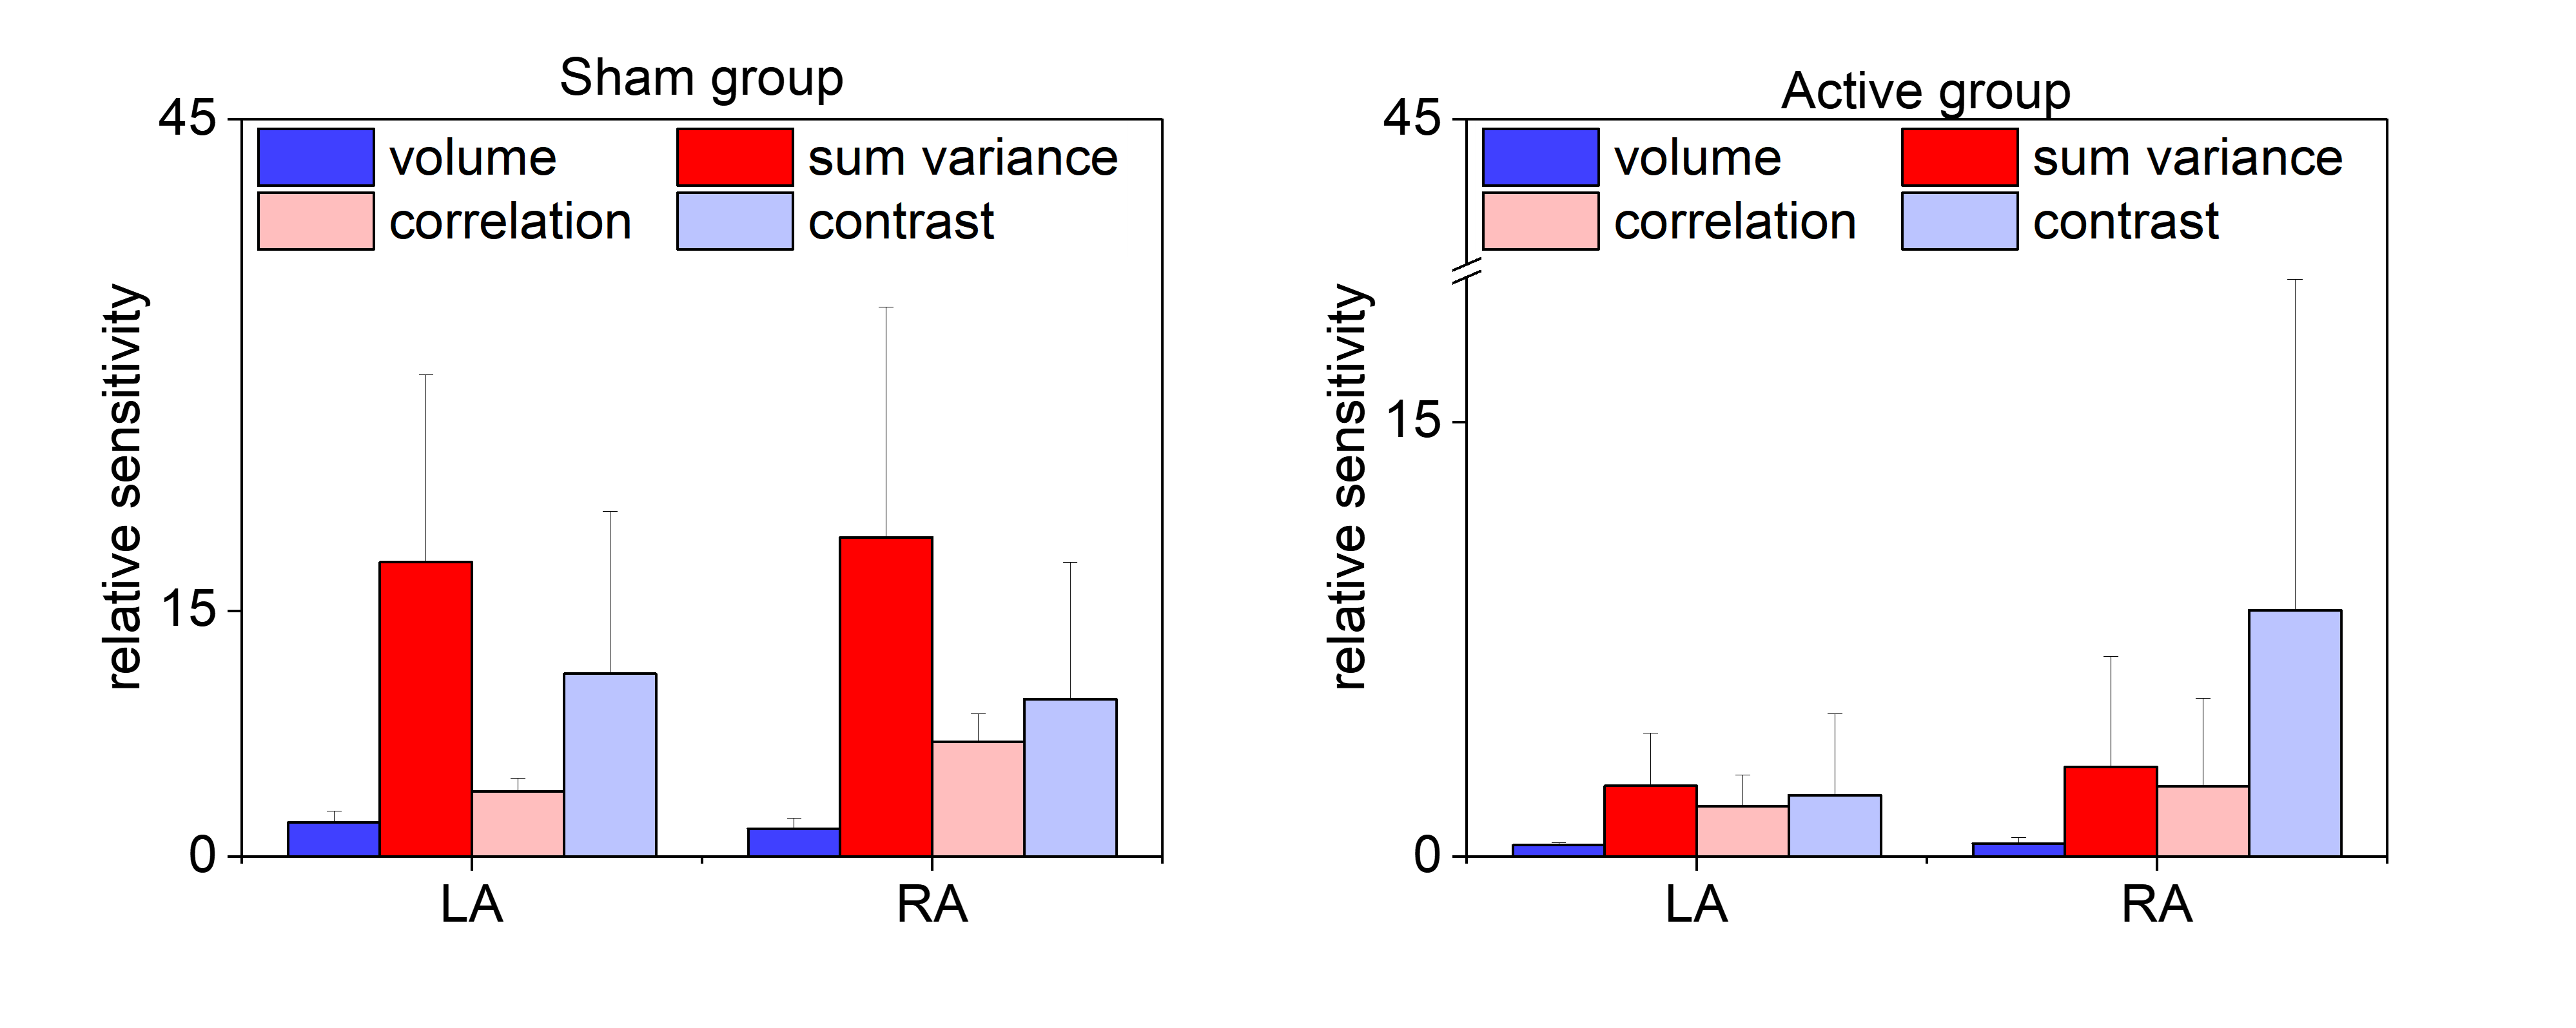
Three statistical features, correlation, sum variance, and contrast, met the three criteria for feature selection and demonstrated the most significant variations compared to the baseline. The histogram analysis of the ROI shows the variation in intensities at different time points. The Pearson correlation heatmap shown in Figure 2 was essential during the pilot study. We excluded the features < 0.7. We manually validated the presence of a positive correlation with volumetric changes in addition to the computed Pearson correlation coefficient to ensure fidelity. During the unblinded or open-label maintenance phase, Figure 4a,b illustrates a noticeable decrease in the slope as the number of months increased. In Figure 5a,b, it is evident that the selected textures exhibit a higher sensitivity when compared to the volume in both groups. In the active group, the sensitivity of the right amygdala was more than the left by 16% in volume, 300% in contrast, 40% in correlation, and 26.88% in sum variance. Overall, the relative sensitivities of the selected textures were greater than the volume. The textural features’ temporal sensitivity ranged from 343 - 1788% compared to corresponding volumetric measurements (see Figure 5).We observed different slopes as the participants transitioned from the acute to the maintenance phase; the percentage changes of the right amygdala increased from 35.5% to 50.6% (more than the left) after the maintenance phase. Although the difference in textural sensitivity in the maintenance phase dropped by 83% in the left amygdala, it was still greater than the left volume changes by 179%. However, the temporal difference in the right volume was 209.3 times greater than that in the right texture (sum variance) (see Figure 4).
Conclusion
We have verified that textural changes in the amygdala precede volumetric changes during repetitive transcranial magnetic stimulation therapy in a CUD cohort.Acknowledgements
Grant funding-
1. Faculty Idea Innovation Prize, Dr. Sairam Geethanath and Dr. Shilpa Taufique, 2022
2. Friedman Brain Institute Research Scholars Fellowship, Dr. Sairam Geethanath and Dr. Shilpa Taufique
3. CEPM-CTSA grant (PI: Dr. Sairam Geethanath)
References
1. Moeller SJ, Paulus MP: Toward biomarkers of the addicted human brain: Using neuroimaging to predict relapse and sustained abstinence in substance use disorder. Prog Neuro-Psychopharmacology Biol Psychiatry 2018.
2. Schmitgen MM, Niedtfeld I, Schmitt R, et al.: Individualized treatment response prediction of dialectical behavior therapy for borderline personality disorder using multimodal magnetic resonance imaging. Brain Behav 2019; 9.
3. Yip SW, Konova AB: Densely sampled neuroimaging for maximizing clinical insight in psychiatric and addiction disorders. Neuropsychopharmacology 2022.
4. Makris, N., et al., Decreased absolute amygdala volume in cocaine addicts. Neuron 2004, 44(4), pp.729-740.
5. Munshi, S et al., Cocaine and chronic stress exposure produce an additive increase in neuronal activity in the basolateral amygdala. Addiction biology 2021, 26(1), p.e12848.
6. Lee S, Lee H, Kim KW: Magnetic resonance imaging texture predicts progression to dementia due to Alzheimer’s disease earlier than hippocampal volume. J Psychiatry Neurosci 2020; 45.
7. Sørensen L, Igel C, Liv Hansen N, et al.: Early detection of Alzheimer’s disease using MRI hippocampal texture. Hum Brain Mapp 2016; 37.
8. Ruth
Alcala-Lozano et al., SUDMEX_TMS: The Mexican dataset of an rTMS clinical trial on cocaine use disorder
patients. OpenNeuro 2021. [Dataset] https://openneuro.org/datasets/ds003037/versions/1.0.0
9. Fischl, B., FreeSurfer. Neuroimage 2012, 62(2), pp.774-781.
10. Haralick, R.M., Shanmugam, K. and Dinstein, I.H., Textural features for image classification. IEEE Trans. Syst. Man. Cybern. 1973, (6), pp.610-621.
11. Garza-Villarreal,et al., Clinical and functional connectivity outcomes of 5-Hz repetitive transcranial magnetic stimulation as an add-on treatment in cocaine use disorder: a double-blind randomized controlled trial. Biol. Psychiatry: Cogn. Neurosci. Neuroimaging 2021, 6(7), pp.745-757.
Figures
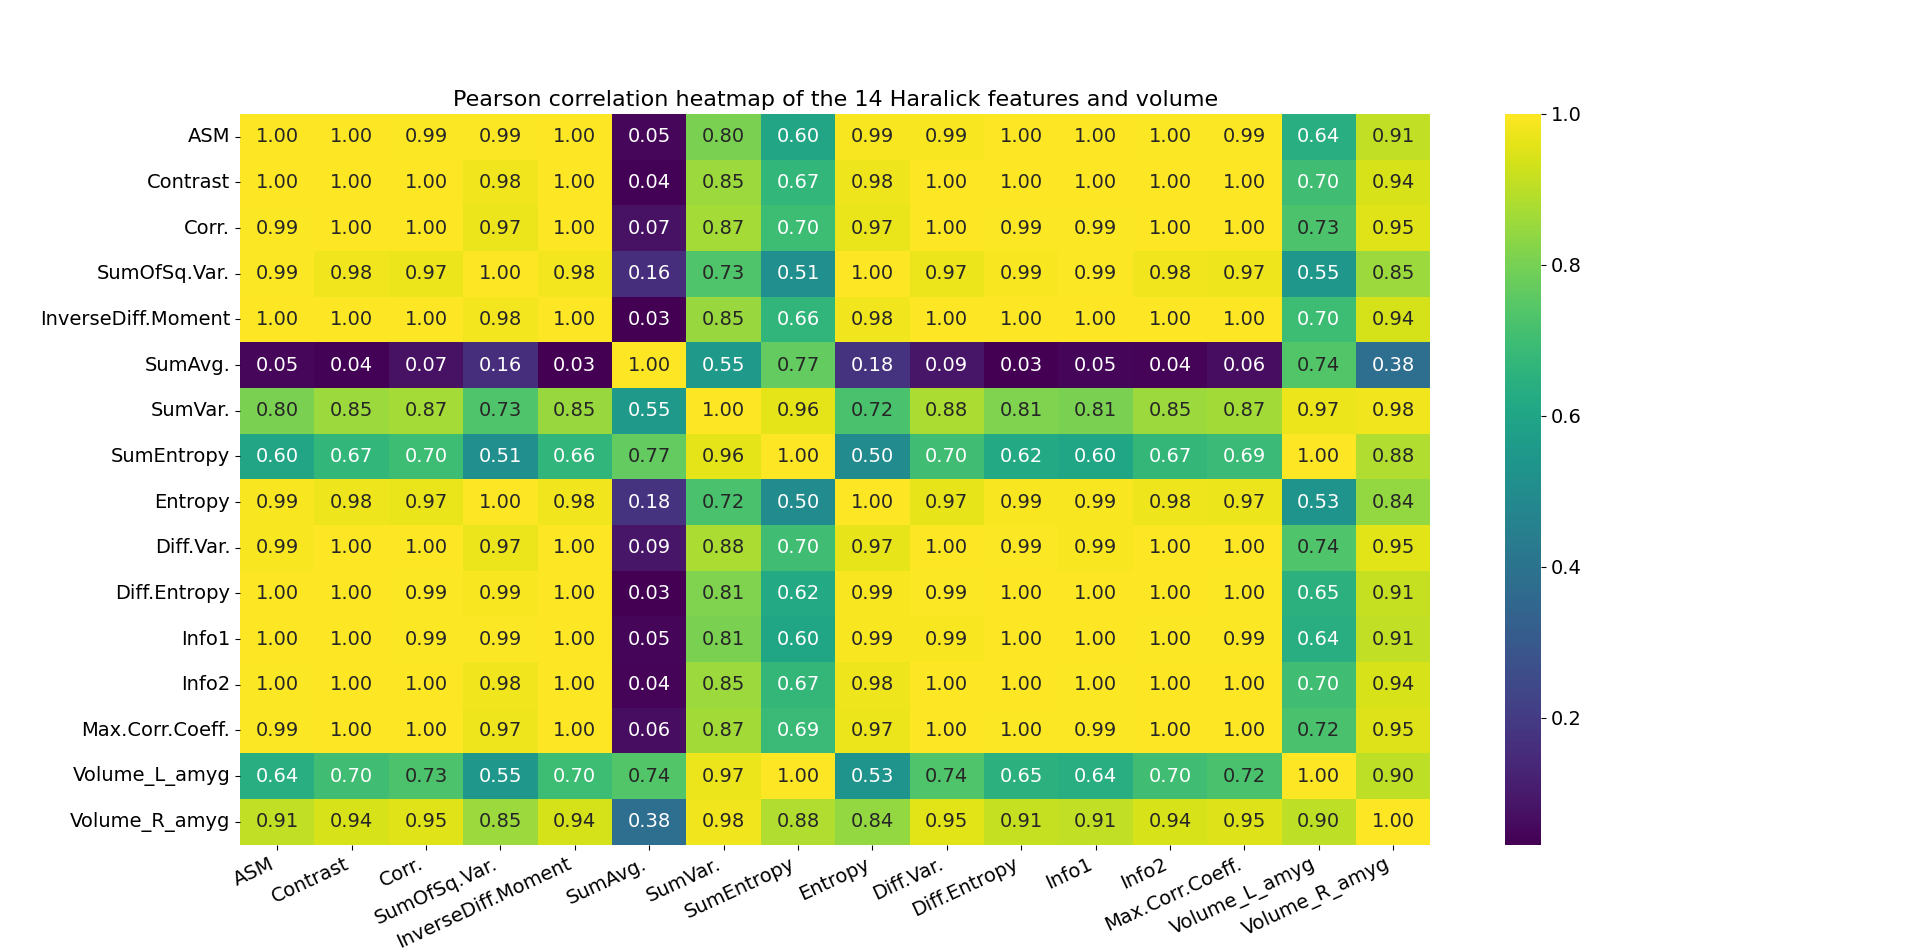
Pearson correlation heatmap of features and amygdala volume (left and right). We select the features > threshold (0.7) from the last two rows (shown in the red box) and shortlist the ones that are modestly correlated (<0.5) amongst themselves.