3093
Impact of Vessel Removal on Classification of Chronic Liver Disease using Radiomics Features and Quantitative T2 Mapping1Electrical & Computer Engineering, University of Arizona, Tucson, AZ, United States, 2Biomedical Engineering, University of Arizona, Tucson, AZ, United States, 3Medical Imaging, University of Arizona, Tucson, AZ, United States, 4Radiology, Houston Methodist Hospital, Houston, TX, United States
Synopsis
Keywords: Radiomics, Liver, Radiomics, Segmentation
Motivation: MRI radiomics with T2-mapping has been proposed to detect changes of chronic liver disease (CLD) but may be hampered by liver vasculature.
Goal(s): Our goal is to evaluate radiomics features of T2 maps and the impact of vessel removal on CLD classification.
Approach: T2 liver maps from a clinical cohort were analyzed using radiomics features and a T2 thresholding-based feature, followed by feature selection and random forest classification. Experiments were conducted on both full liver T2 maps and T2 maps with vessel removal using the Frangi filter.
Results: Vessel removal significantly enhanced CLD classification performance as measured by mean AUC.
Impact: Our findings have the potential for clinical translation to help establish MRI radiomics with T2-mapping for CLD diagnosis and treatment monitoring.
Introduction
Chronic Liver Disease (CLD) is a global crisis. Early CLD is clinically silent, and we lack sensitive diagnostics. Quantitative T2 mapping has demonstrated its utility in capturing intricate liver tissue characteristics for detection of of CLD1,2,3,4. However, normally occurring large portal and hepatic veins in the liver can potentially compromise T2 mapping of CLD by introducing T2 values that do not represent liver parenchyma or CLD changes2. In this work, we determine the radiomics features of T2 maps to investigate the impact of vessel removal on CLD classification.Methods
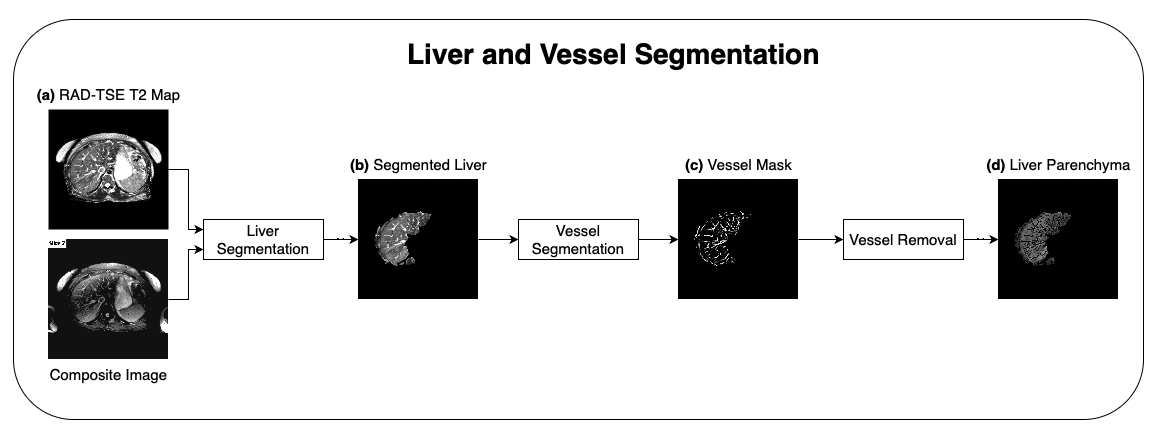
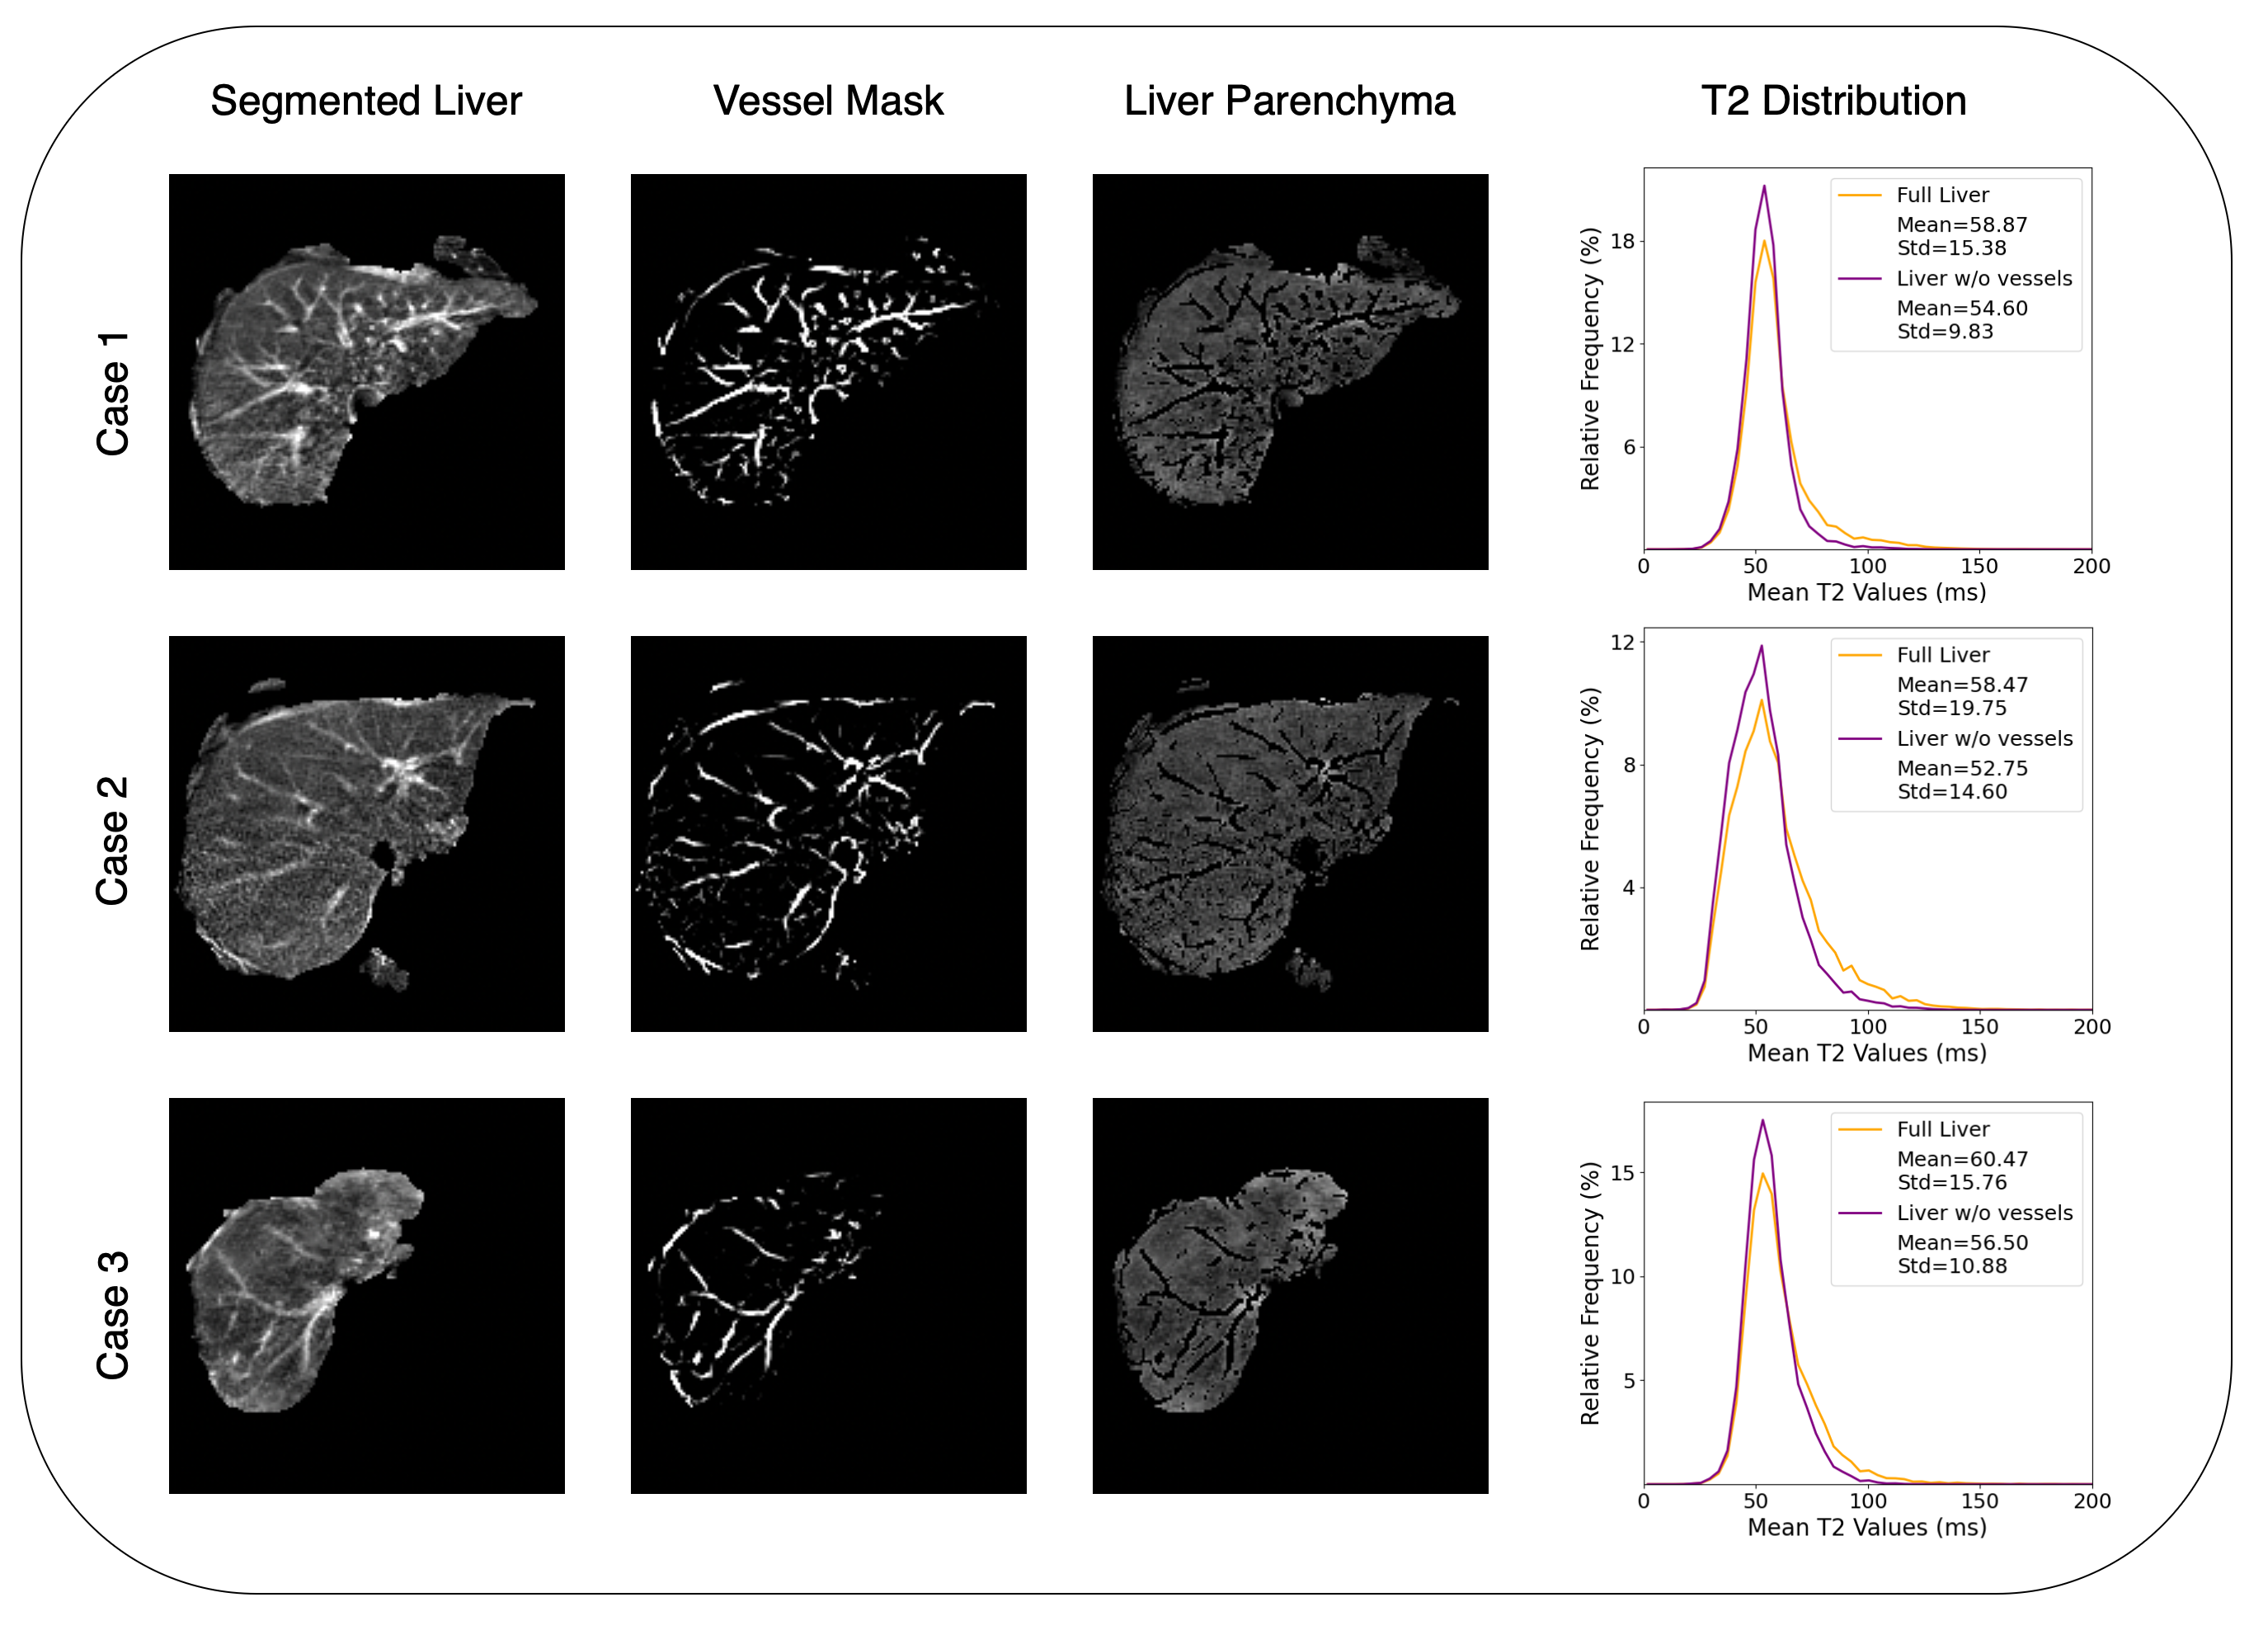
Following the approval of the local institutional review board, abdominal imaging was performed on 86 clinical subjects using the 2D radial turbo spin echo sequence5 on a 1.5T scanner with the following sequence parameters: field of view=40cm, echo train length=32, echo spacing=6.7ms, base resolution=256, radial views=192, TR=2500ms, slice thickness=8mm, number of slices=21, and a breath hold time 18 seconds. T2 maps were obtained using locally low-rank regularization6 and co-registered composite images were also reconstructed using radial k-space data for all echoes. Radiology reports, which were based on the full abdominal imaging protocol, classified 28 of the 86 subjects as having CLD, and this classification was used as labels in our study.The liver segmentation process comprised two distinct phases. Using the co-registered composite images and T2 maps (Fig.1a), radiologists performed liver segmentation to isolate the liver from the surrounding tissue. The segmented liver (Fig.1b) was then used as input to the vessel segmentation step, which utilized the Frangi7 filter. The Frangi filter is a technique that utilizes the eigenvalues of the local Hessian matrix to identify tubular structures using a vesselness function. The vessel mask (Fig.1c) obtained using the Frangi filter was used to identify and remove the vessels, providing the segmented liver parenchyma for further processing. Sample of vessel maps are shown in Fig.2 for different cases.
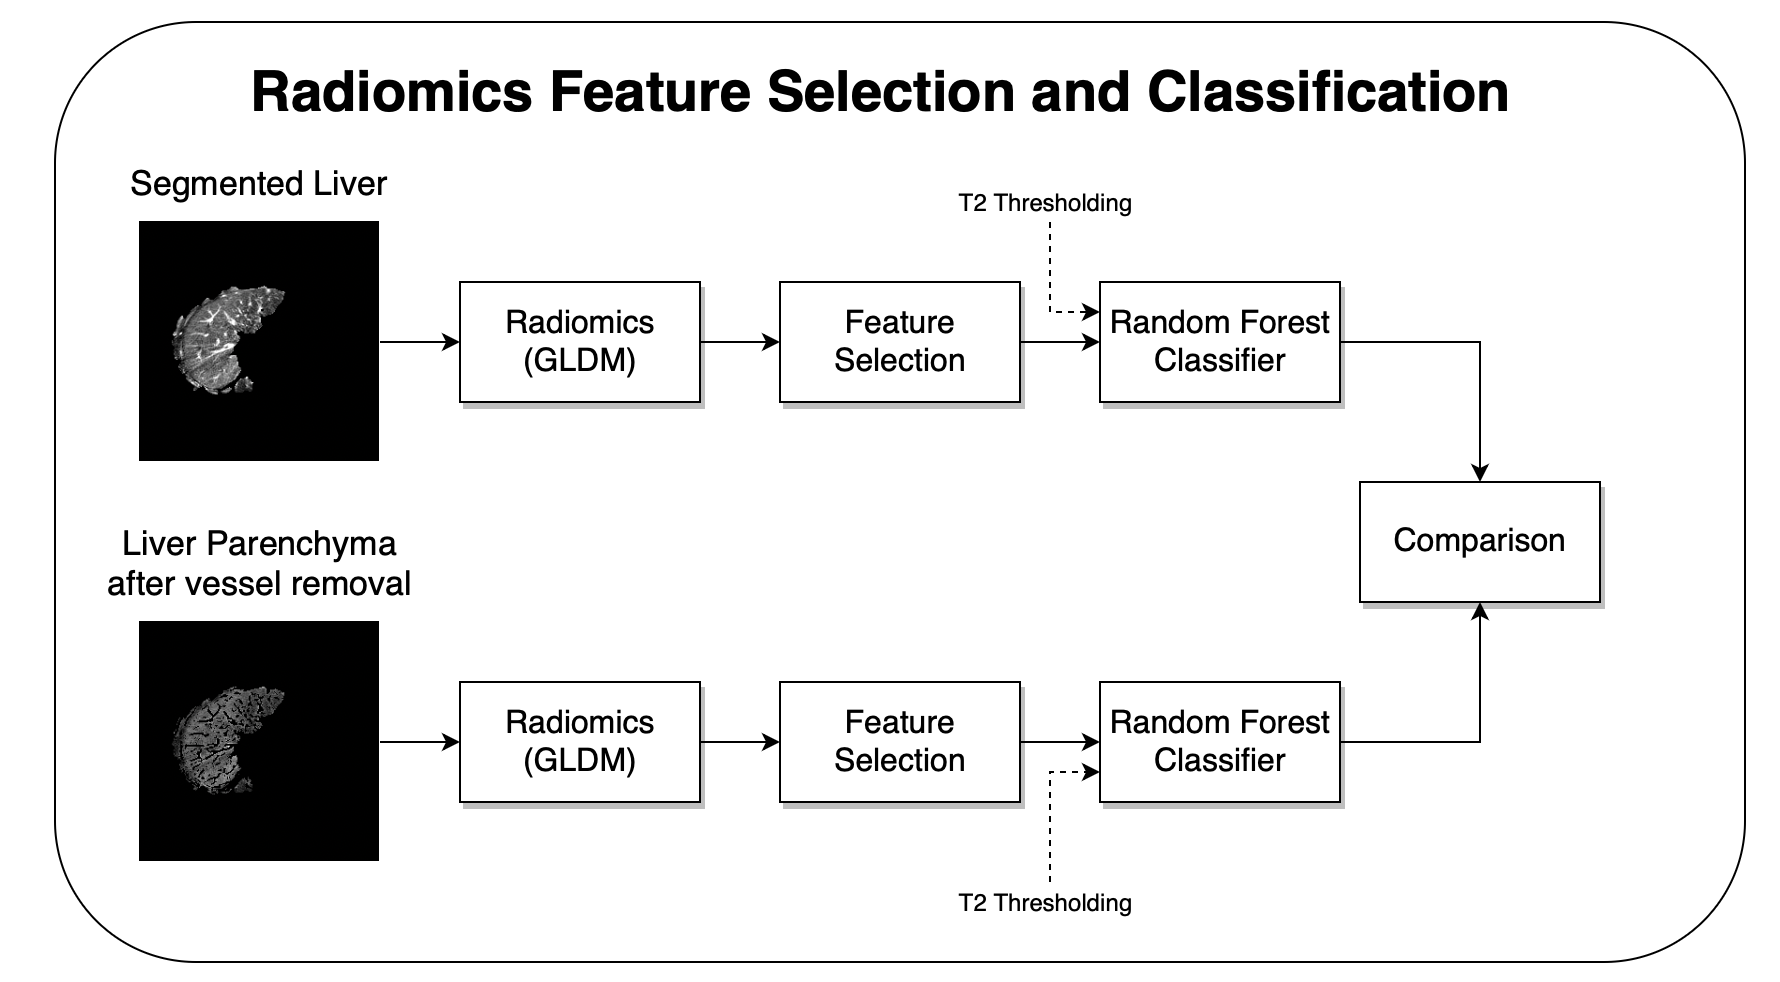
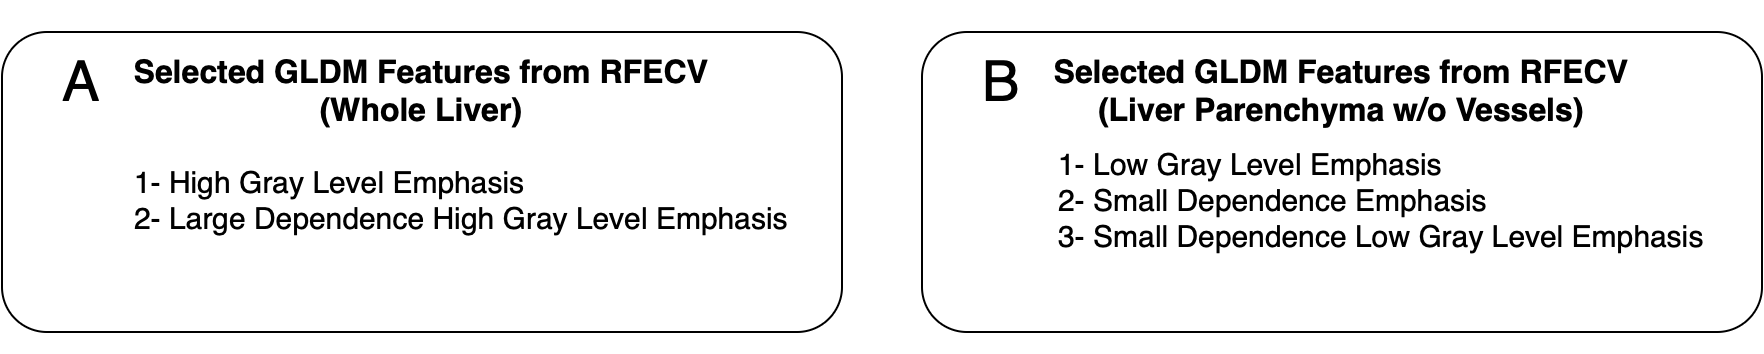
Early studies have indicated that texture-based features play a crucial role in classification of CLD3,4. Consequently, we have employed Gray Level Dependence Matrix (GLDM) features in our radiomics analysis as they provide valuable insights into texture classification8. Fourteen GLDM features were used in the feature selection process, which utilized the Recursive Feature Elimination with Cross-Validation (RFECV) method to identify the most significant features specifically tailored to the CLD classification task in our study. 5-fold cross-validation and a Random Forest classifier (maximum depth=7, number of estimators=100) were used. The feature selection process was carried out separately for features obtained from the entire liver and the liver parenchyma after the vessels were removed (Fig.3). The resulting features in each case are shown in Fig.4.
In addition to radiomics features, earlier studies9 have shown that “percentage of liver T2 values greater than a threshold” is an informative feature for CLD classification. We have also explored the use of this feature in combination with GLDM features. Through systematic analysis, we have determined that T2 threshold values of 88 ms and 91 ms provided the optimal CLD classification performance for this feature in our study as measured by the Area Under the Receiver Operation Characteristic (ROC) Curve (AUC) for the whole liver vs. the liver parenchyma after vessel removal, respectively. We have combined this feature with the selected GLDM features in each case and repeated the ROC analysis using Random Forest Classifier with 5-fold cross-validation. All tests were repeated 50 times. Mean and standard deviation of AUC values were used for subsequent analysis.
Results
Fig.2 shows vessel segmentation and removal results on slices selected from three different cases. It can be observed that the proposed method can identify and remove vessels effectively in T2 maps of the liver.Fig.5a compares the ROC curves obtained using the GLDM features selected using RFECV. A comparison of the mean AUC values (0.67 vs 0.68) suggests that vessel removal may provide a modest improvement in this case. Fig.5b shows the same comparison when the T2 thresholding feature is combined with the corresponding GLDM features. It can be observed that this additional feature provides a small improvement when the entire liver is used for feature extraction. However, when this feature is combined with the selected GLDM features obtained using the liver parenchyma after vessel removal, a substantial improvement in mean AUC is observed (0.68 vs. 0.75).
Conclusions
Our study demonstrated that removing vessels from T2 maps, coupled with the use of GLDM radiomics features and our custom T2 thresholding feature provided an improvement in mean AUC for CLD classification. The fully automated nature of the proposed vessel removal holds promise for its incorporation in clinical settings.Acknowledgements
We would like to acknowledge grant support from the National Institutes of Health (CA245920 and EB031894) and the Technology and Research Initiative Fund (TRIF) Improving Health Initiative.References
1. Wang, X, et al. Quantitative T2 mapping of rats with chronic hepatitis. Experimental and Therapeutic Medicine 21.3. 2021: 1-1.2. Pandey, A, et al. Automated segmentation of liver parenchyma and blood vessel with in vivo radial Gradient and Spin-Echo (GRASE) datasets for characterization of diffuse liver disease. Proceedings of the 21st scientific meeting, International Society for Magnetic Resonance in Medicine, Salt Lake City. Vol. 1528. 2013.
3. Li, Z, et al. Wavelet analysis of liver fibrosis. Proceedings of the 22nd Annual Meeting of ISMRM. Vol. 3652. 2014.
4. Zhao, R, et al. Use of texture analysis on noncontrast MRI in classification of early stage of liver fibrosis. Canadian Journal of Gastroenterology and Hepatology 2021. 2021.
5. Altbach, Maria I., et al. "Radial fast spin‐echo method for T2‐weighted imaging and T2 mapping of the liver." Journal of Magnetic Resonance Imaging: An Official Journal of the International Society for Magnetic Resonance in Medicine 16.2, 2002: 179-189.
6. Tamir, J. I., et al. "T2 shuffling: sharp, multicontrast, volumetric fast spin‐echo imaging." Magnetic resonance in medicine 77.1, 2017: 180-195.
7. Frangi, A. F, et al. Multiscale vessel enhancement filtering. Medical Image Computing and Computer-Assisted Intervention—MICCAI’98: First International Conference Cambridge, MA, USA, October 11–13, 1998 Proceedings 1. Springer Berlin Heidelberg. 1998.
8. Sun, C., & Wee, W. G. Neighboring gray level dependence matrix for texture classification. Computer Vision, Graphics, and Image Processing 23.3, 1983: 341-352.
9. Graff C. Parameter Estimation in Magnetic Resonance Imaging. (Doctoral dissertation, University of Arizona), 2009.
Figures
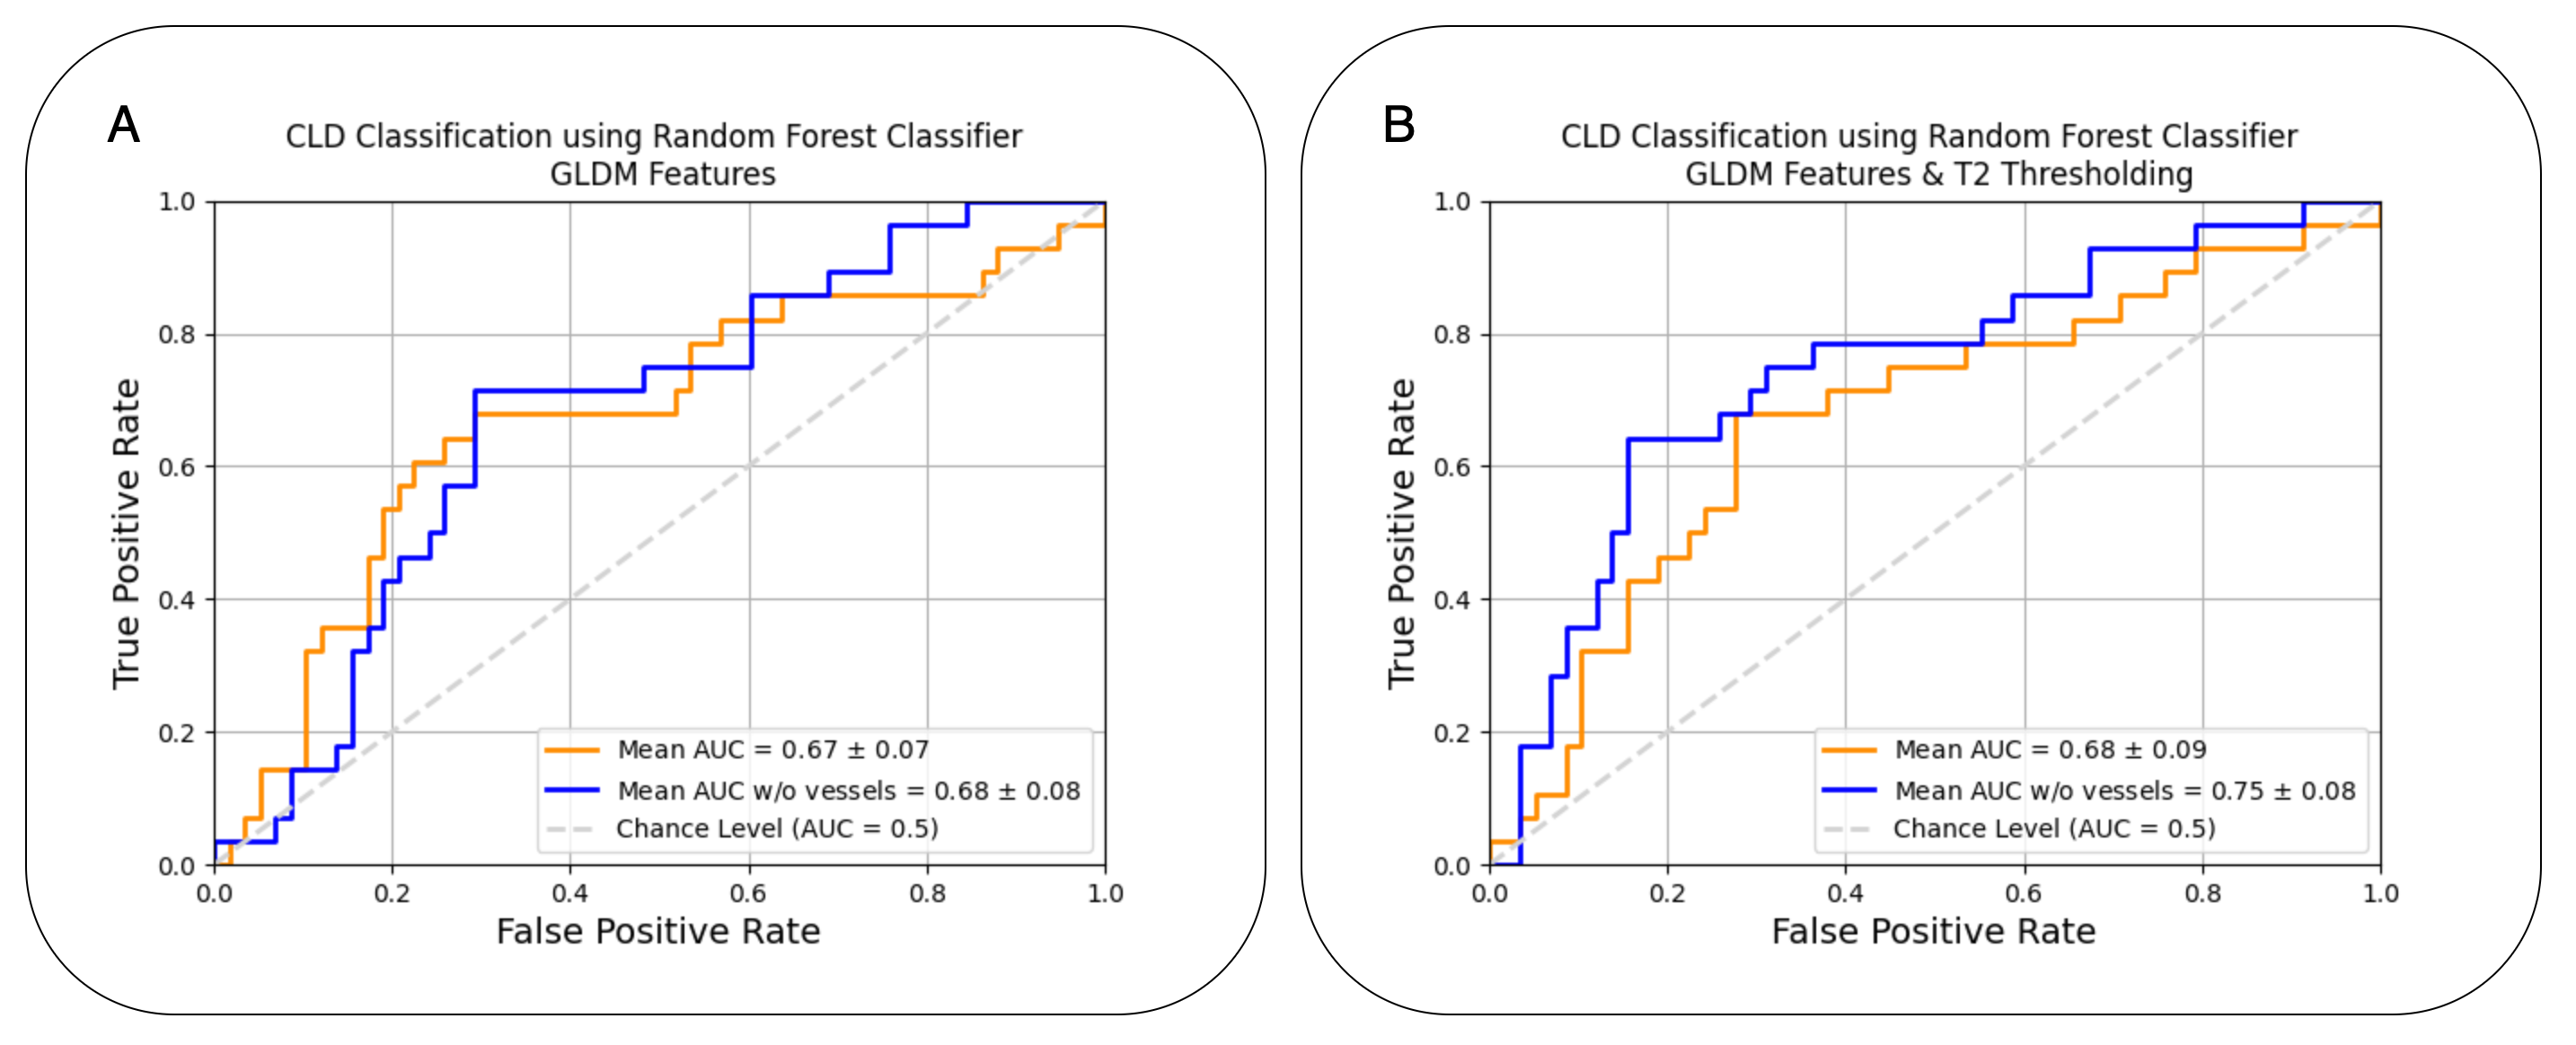
A: ROC Curves using GLDM features only.
B: ROC Curves using GLDM features & T2 Thresholding.