3092
Correlating radiomic features of the prostate transitional zone with peripheral blood PSA levels1The University of Notre Dame, Sydney, Australia, 2The Prince of Wales Hospital, Randwick, Australia, 3The University of New South Wales, Sydney, Australia
Synopsis
Keywords: Radiomics, Radiomics, Prostate, PSA
Motivation: In enlarged prostates, attributing increased PSA levels solely to benign hyperplasia is difficult, even with reassuring imaging features. This results in diagnostic ambiguity when PSA is elevated.
Goal(s): Create a radiomic signature for accurate PSA level prediction using only imaging characteristics
Approach: T2-weighted prostate images from 100 patients with PIRADS ≤2 were segmented into transitional and peripheral zones using 3D Slicer. Radiomic analysis of transitional zone segments identified MRI features associated with serum PSA.
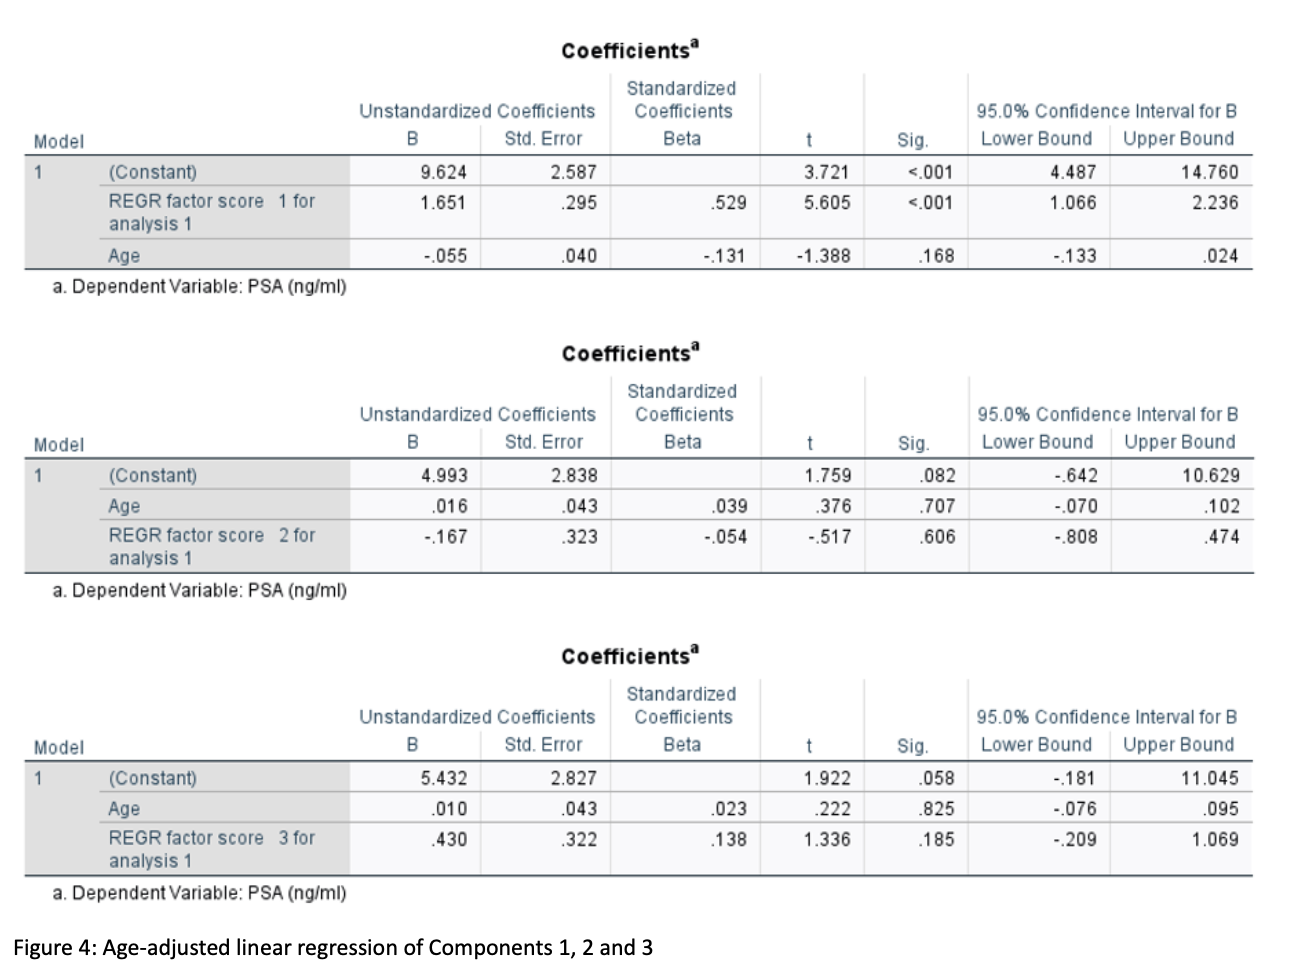
Results: Principal component analysis identified one age-adjusted, independent predictor of PSA levels among seventeen radiomic features. This signature had a significant association with PSA (b=1.651, 95% CI: 1.07-2.24, p<0.001).
Impact: The predictive value of our component will allow physicians to identify PSA levels which are not representative of their imaging characteristics which may better inform the need for further investigation
Introduction and objective:
Currently little is known on how patients' PSA levels relate to many radiographic features of the transitional zone (TZ) of the prostate on MRI. Radiomic analysis can produce quantitative features, some of which are not appreciable to the human eye. If the features of an enlarged benign transitional zone, as seen in benign prostatic hyperplasia (BPH), can be quantified and correlated to patient PSA levels then a new determination can be made for the acceptable range of PSA for that specific patient. Radiomic features of the TZ when combined with the PSA level may then allow us to stratify the risk of prostate cancer in that individual. This would be important in assessing indeterminate lesions discovered on MRI, such as PIRAD 3 lesions, or may prompt a radiologist to look harder in a large prostate gland for such lesions. This study aims to create predictive radiomic features and a signature of a combination of features to estimate PSA levels in patients with enlarged prostates, and therefore stratify risk if there is a discrepancy between the predicted and measured PSA.Methods:
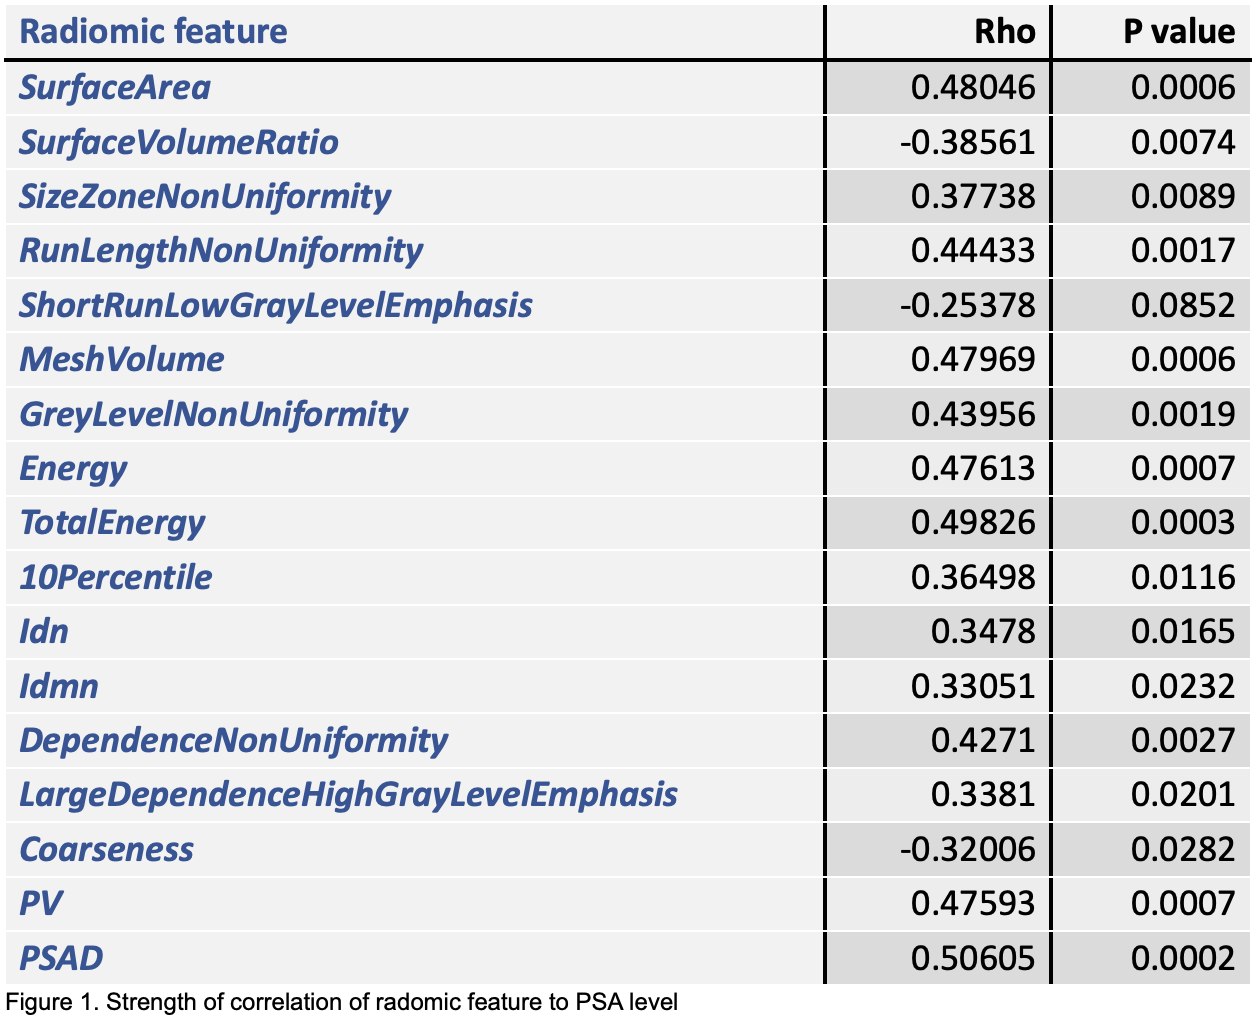
This is a single-centre, retrospective study of MRI Images of 100 patients who underwent MRI examination to assess for prostate cancer. Exclusion criteria were PIRADS 3-5, previous diagnosis of prostate cancer, prior prostate surgery and use of 5-alpha-reductase inhibitors. For all patients, age, prostate volume, PSA, free PSA and PSA density were collected. The T2 weighted axial images were anonymised and segmented using 3D Slicer into transitional and peripheral zones. The 3D segmented TZs were then analysed using the radiomics package within 3D Slicer and the subsequent data was exported for analysis. 104 features were generated, including shape, 1st and 2nd order statistical features. A univariate analysis was performed on the radiomics features from the transitional zone against PSA to identify features with significant correlation to PSA [Figure 1]. A mulit-variable linear regression model was not viable due to high collinearity between many radiomic features. A principal components analysis was therefore employed to address the multicollinearity and identify the underlying factors which might influence PSA. The extracted components were individually used as age-adjusted independent variables in a linear regression model with PSA as the dependent variable.Results:
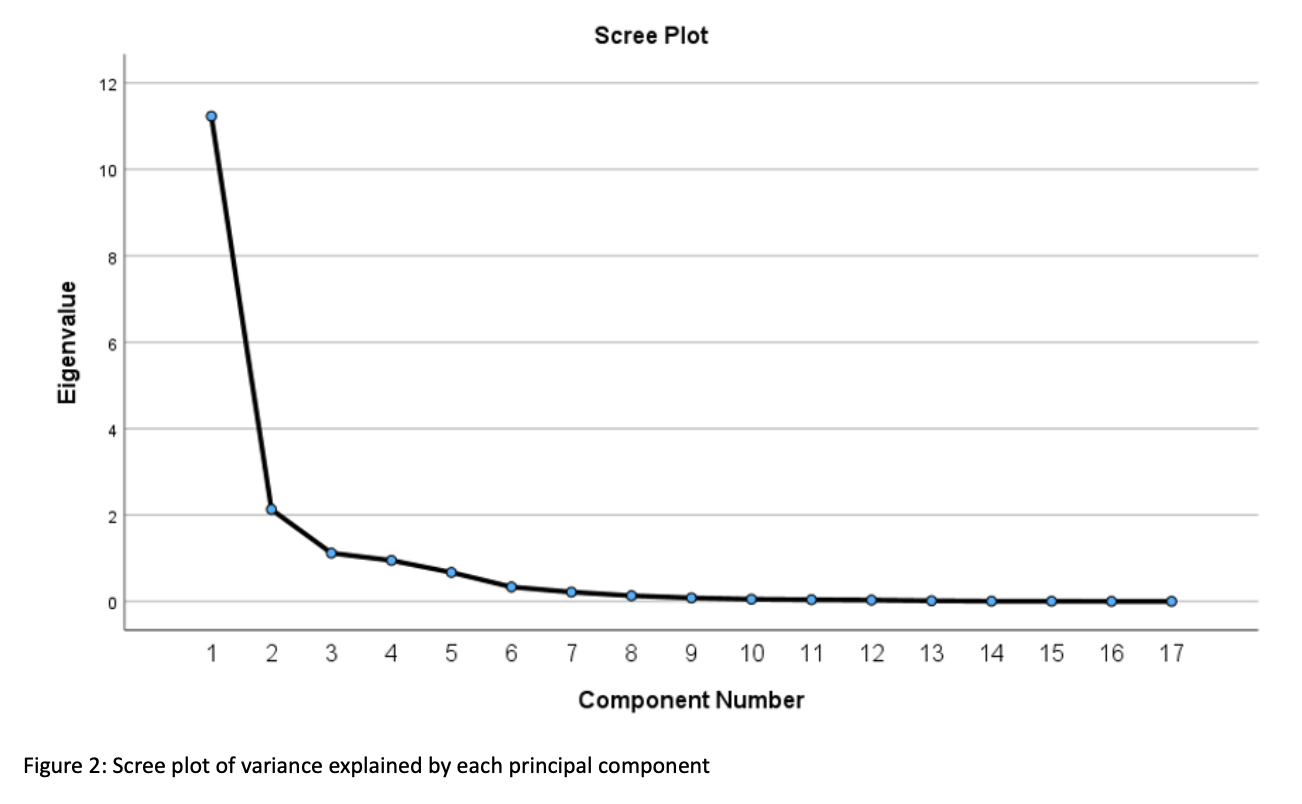
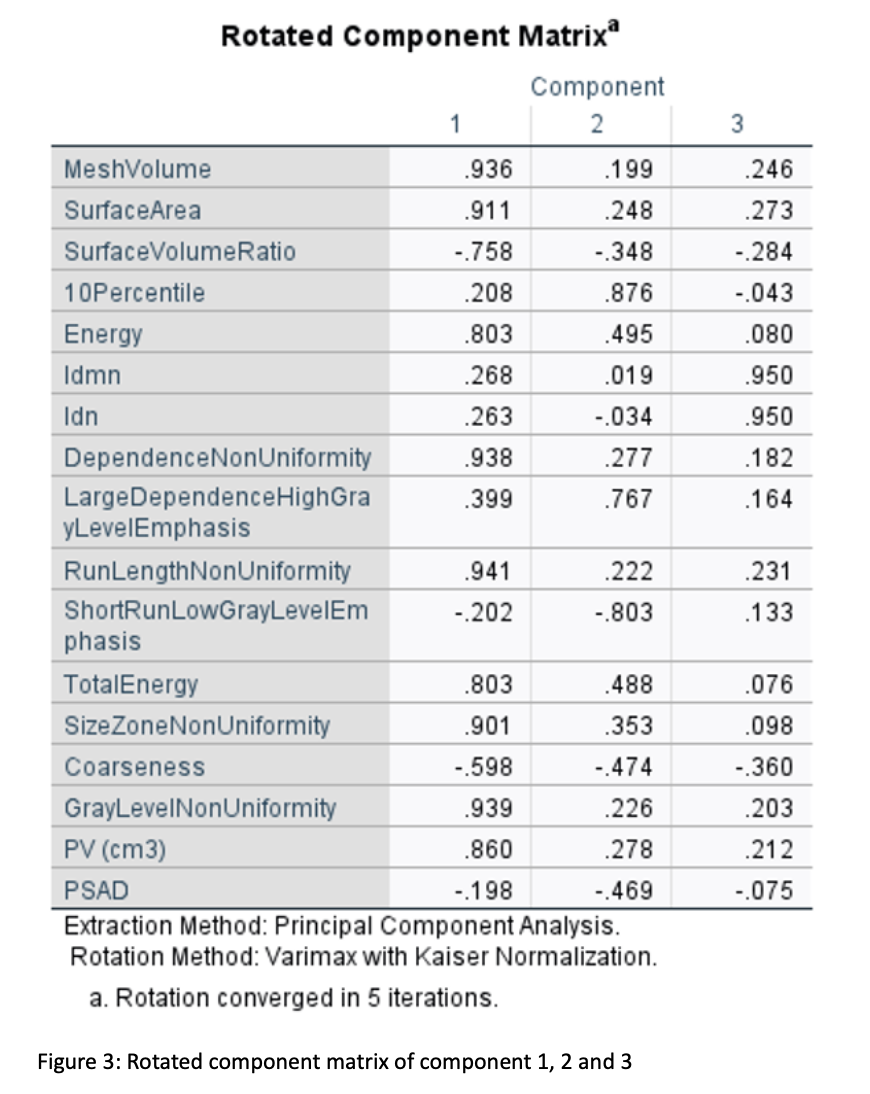
Of the 104 radiomic features were initially analysed, 17 were found to be statistically significantly associated with PSA (p<0.05). The strength of association of these features are displayed in Figure 1, and show significant positive and negative correlations to PSA with Rho values ranging from -0.38561 to 0.50605 and p values from 0.0852 to 0.0002. The principal components analysis of the radiomic features revealed three components explaining 85.2% of the total information [Figure 2]: Component 1 was characterised by MeshVolume, SurfaceArea, SurfaceVolumeRatio, Energy, DependenceNonUniformity, RunLengthNonUniformity, TotalEnergy, SizeZoneNonUniformity, Coarseness, GrayLevelNonUniformity, and PV(cm3); Component 2 by 10Percentile, LargeDependenceHighGrayLevelEmphasis, and ShortRunLowGrayLevelEmphasis; and Component 3 by Idmn and Idn [Figure 3]. In age-adjusted linear regression models, only Component 1 was independently associated with PSA (with a coefficient b=1.651, 95% CI: 1.07-2.24, p<0.001). Component 2 and Component 3 were not independent predictors of PSA (p=0.606 and p=0.185 respectively). [Figure 4.]Conclusion:
We identified 17 radiomic features which are statistically significantly correlated with patient serum PSA levels. Factor analysis revealed a Component that was an age-adjusted independent predictor of PSA levels. This Component can act as a predictive signature which may estimate a PSA range corrected for each patient using their T2 weighted axial MRI sequence. For every one-unit increase in the value of this Component, the PSA level is expected to increase by a factor of 1.651 ng/mL2, assuming all other factors remain constant. Using this radiomic signature may allow physicians to better interpret serum PSA levels and distinguish those with PSA levels that are unaccounted for by their radiographic appearance. This tool holds promise for improving diagnostic and prognostic strategies in patients with prostatic disease.Acknowledgements
No acknowledgement found.References
No reference found.Figures