3089
Diffusion kurtosis imaging indicates abnormal white matter tract integrity in children with autism spectrum disorders.1the Third Affiliated Hospital of Zhengzhou University, Zhengzhou, China
Synopsis
Keywords: White Matter, Pediatric, autism spectrum disorders;Tract-Based Spatial Statistics
Motivation: Many children with autism spectrum disorders(ASD) do not exhibit typical clinical manifestations in their early years, making early diagnosis challenging.
Goal(s): This study aimed to characterize changes in the brain microstructure of children with ASD through the use of white matter tract integrity (WMTI) metrics.
Approach: Whole-brain and ROI-based methods were applied to analyze differences in DKI-based WMTI metrics between children with ASD and healthy children.
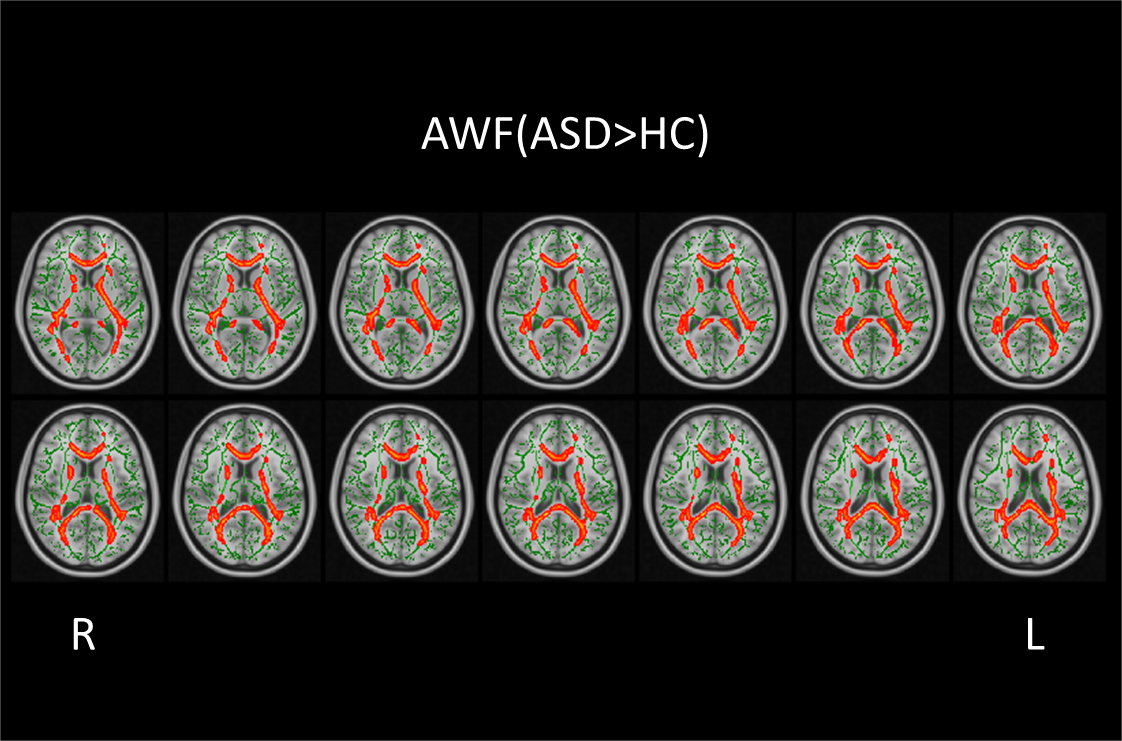
Results: The results revealed that axonal water fraction (AWF) was significantly elevated in the bilateral cerebral hemispheres of children with ASD. Quantitative analysis of the corpus callosum demonstrated its ability to distinguish between ASD and healthy children.
Impact: New WMTI metrics enhance our understanding of the underlying pathomechanisms of ASD and could serve as early biomarkers for microstructural changes in the brain of ASD.
Introduction
Autism spectrum disorders (ASD) are primarily characterized by impairments in social communication and interaction, repetitive restricted behaviors, and limited interests.1 ASD has a prevalence ranging from 1% to 2%, and its specific neuropathological mechanisms remain unclear, making its early diagnosis and intervention difficult. Traditional DTI indicators lack specificity in microstructural analysis and cannot accurately characterize the pathological changes in ASD.DKI can quantify white matter tract integrity (WMTI) metrics, including intra- and extra-axonal diffusivities and axonal water fraction (AWF), demonstrating higher specificity for microstructural assessment than traditional DTI techniques. Our aim was to explore whether children with ASD exhibit distinct abnormalities in white matter microstructure and whether WMTI metrics can distinguish between ASD and healthy children.Methods
Parents of all participants provided written informed consent, and the study was approved by the Ethics Review Committee. A total of 65 participants were enrolled in this study, comprising 37 individuals with ASD (36.70 ± 10.74 months) and 28 age- and sex-matched healthy controls (HCs, 36.21 ± 12.56 months). All patients met the DSM-5 (Diagnostic and Statistical Manual of Mental Disorders-V)2 diagnostic criteria. All MR examinations were performed on a 3.0T MR scanner (Signa Pioneer, GE Healthcare, Milwaukee, WI) with a standard 16-channel phased-array head coil. All participants underwent axial DKI sequence scanning with the following scanning parameters: TR/TE=8200/99ms; FOV=200×200 mm2; matrix size=128×128; slice thickness=4.0 mm; slice number=30; flip angle= 90; number of excitations=1; acquisition time was 7 min and 23 s; and three b values (0, 1000, and 2000 s/mm²) along 25 gradient encoding directions for each non-zero b value. Skull-stripping and distortion correction of DKI data were performed using FSL(FMRIB Software Library, version 6.0.5).WMTI metrics including axonal water fraction (AWF), intra-axonal diffusivity (Daxon ), axial diffusivity of extra-axonal space (De, axial ), radial diffusivity of extra-axonal space (De, radial) and tortuosity of extra-axonal space (Tort) were obtained by using Pydesigner software3. Tract-Based Spatial Statistics(TBSS)4 was employed for whole-brain analysis in both groups. Quantitative and categorical data were analyzed using SPSS software(version 23.0, IBM Corp., Armonk, NY, USA).Result
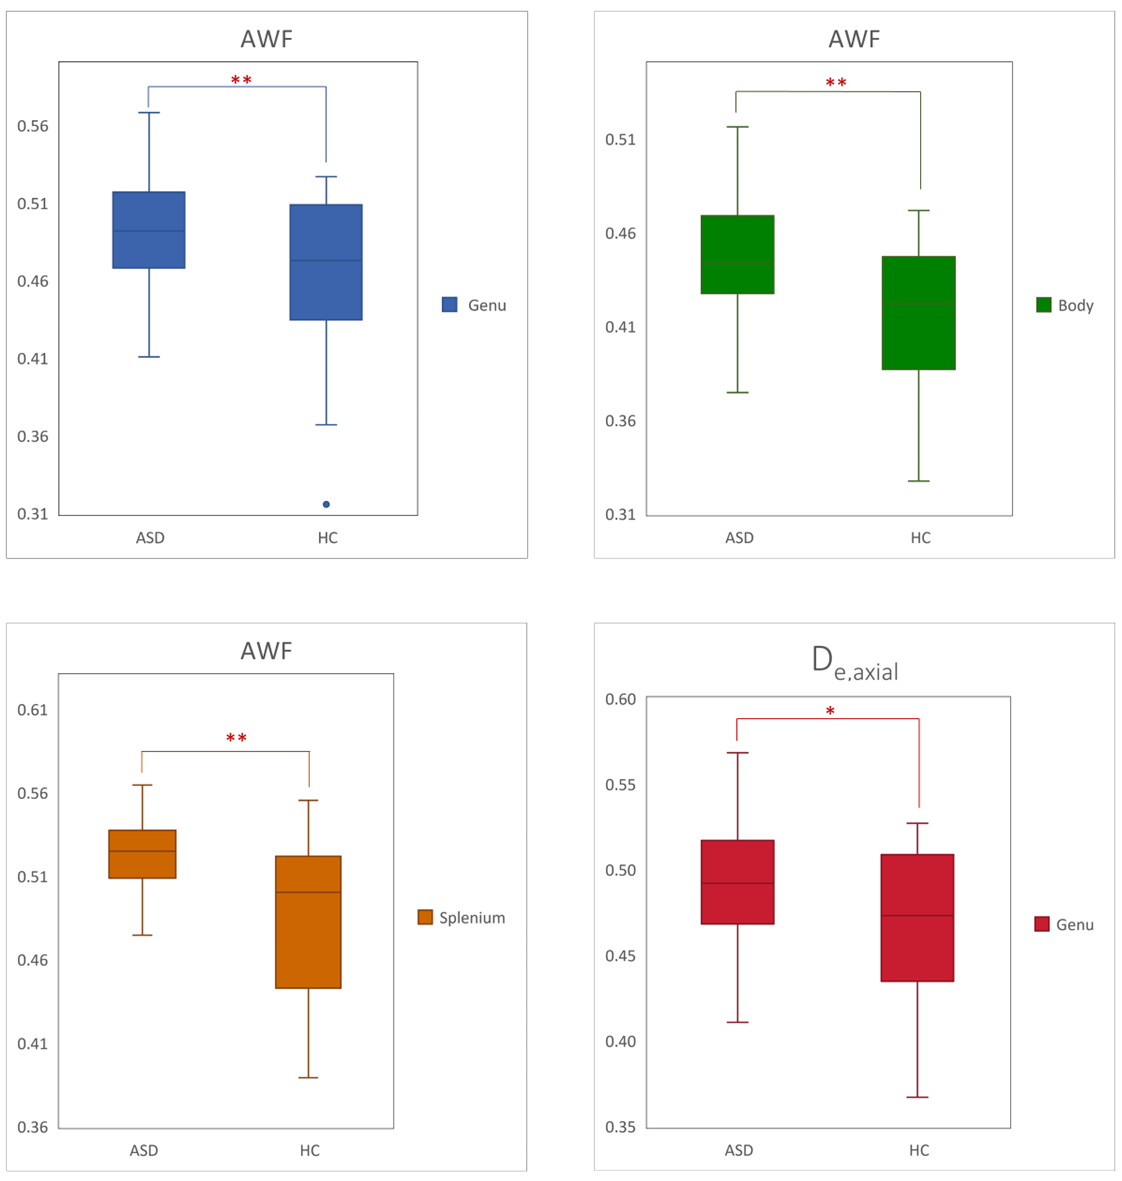
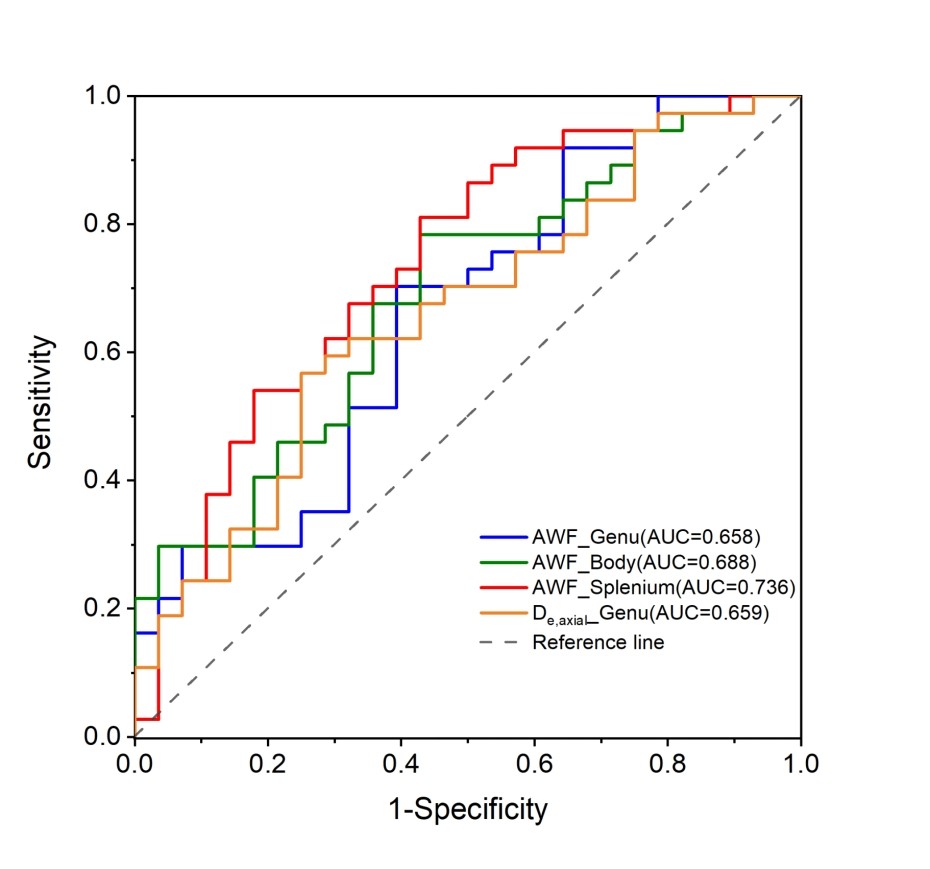
Compared to HCs, children with ASD exhibited significantly elevated AWF in extensive white matter areas in both cerebral hemispheres (p < 0.01, with family-wise error correction). These areas primarily included the corpus callosum, bilateral corticospinal tract (CST), bilateral inferior fronto-occipital fasciculus (IFOF), bilateral inferior longitudinal fasciculus (ILF), and bilateral superior longitudinal fasciculus (SLF) (Fig. 1). ROI analysis showed significantly increased AWF values within the corpus callosum(genu, body, and splenium) of children with ASD compared to HCs(p < 0.01). Additionally, the De, axial within the genu of the corpus callosum was also significantly higher in the ASD group(p < 0.05) (Fig. 2). The AWF of the splenium of the corpus callosum demonstrated the best performance in distinguishing between ASD and HC, with an AUC of 0.736 and sensitivities and specificities of 81% and 57% (Fig. 3). The other WMTI parameters did not exhibit significant differences between the two groups.Discussion
Previous studies have proposed that AWF is a specific marker for axonal loss, distinguishing it from demyelination. De,axial are indirect measures of myelination in axons. We observed increased AWF in extensive cerebral white matter in children with ASD, indicating a widespread decrease in axonal integrity. Altered axonal density may be one of the underlying pathological mechanisms in ASD. We also observed an increase in De, axial in the corpus callosum, indicating the presence of alterations in both axonal and myelin structures in this region.AWF values in the corpus callosum effectively differentiate ASD from healthy children, suggesting its potential as a specific marker for ASD.Conclusion
In conclusion, DKI-based WMTI metrics offer greater specificity in characterizing microstructure, enhancing our comprehensive understanding of white matter pathology in ASD and thereby providing deeper insights into the neuropathogenesis of the disorder.Acknowledgements
This project was supported by the National Natural Science Funds of China (Grants No.81870983 and 82371929).References
1. Lord C, Elsabbagh M, Baird G, Veenstra-Vanderweele J. Autism spectrum disorder. Lancet. 2018; 392(10146):508-20.
2. Diagnostic and statistical manual of mental disorders: DSM-5™, 5th ed. Arlington, VA, US: American Psychiatric Publishing, Inc.; 2013.
3. Dhiman S, Teves JB, Thorn KE, et al. PyDesigner: A pythonic implementation of the DESIGNER pipeline for diffusion tensor and diffusional kurtosis imaging. bioRxiv. 2021:2021.10. 20.465189.
4. Smith SM, Jenkinson M, Johansen-Berg H, et al. Tract-based spatial statistics: voxelwise analysis of multi-subject diffusion data. Neuroimage. 2006; 31(4):1487-505.
Figures